|
"You do have to know what time of market it is. Markets go in cycles
like all the other rhythms of life."
- "Adam Smith," The Money Game
9. The Cycles of Wall Street
Many scientists are presently involved with cycles, and the number
is growing each year.
But for the most part each is studying cycles
in his own particular field - economic cycles, earthquake cycles,
cycles of disease, cycles of animal abundance, and many more. Few
scholars, if any, outside of the Foundation for the Study of Cycles
are studying cycles as such.
One reason for this state of affairs is that among those who have
not examined the evidence there is a certain amount of skepticism
about the meaningfulness of these cyclic behaviors.
To allay this skepticism I thought it would be helpful if our method
and results were to be certified, as it were, by some of the world's
leading statisticians.
This has been done, and I still think it was a good idea, although
the concept was somewhat naive on my part. I believed that
scientists would come flocking to the study of cycles once they were
presented with irrefutable statistical proof that we were dealing
with facts.
In the past few years two friends have argued that my idea was
wrong. And what makes their comments particularly interesting is
that they are the last persons in the world from whom one would
expect advice of this sort.
They are, of all things, statisticians
themselves, and among the country's best, I might add.
They maintain that a fact without a theory to explain it, especially
if it doesn't fit into the ordinary concepts of how things "ought"
to behave, is merely a disturbing something to be ignored and, if
possible, forgotten.
Independently both these men said, in effect, the same thing:
"You
have already made enough discoveries to convince any reasonable
person that these mysterious behaviors do exist. It would be nice,
of course, to prove by mathematics the soundness of all that you
have done but don't let that be your prime concern. You are already
at the place where you can say, 'These things are so.' Now go on
from there and find out why!"
I do not mean to imply that my friends discount or decry statistical
proof.
They mean that all the statistical proof in the world, by
itself, without some sort of theory or explanation, will not create
the stir necessary to initiate full scientific participation in the
study of cycles. A mere fact, by itself, makes no impact on the
scientific community, especially if it runs counter to accepted ways
of thinking. Were he alive and reading these words, Galileo would be
nodding his head sadly.
All of this returns us to our search for the cause of our mystery.
Actually, however, we don't need to know cause to put a knowledge of
cycles to practical use, as you have seen. We now have good and easy
methods of detecting, isolating, evaluating, and projecting cycles.
We must, however, remember that cycles are not the whole answer.
Cycles are distorted by randoms. Moreover, the cycles themselves
occasionally "black out," miss a beat, give us two waves where there
should be three, or evidence some other aberration before they get
back on the track. Cycles, as yet, are not absolutely dependable,
but they certainly help us to know the probabilities.
And nowhere is this more evident than in the stock market.
Not even the most ardent "cyclomaniac" would claim that all
stock-market fluctuations are the result of cyclic forces. Even if
we knew all there was to know about cycles in the stock market, the
most we could do would be to predict that part of the market
behavior that was caused by cyclic forces.
But we can report facts that you should take into account if you are
an investor, facts that you are not likely to learn from the
hundreds of excellent books on the subject of stocks and bonds. I
have, in my library, a volume that is generally acclaimed as the
"investment bible" for anyone involved with the buying and selling
of securities. I have no doubt that at least one copy can be found
in nearly every investment broker's office in the country.
Nowhere
in its 700 pages of theory and practice is there a single mention of
cycles per se! And yet, perverse, frustrating, unex-plainable though
cycles may be, you cannot ignore the fact that they exist if you are
ever going to approximate the future probable behavior of the stock
market.
Before his death General Dawes, mentioned briefly in the last
chapter, asked me to inaugurate a service for banks and businessmen
that would tell them what to expect regarding future activities of
our economy. He suggested that I should charge a fair price for the
service, that he would subscribe, that his bank would subscribe, and
that he personally would write letters to all banks in the Midwest
urging them to subscribe too.
Naturally, I was pleased and flattered by his tempting offer.
However, I turned it down for the very simple reason that I did not
feel I knew enough about cycles to be able to accept the money. Over
two decades have passed since General Dawes made his proposal. If he
were alive and were to make that same proposal today, I would still
decline his offer, for despite all the clues we have uncovered in
the past twenty years, our ignorance still outweighs our knowledge.
We have countless pieces that obviously belong to our "mosaic."
They
are real. But no one, yet, has been able to put them all together.
No one, yet, has solved the great cycle mystery.
Perhaps this is the reason why the subject of cycles in the stock
market is so carefully avoided in most investment literature. It
cannot be substantiated scientifically, it cannot be catalogued, it
cannot be categorized, and it does not complement any familiar
investment theory. If it doesn't fit in anywhere, they say, let's
leave it out, for it would only further complicate an already
complicated subject.
And furthermore, if cycles really do exist, why
is there no scientific explanation for their cause?
Thus goes their
reasoning. How sad.
The Complicated Beat
Stock prices, like most other phenomena, fluctuate in cycles. More
exactly, like our complex cycle of rainfall in the previous chapter,
stock prices act as if they were influenced by a number of different
cyclic forces, all acting at the same time. Let me give you two more
examples of this type of behavior.
The cardiograph record of your hearbeats shows a simple rhythm of
perhaps seventy-eight beats a minute. But imagine what that chart
would look like if you had a second heart that beat, let us say,
forty-one times a minute. Now suppose you had three hearts, one
beating seventy-eight times a minute, the second forty-one times a
minute, and the third twenty-two times a minute. Can you imagine how
erratic the chart of your heartbeats would be?
And, of course, if
you had ten or twenty or thirty hearts, each beating at its own
special rate, you would have a mixture of ups and downs that would
be impossible to unscramble unless you knew something about cycle
analysis.
Or suppose we had a dozen or more moons, all of different masses and
all revolving around the earth at different rates. Can you visualize
how complicated our tides would be? Of course, knowing the laws of
physics, we could work from cause to effect, and knowing the cycles
of each of the moons by observation, we could trace their effect on
the oceans.
But suppose our sky was perpetually overcast, like the sky of Venus,
and we did not know the moons were there. It would be a long time, I
am afraid, before it would occur to anyone that the seemingly
haphazard movement of the water was due to anything but the winds.
Patient work over many years might be necessary before the mystery
could be unscrambled, the various moons postulated with certainty,
and predictions made with accuracy.
Conditions similar to these prevail in the behavior of stock-market
prices. We know that there are cycles there, but they are fully as
complicated as our pulse would be if we had a multitude of hearts,
or as the tides would be with a multitude of moons. Consequently, I
have lived for many years in a dilemma that is still unresolved.
On
the one hand, I have been reluctant to report about any one cycle in
the stock market, just as a student of the tides in a world with
many moons would hesitate to tell you about any one cycle in the
levels of the waters. On the other hand, I still do not know enough
to tell you about all the cycles.
I knew even less in 1944 when I
prepared a stock-market forecast that received considerable
attention.
My First Stock-Market Forecast
Early in 1944, at the urging of a large brokerage firm in New York
City, I prepared and delivered to them a forecast of stock-market
behavior. To complete this forecast I made a reconnaissance survey
of possible medium- and long-term cycles in the stock market. The
data used were annual averages of the Clement Burgess Index
1854-1870 spliced to the Combined Index of the Standard and Poor's
Corporation Index 1871-1943.
Only ten cycles over 4i/2 years in length were used in my
projection, ranging from one of 4.89 years to one of twenty-one
years. The forecast was as crude as Edison's first incandescent
light. It employed only annual figures instead of daily, weekly, or
monthly figures, which would have provided greater accuracy. No
cycles less than 4i/2 years in length were included, although there
are, without question, shorter cycles whose influence might have
advanced or retarded the crests from the time indicated by the
longer cycles. Also, since these stock figures go back only to 1854,
those cycles of ten years or longer have had an opportunity to
repeat only nine or less times, making their exact length difficult
to pinpoint.
Anyway, this fool rushed in where men of good sense feared to tread,
and the ten-year results can be seen in Figure 33. The ten cycles
are synthesized into one forecast curve (broken line); the solid
line shows what actually happened.
The "forecast" correctly called for 1946 as the end of the bull
market, correctly called for 1949 as the end of the bear market, and
called for 1954 as the end of the bull market that followed. Over a
ten-year period it had a gain-loss ratio of 185 to 1.
From the moment of its introduction everyone who came into contact
with the forecast was warned by me that it was not to be considered
as a forecast but merely as the result of a reconnaissance survey
that had to be surrounded by the word if.
It was merely a mock-up to
indicate possible future behavior if the indicated cycles were real
and continued, if the length, shape, amplitude, and timing of the
cycles had been correctly determined, if there were no other
long-term waves that had not been taken into account, if the
short-term waves less than 4½ years in length
Fig. 33.
A Stock-Market Forecast
This forecast was prepared early in 1944 using figures through 1943
only.
For the ten years during which the market behaved as
predicted, the gain-loss ratio was 185 to 1.
(which were not used) did not gang up on the long-term waves and
distort them, and if no accidental factors entered into the
situation.
After ten years the "forecast" went awry, but it is still a source
of wonderment and pride to me that it continued to function
accurately for a decade despite its primitive preparation. After
all, Edison's first filament glowed only for a few hours.
Like the first light bulb, we have come a long way in our study of
cycles since our first minor successes. The use of computers has
greatly accelerated our progress at the Foundation during the past
few years, but they have also shown the immense amount of work still
ahead before we can forecast stock-market activity successfully. In
1965, for example, an analysis of stock prices was undertaken with
computers, searching for all possible hints of cycles in common
stocks from 1837 up to that time.
When the search was completed and the computers had ceased to purr
and the final logarithm table had been put away, we had discovered
hints of thirty-seven possible cycles in stock-market prices,
ranging in length from 2½ years to nearly 111 years!
Even the
possibility of ten or twenty moons affecting our tides or ten or
twenty hearts beating complex rhythms on our cardiograph chart seems
fairly simple in comparison. To refine and verify all these cycles
will take years.
Eventually it will be accomplished, but while you
are waiting, let me tell you some of the facts we already know about
stock-market behavior and forecasting.
Forecasting by Means of Cycles
First of all, let me explain trend.
Trend is the general direction
in which a series of figures is headed, up, down, sideways, etc. It
changes its direction slowly. It is the element that represents
growth, and in the stock market it accounts for the major part of
all movement in the annual stock prices. Cycles and randoms play
only a minor role.
Trend is that upward sweep you see when you chart your figures on a
sheet of graph paper. Trend is the general direction your figures
are going after the ups and downs and zigs and zags have been
removed. It is usually plotted by averaging a number of years for
each position on the graph. It is the erratic fluctuations of your
figures refined to a single and fairly smooth line. In political
terms, it is the middle-of-the-road line between your various high
and low points.
This trend line can be projected into the future to
show what the underlying growth element will be if growth behaves
the same way in the future as it has in the past.
Growth, like almost everything else, obeys laws, and the law of
growth is very simple; everything in the universe that grows will
grow at a slower and slower rate as it grows older, and it will
eventually level off and attain a stability from which it will die
unless something new is added to create a "rebirth."
This little-known law can be applied to, among other things, any
business operation.
One man, who heads the largest organization of
its kind in the world, credits what I wrote in an earlier book about
the law of growth with helping him and his company to earn millions
of dollars. New ideas, new products, new methods of distribution,
and new personnel constantly keep his company alive and youthful,
with no indication of leveling off after four decades of continuing
growth.
The projection of a trend is a very tricky and complicated matter
and its details will not be discussed here. What I want to point
out, however, is that the upward sweep is a mixture of trend,
cycles, and randoms. To know what the true trend has been you must
remove the cycles and the randoms by some smoothing process. This
smoothing process will remove the randoms and the shorter cycles.
The longer cycles will usually remain but they must be determined as
accurately as possible and accounted for in order to get a realistic
projection into the future.
Let me give you an example. Suppose a certain series of figures has
evidenced normal growth and, in addition, has a fifty-year cycle
cresting in 1850, 1900, and 1950. That is, the cycle will be going
up from 1875 to 1900 and from 1925 to 1950. It will be going down
from 1850 to 1875, from 1900 to 1925, and from 1950 to 1975. The
trend and the cycle are charted in Figure 34a.
When the cycle is in its upward phase (or leg), it will reinforce
the trend and make it seem stronger. When the cycle is in its
downward phase, it will tend to offset the trend and make it seem
weaker.
But the trend, like the equator, is an imaginary line. You cannot
see it when you look at your graph of actual price behavior. What
you actually see, for the example given, is shown in Figure 34b. (In
real life, of course, the line would have many more erratic zigzags
than our simplified example, since it would be clouded by other
cycles and by randoms.) It is from a study of this zigzag line that
we must deduce (guess) the underlying trend.
Now suppose we were not aware of a fifty-year cycle in our figures
and tried, in 1950, to project our trend line into the future. We
might guess that it would continue strongly upward as charted by the
broken line in Figure 34c.
Suppose, however, we are doing our guessing in 1940 when the upward
leg of the fifty-year cycle is only a little over half completed. If
we did not know about the fifty-year cycle, our projection might
well look like the dotted line in Figure 34d.
Obviously neither projection is correct. As we know by construction,
the true trend line is the one shown by the broken line in Figure
34a, and we can only project this into the future when we take our
fifty-year cycle into account. But herein lies the danger, for our
fifty-year cycle has only repeated a very few times. It may not
continue to come true. And if it doesn't, there goes your forecast.
Why wouldn't our fifty-year cycle continue to come true? Let's
consider just two possibilities at this time. First, it has repeated
only three times. As you know by now, this could have happened just
by chance.
Three times are not very many when you compare it with
your playing cards alternating red and black through the entire
deck, or the Canadian lynx and its abundance cycle.
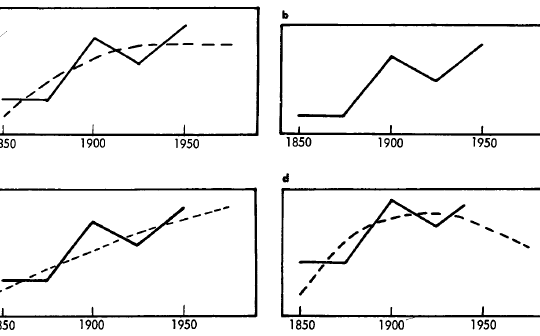
Fig. 34.
Trends and Cycles
But more important, and more germane to our stock-market
situation, the fifty-year cycle in our example could be a
combination of many closely related cycles.
A cycle of this sort is
non-chance, it is perfectly real, it is statistically significant,
and yet it will not continue. A study of Figure 35 will show you
why.
For the moment look only at the bottom zigzag line (D). Note that
from 1854 to 1896 we have what appears to be a fairly regular cycle
that averages about 5.7 years in length. Then it disappears for
about twenty years!
Our 5.7-year cycle was never a cycle with a life and a beat of its
own! It was a combination of three other cycles, closely related. A
is 4.89 years long, B is 5.50 years long, and C is 6.07 years long.
While they marched along pretty much in step from 1884 through 1896,
their combination produced a 5.7-year cycle. But by 1897 they were
no longer synchronizing.
For example, in 1896 C was going up while B
was coming down.
Everything flattened out and the 5.7-year cycle
vanished. Around 1918 it is beginning to appear again as cycles A,
B, and C begin to get back in step, but this is small consolation to
your forecast made in 1896, isn't it?
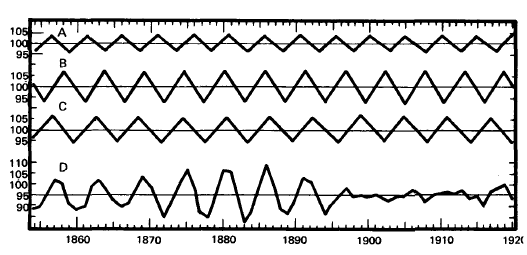
Fig. 35.
Three Cycles and Their Combination
A is a 4.89-year cycle, B is a 5.50-year cycle, C is a 6.07-year
cycle.
D is how all three look when combined.
A false cycle is
created and eventually disappears.
Furthermore, when it does reappear, the 5.7-year cycle will be upside down
compared to its previous rhythm. Its highs will be where its lows
were before and vice versa.
How Stocks Behave
More than 1,600 stocks are listed for trading on the New York Stock
Exchange, not to mention 1,200 bond issues.
Stocks not only act with
complete individuality, they also tend to group with others in their
particular industry and behave differently from other groups, each
group acting as if it had its own set of cycles.
Of course, many of the cycles are present in many different things,
but they are present in different combinations and in different
proportions, somewhat akin to words. We have only twenty-six letters
in our alphabet but they combine into hundreds of thousands of
words, all different.
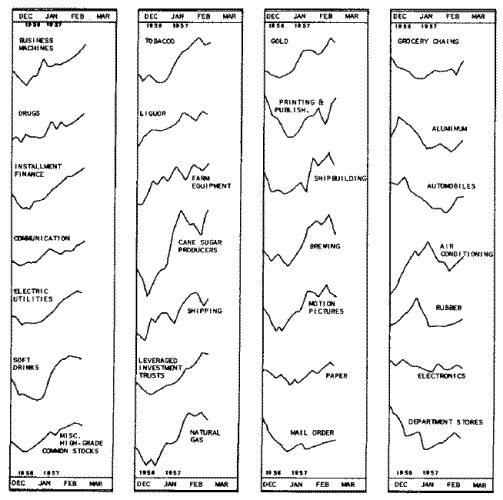
To emphasize this difference Figure 36 demonstrates the varying
behavior in fifty-six different groups of stocks over a three-month
period. These charts represent the percentages by which each
particular group was above or below the market trend as a whole, and
are reproduced by permission of Mr. E. S. C. Coppock, of San
Antonio, from part of his regular TRENDEX service to clients.
Commodity prices, sales of individual companies, or almost anything
else would show similar differences.
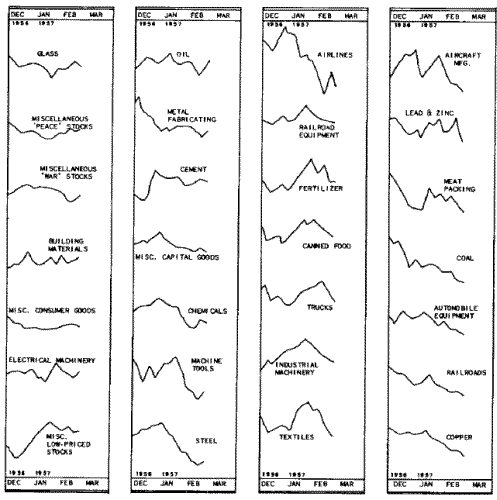
Fig. 36.
The Individuality of Stocks
These charts emphasize the various behaviors of several groups of
stocks.
To further complicate matters similar variations
are often
found among stocks of each group (after Coppock).
The 9.2-Year Cycle in Stock Prices
There are those who insist that stock prices have no structure-that
each day's motion is a purely random variation from the prices of
the day before, triggered by tips and valid information flowing into
the marketplace in a correspondingly random fashion.
Such people feel that a bull market is merely a period when, by
chance, the upward movements predominate over the downward ones,
while a bear market is a period of reverse behavior. According to
them, stock prices evidence what is known as a "random walk" and any
analysis of their past behavior is worthless in forecasting future
behavior.
Of course, if stock behavior is an example of random walk, there can
be no cycles except by chance. When one discovers a cycle that
cannot be chance more than once in a hundred times or once in a
thousand times, the proponents of the random-walk theory reply that
"This is the hundredth time," or "This is the thousandth time." Were
you to confront them with the cycle I am about to show you, they
would have to say, "This is the five-thousandth time," for,
according to the Bartels test of probability, the 9.2-year cycle
could not occur by chance more than once in 5,000 times.
The 9.2-year cycle has repeated fourteen times since 1834, two years
before the siege of the Alamo and ten years before Samuel Morse sent
his first message over a telegraph line (see Figure 37).
One evidence of a cycle's significance is the presence of cycles
with the same period in other phenomena.
Cycles variously measured
from 9.15 to 9.25 years in length have been found in a variety of
phenomena such as business failures, pig-iron prices, partridge
abundance, the levels of Lake Michigan, the thickness and thinness
of tree rings, average wholesale prices, and the number of patents
issued.
Because so many other completely unrelated phenomena display
similar cycles, we must seek the cause of our 9.2-year cycle outside
the market itself. What force triggers the 9.2-year cycle in these
various phenomena and in stock-market prices is still unknown.
Before we leave the 9.2-year cycle, I ask you to study Figure 37
once more. As you will note, its current ideal crest was due in 1965
(1965.4 to be exact).
According to its past rhythm, it was scheduled
to turn downward (below the trend) somewhere close to 1965.4.
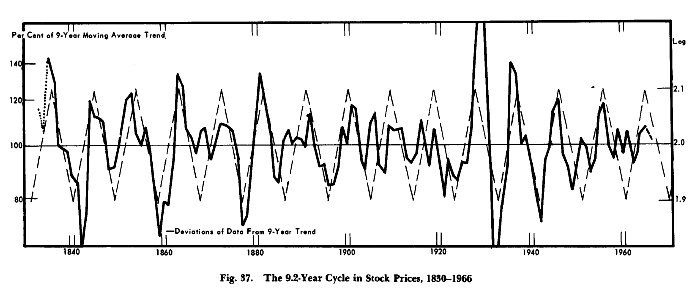
Fig. 37.
Remember, we are working with nine-year moving averages to compute
our trend line so that we cannot actually know where our trend line
is for 1966 until we have the stock averages for the nine years from
1962 through 1970.
We will not know where our trend line is for 1967
until we have the stock averages for the nine years from 1963
through 1971, etc.
And without our trend line, of course, we cannot
tell whether the stock prices for that particular year were above or
below the trend, nor can we compute, in percentages, how much above
or below the trend line we were for any particlular year as depicted
in Figure 37.
Thus as I write this, in the waning months of 1969, it is too early
to tell if the 9.2-year cycle did, indeed, reach a crest in the
vicinity of 1965.4 and then turned downward. However, I have
completed some preliminary work that enables me to make an estimate
of the trend for 1966 without waiting for the 1970 stock averages.
Estimating where the trend will be, I have ventured to show the
curve for 1965-1966 as a broken line on Figure 37. You will note a
peak in 1965, exactly at the time of ideal turning (1965.4).
Whether or not the 9.2-year cycle did hit its expected low in 1970
will not be known for several years (1966 through 1974 figures are
required to complete the 1970 moving average trend).
However, the
prudent investor cannot ignore the behavior of what is perhaps the
most important cycle discovered to date in stock-market prices.
The Forty-One-Month Cycle
Another cycle that has done all in its power to keep cycle
scientists humble is one averaging 40.68 months in length.
It has
been present in industrial common-stock prices since 1871 and was
discovered in 1912 by a New York group of investors. These gentlemen
had learned that
the Rothschilds had analyzed British consols
(government obligations) and had broken up the price fluctuations
into a series of repeating curves that had been combined and used
for forecasting.
The New York group hired a mathematician to discover the secret
formula of the Rothschilds, and working with the Dow-Jones Railroad Averages, he discovered a forty-one-month cycle, plus
three others, which his employers used to help them invest in the
market. Apparently they were very successful around World War I.
Some ten years after the original discovery, Professor W. L. Crum,
of Harvard, noted a cycle of "39, 40, or 41 months" in monthly
commercial-paper rates in New York. Almost simultaneously, Professor
Joseph Kitchin, also of Harvard, discovered a cycle that he called
forty months in six economic time series, bank clearings, commodity
prices, and interest rates in both Great Britain and the United
States from 1890 to 1922.
As far as I know, it was not until 1935, twenty-three years after
the original discovery, that this cycle was again noticed in the
stock market. Our old friend Chapin Hoskins, who knew nothing of the
earlier work, discovered this cycle in many series of price and
production figures, including common-stock prices. Early in 1938 he
made an extensive study of this cycle for one of the large
investment-trust services.
Figure 38 shows the forty-one-month cycle (now refined to 40.68
months) from 1868 through 1945. As you can see, while its waves are
not identical to an ideal 40.68 wave, which is represented by the
broken zigzag, there is an amazing correspondence between them. This
cycle persisted through wars and peace, good times and depressions.
Then, in 1946, something strange happened to our cycle. Almost as if
some giant hand had reached down and pushed it, the cycle stumbled,
and by the time it had regained its equilibrium it was marching
completely out of step from the ideal cadence it had maintained for
so many years. As you can see in Figure 39, it has regained the
approximate beat of forty-one months or so, as before, but its
behavior now appears upside down on our graph.
Scores of explanations and reams of paper have been expended to
explain this behavior.
We are familiar with most of the
possibilities, such as distortion by random behavior, two or more
other cycles of near lengths, and even a general public knowledge of
this particular cycle, which may have had a distorting effect on its
timing.
But, in truth, no one can positively explain what happened
in 1946 any more than they can explain the regularity of the rhythm
for all the years that preceded it.
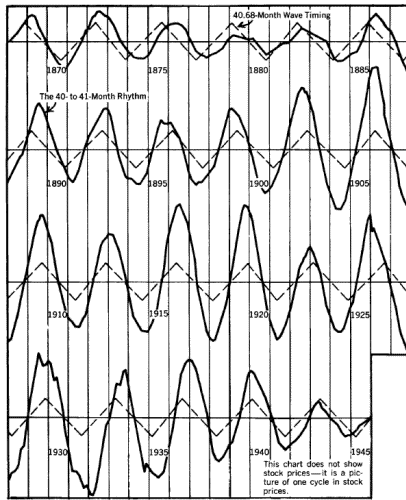
Fig. 38.
The 41-Month Rhythm in Stock Prices, 1868-1945
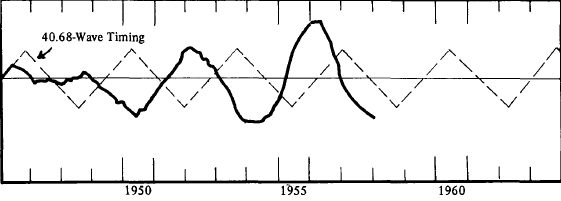
Fig. 39.
The 41-Month Rhythm, Upside Down, 1946-1957
The Endless Parade
If you were to review all the old issues of Cycles, you might find
as many as two hundred different cycles alleged in stock prices.
It
would be an easy matter to fill this book with descriptions of
various stock-market cycles to which we attach some significance.
Chapter upon chapter could be filled with "coincidences"; for
example, the 18.2-year cycle in the stock market matches cycles of
similar length in marriages, thickness and thinness of Java tree
rings, floods on the Nile, immigration, real-estate activity, loans
and discounts, construction, and panics.
We could tell you about the 6.01-year cycle and the 17.16-week cycle
and all of the thirty-seven hints of cycles recently discovered by
our computers.
To refine and verify these thirty-seven possible
cycles in the stock market, as I mentioned earlier, will take years.
Yet when this is finally completed and the cycles that stand up are
combined and projected into the future, we still have little
assurance that our forecast of future price behavior in the stock
market will come true for very long.
What good are cycles, then? For
forecasting!
But only when we know much more about them than we do
now.
A Reply to Roger Babson
Many years ago I received a letter from one of America's great
geniuses in the field of investment, Roger Babson.
Mr. Babson, too,
was searching for the answer to the stock-market cycle enigma. His
letter, and my reply, will perhaps give you some concept of the
mystery that confronts man in the market.
He wrote:
Dear Mr. Dewey:
Perhaps some month you would write an article on the causes of
cycles - taking the business cycle as an illustration. The Babson
Organization is coming to believe that the impatience of people to
buy or to sell is surely the cause of the Stock Market Cycle.
Would you say it is also an important cause of the general business
cycle? We are now getting data on the "feelings" of over 400
different communities, but we have not yet determined how to weigh
these.
How do you feel about new inventions, products, and methods which
are now on drawing boards and in test tubes affecting the duration
of a business cycle? Surely the automobile industry has been a
factor almost equal to a world war. If atomic energy is used for
peaceable purposes could this be a factor in lengthening the normal
business cycle?
You will be interested to know that we have on our
payroll three persons who spend their entire days at the Patent
Office carefully scrutinizing all the patent assignments.
I replied to Mr. Babson as follows:
Dear Mr. Babson:
Answering your last question, first, I believe that inventions are
important elements in the growth trend of individual companies, of
individual industries, and doubtless of manufacturing as a whole,
but I do not believe they have any effect whatsoever upon the
duration of a business cycle.
As I see it, business cycles are generated by consumers.
I am not sure whether it is the feelings of people as consumers or
the energy of people as consumers which cause business cycles.
Perhaps it is both, but my guess is that people's feelings are
probably the most important factor.
I think you are on the right track in attempting to measure feelings
of various communities.
If I were given the job of measuring the feelings of a community, I
would keep as far away as possible from bankers, executives, and
intellectuals. Such people are not close to feelings of the mass as
bartenders, barbers, taxicab drivers, laborers, garage mechanics,
waiters, and other average folk. Bankers and executives will tell
you what they think, but this isn't what you want to know.
You want
to know what the great body of people feel.
I dare say that in attempting to determine the feelings of
communities you have proceeded just as I would have done.
It seems to me - as it doubtless does to you - that impatience is one
aspect of feeling. I can imagine that it could easily be of great
importance.
I once believed that stock prices were determined by the mass
emotions of the buyers and sellers of stock. I felt that when stock
buyers were optimistic they bought, when they were pessimistic they
sold. This may indeed be a factor in market prices, but I no longer
believe that it is the controlling factor.
My present conjectures
are something like this:
Consumers of shirts, let us say, suddenly feel pessimistic and
fearful. They refrain from buying shirts. Presently, shirt retailers
note large inventories and refrain from buying. Shirt wholesalers
soon cut back on their order to manufacturers. Eventually
manufacturers of shirts are forced to curtail production. Very smart
stock market operators, learning of the actual or proposed
curtailment of production, sell the stock of the shirt manufacturer.
As shirt manufacturing acts as if it were influenced by rhythmic
forces of precise mathematical length, we must conclude - if the above
conjectures are correct - that something stimulates the buyers of
shirts at precise mathematical intervals. As they act together more
than not we can conclude that this something is environmental - that
is, outside the individual shirt consumer. What this environmental
factor is, is not known.
The production of shirts does not fluctuate in any simple way. It
acts as if it were subjected simultaneously to random factors and to
a great variety of rhythmic forces which sometimes pull together and
strengthen each other; sometimes oppose and weaken each other. If
shirt manufacturing is the result of shirt consumption, it follows
that the consumers of shirts are, on their part, influenced by a
variety of cyclic forces, and because consumers act the same way
more often than not, we may conclude that all these cyclic forces
are environmental.
So far, it is clear sailing. Just as we are bathed by light of
various wave lengths to which our eyes respond, I think it perfectly
reasonable to assume that we may be bathed continuously by energy
waves of much greater wave length which we perceive dimly through
our emotions - waves which alternately elate and depress us and/or
energize and relax us.
But here is where the theory breaks down - or perhaps we should say
where it has not yet been built up. Why is it, if all this is the
case, that buyers of cigarettes, for example, respond predominantly
to 8-year environmental cycles, whereas buyers of shirts respond
more actively to 2-year cycles? What differentiates the buyer of
cigarettes from the buyer of shirts, especially when he is likely to
be the same person?
This seems utterly fantastic and unreasonable to
me, but it seems equally unreasonable to assume that the
manufacturers of shirts, for example, have very much to do with the
demand for shirts.
The cycles must, pretty largely, originate in the
consumer.
Perhaps someday we will understand all these things better. But, in
the meantime, if we want to forecast the behavior of any figures
which act as if they were influenced by these cyclic forces, we can
be assisted if we learn all the wavelengths involved as reflected in
the figures themselves.
This is true even if we do not yet know the
mechanisms whereby the cyclic forces operate.
The Blank Spot on the Map
Forecasting the stock market is, ideally, a full-time occupation.
At
the very least it is a full-time avocation. For the person who is
willing to give the subject the proper amount of time, a knowledge
of cycles can be of real help, as I know from correspondence and
meetings with many members of the Foundation.
The failure of economics to become a science is due to the failure
of economists to recognize that there are natural rhythmic forces in
our environment to which human beings respond. It will never become
a science until economists learn to distinguish between the effects
of these forces and the true economic forces also present.
Forecasting economic events involves forecasting three separate
elements or factors. First, you must forecast the basic underlying
growth trend, the situation that changes only slowly over the years.
Next, you must forecast the cyclic factor, the rhythmic ups and
downs that, if you have determined them correctly and if they are
significant, usually continue.
Lastly, you must forecast the noncyclic factors. As part of this
third element, when you are forecasting prices, or anything measured
in dollars, you must take into account the fact of inflation and
remember that it now takes two or more paper dollars to buy what
could be bought for one gold dollar, if by luck you had one.
I know little more about the noncyclic elements in the stock market
than you do. Probably not as much.
And I have always rejected the
temptation to allow myself to be drawn into giving my own opinions
on subjects about which I know nothing. You can get opinions from
countless other sources of information.
But the trouble with most sources of economic information is that
they probably know little or nothing about the rhythmic cycles, and
their lack of knowledge leads them to make false deductions about
cause and effect.
For example, a bit of bad war news hits the front
page and the price of stocks goes down.
"Ah ha," the experts say. "Bad war news means lower stock prices!"
But suppose the decline was
really due to the downturn of a cycle and the dip in the market had
nothing to do with the bad war news?
However, with their bad-war-news theory, many would be led to make a
false forecast the next time bad war news appeared. The next time,
after bad war news appeared and the experts predicted a decline, the
price of stocks might go up! That's why forecasters have ulcers.
It is impossible to make adequate economic forecasts without taking
cycles into account. In fact, it is impossible to have an adequate
economic theory without taking cycles into account. Economics is
properly the science of the divergence from cyclic patterns. It is
as ridiculous to attribute the nine-year cycle to, let us say,
economic factors as it would be to say that economic factors are
responsible for the summer boom in the ice-cream business or the
winter boom in fuel oil.
A knowledge of cycles can be as valuable in your forecasts of
stock-market behavior as a barometer is to a weatherman, but you
must never forget that the barometer is only one of the tools used
to prepare a weather forecast.
Nevertheless, who would think of preparing a weather forecast
without a barometer? I know a professional stock-market forecaster
who uses nine different methods to show him what's ahead.
This is the sort of thing you should do if you want to be a
forecaster.
The forecaster I refer to won't use a method until he has tested it
carefully and painstakingly for at least ten years. He does not use
a knowledge of cycles because he has been testing cycles for only
about seven years. Some time ago I wrote him to inquire how his
cycle tests were coming out. As nearly as I can remember his words,
he replied that the results were phenomenal and amazing. I have no
doubt that if his present success continues, he will, in time,
commence to use a knowledge of cycles as a tenth method to help him
forecast market behavior.
Through the years I have had to answer the same question an
uncounted number of times. It goes something like this:
"Why don't
you concentrate all your time and effort on the stock-market
cycles?"
My reply usually raises a few cynical eyebrows.
I say,
"Because,
basically, it isn't my job. My job is to find out about cycles - all
sorts of cycles - how they work, what causes them, how to tell
significant ones from random ones... all that sort of thing."
To learn one thing I may have to study corn prices; to learn another
I may have to study war; to learn another I may have to study
earthquakes. The subject is as big as the whole wide world. If I
limit myself to one little corner of it, I'll never get anywhere.
So my choice is simple. Shall I become a stock-market expert, or
shall I try to learn something about cycles? I cannot do both, and
since I am not worried about the source of my next meal - and what
more does one really need? - I can, fortunately, make a choice.
I'm trying to learn all I can about cycles... one of the great
blank spots still remaining on the map of science.
Back to Contents
|


