|

by Bud Bromley
May 27, 2021
from
BudBromley Website
|
Bud is a retired life sciences executive.
Bud's entrepreneurial
leadership exceeded three decades.
He was the senior business
development, marketing and sales executive at four public
corporations, each company a supplier of analytical and life
sciences instrumentation, software, consumables and service.
Prior
to those positions, his 19 year career in Hewlett-Packard Company's
Analytical Products Group included worldwide sales and marketing
responsibility for Bioscience Products, Global Accounts and the
International Olympic Committee, as well as international management
assignments
based in Japan and Latin America.
Bud has visited and
worked in more than 65 countries
and lived and worked in 3
countries. |
Image: Union of Concerned Scientists
The atmospheric concentration of CO2 gas is continuously adjusting
to maintain the concentration partition ratio K derived in
Henry's Gas Law.
Henry's law partition ratio is independent of the source of the
CO2.
The net average atmospheric concentration of CO2 (~400 ppmv) is
independent of human CO2 emission.
Human CO2 is
fully compensated in
(and only a small part of) the natural global CO2 fluxes in the
environment...
Ocean has been estimated to make up 98% of the hydrosphere. (Mason,
1958)
Rainwater is less than 2% of the hydrosphere.
Mason points out
that ocean is 98% of the hydrosphere but he does not specify the
rain portion.
Mason states that no significant error will be made by
assuming the average CO2 concentration in all water is the average
of sea water.
According to Henry's Gas Law, the giant mass of CO2 gas in ocean
water, on the order of 40,000 gigatons of carbon (4 x 10¹³ metric
tons) and temperature regulate the atmospheric CO2 gas concentration
and the CO2 fluxes in the atmosphere, ocean, biosphere and even in
rainwater droplets.
The timeframe for each of these fluxes is
different.
Following Henry's Law, the high solubility of CO2 gas in
liquid water means the atmosphere is scrubbed of CO2 gas by the
enormous volume of liquid water in the ocean, air and soil.
Flow and flux are not the same.
Flux is a directional vector of an
amount of material flowing per unit time through a unit area. In
this case, the unit area is the surface area of water everywhere
which is in contact with atmosphere.
A CO2 flux is the amount of CO2
flowing per second per square meter of water surface.
There are
enormous, continuous fluxes of CO2 in two directions, into the
atmosphere and into water, controlled by temperature and surface
area, and both of these directional fluxes are more than 10 times
larger than fossil fuel emissions.
Now, please watch the very short video below. Pay close attention to
the relatively high Henry's Law solubility constant K for CO2 and
the professor's short discussion about ammonia being scrubbed by
water due to its very high K.
Similar to the professor's example
with ammonia,
raindrops, ocean and water in soil scrub CO2 from the
atmosphere based on the Henry's Law K for CO2 and water...
"The total CO2 produced by the burning of the annual production of
coal and oil is 6.2 x 10¹⁵ g or about 1/300th of the amount in the
atmosphere today.
This might suggest that at the present rate of
consumption of fossil fuels atmospheric carbon dioxide will be
doubled in 300 years.
However, in this connection the importance of
the hydrosphere as a reservoir of carbon dioxide should be
emphasized; its significance has been discussed by Revelle and Suess
(1957).
Sea water contains 20 g of CO2/cm2 of the earth's surface,
as against 0.4 g/cm2 in the atmosphere. Oceanic and atmospheric
carbon dioxide are interdependent, the former being a function of
the partial pressure of CO2 in the atmosphere.
Thus to double the
partial pressure of carbon dioxide in the atmosphere would require
the addition of much more than is now present therein, because most
of that added would be absorbed by the .
Similarly, to decrease
the carbon dioxide in the atmosphere by half would require removal
of many times the present content.
It is apparent that the
oceans,
by controlling the amount of atmospheric CO2, play a vital part in
maintaining stable condition suitable for organic life on the
earth."
(Mason, Page 211-212.)
Note in the above quotation, the 50:1 ratio of grams of CO2 in sea
water to grams of CO2 in atmosphere.
The partition ratio of CO2 gas
between water and air is governed by Henry's Gas Law which results
in about 50 times higher concentration of CO2 gas in water than in
the air around or above the water.
The absorption of CO2 gas into
the surface of water is very fast (sub-second) and driven primarily
by water temperature.
Colder water absorbs far more CO2 than warm
water.
Warm water emits CO2 gas into the air.
The distribution of
CO2 gas horizontally and vertically in atmosphere is not as fast,
but I will not discuss these chaotic processes here.
The dissolution time of aqueous CO2 gas into its various dissolved
carbonate forms is very fast (seconds.) The chemical reaction of
carbonate ions with oceanic buffering systems is very fast
(seconds.)
The calcium buffering system of ocean will be discussed
briefly as an example.
Absorption and emission of CO2 from the surface of water acts
locally on every square centimeter of water surface every second.
Normalizing temperature and CO2 concentration by averaging removes
information and adds no value to the analysis.
The temperature
difference above and below about 26ºC are the critical variables
which define whether CO2 is being absorbed or emitted at a
particular location and time.
The temperature controls the direction
of the flux.
The temperature difference and surface area at that
temperature control the amount and the velocity of the flow.
All of
that information is missing when only a global average temperature
is used.
"The average temperature of the ocean surface water is
about 17ºC (62.6ºF)."
Temperature of Ocean Water, University of
Michigan. August 31, 2001
The average temperature of ocean surface
water is irrelevant to the Henry's Law equilibrium and to the
solubility chemistry of CO2 in water.
The average of very large
chaotic fluxes is a meaningless number with no predictive value.
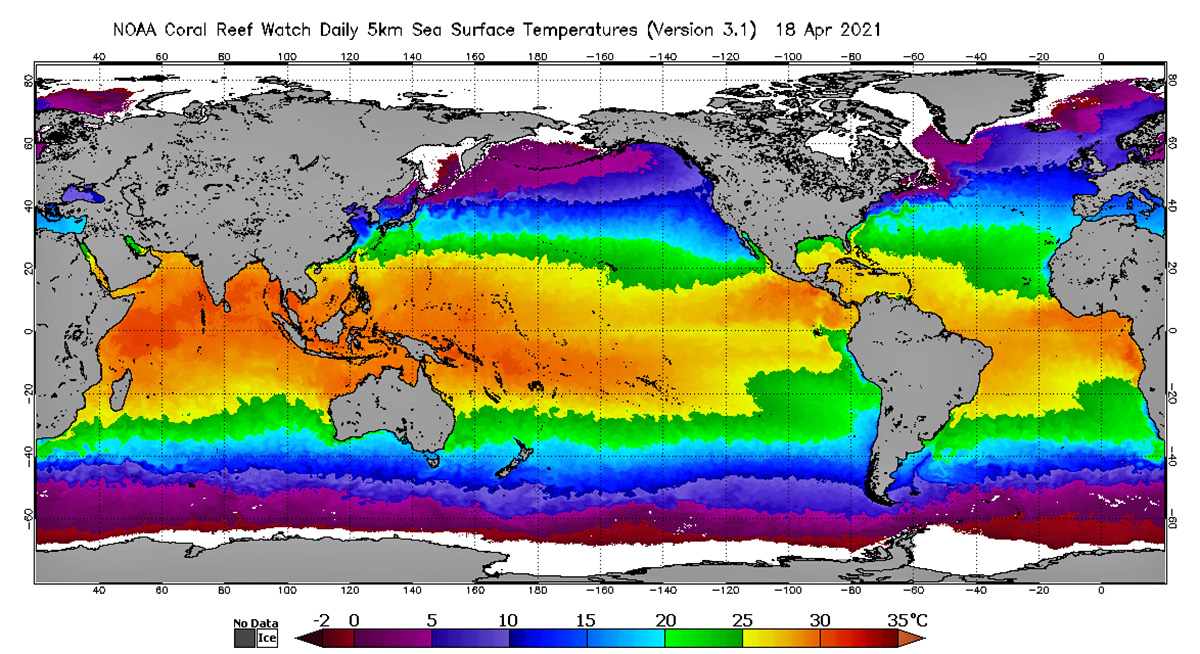
In the graphic below we can easily see where CO2 is emitting into
air and where CO2 is absorbing into ocean and soil. A global average
temperature would tell us nothing. When temperature exceeds 26ºC,
CO2 will be emitted from water.
When temperature is less than
26ºC,
CO2 will be absorbed into water.
We can also infer from this graphic
that there are enormous fluxes of atmospheric CO2 gas from the
equator to higher latitudes near both poles.
In fact there are many
cells in the atmosphere and in the ocean each with its own CO2 flux.
At a few thousand meters altitude above sea level where water vapor
and aerosols condense into liquid water droplets, and anywhere
condensation occurs, the surface of water droplets will be either
absorbing or emitting CO2 based dominantly on temperature.
Henry's
law determines the solubility of CO2 gas in all water, not only in
ocean water.
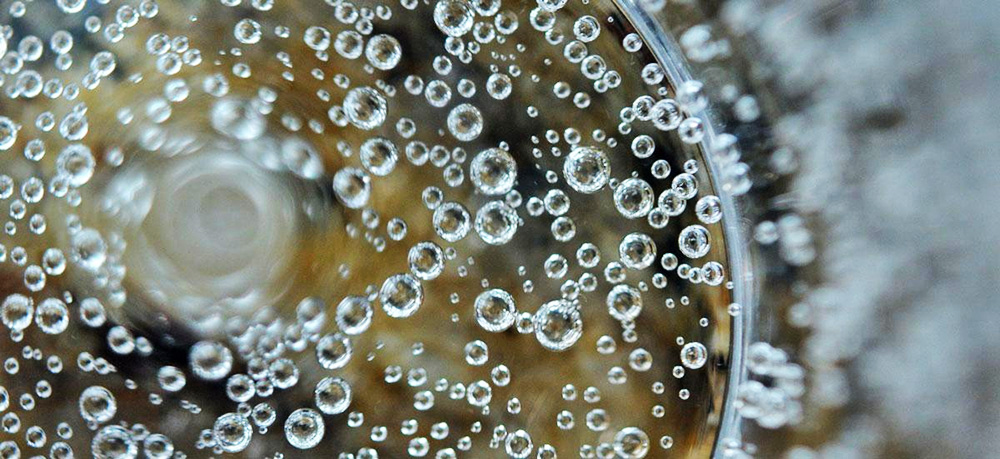
The CO2 gas concentration in your beverage is changing
in real time.
If the top of a can or bottle of a carbonated beverage is removed,
or the beer is tapped from the keg into your glass, initially the
CO2 gas concentration in the liquid beverage will immediately
decline because the total pressure of the gases above the liquid is
significantly less than the total pressure of the mixed gases above
the liquid in the closed keg.
After that, the aqueous CO2 gas
concentration in your beverage will continue to decline until the
liquid and air above it reach the Henry's Law equilibrium partition
ratio K, which is based primarily on the temperature of your
beverage.
Addition of salts or acids to the liquid increases the aqueous CO2
gas concentration.
Carbonated beverages typically contain a small
amount of acid, for example phosphoric acid, for retention of
aqueous CO2 gas in the liquid.
Rain scrubs chemicals such as sodium
chloride from the air which become ionic in raindrops and that in
turn changes the aqueous CO2 gas concentration in raindrops.
That is
all I will say about this subject here...
Henry's Law only applies to the solubility of gases into liquids
when the gas concentrations are low.
When they are low, such as rare
gas CO2 at 400 parts per million, then concentration of CO2 gas in
the liquid and in the air above the liquid can be calculated and
measured with very high accuracy and precision.
Henry's Law is the
basis of the multi-billion dollar per year scientific
instrumentation industry of gas chromatography.
GC's are used
routinely in almost all industries involving chemistry from perfumes
to paint to healthcare to refineries.
Henry's Law partition only applies to the gas phase in the liquid,
for example aqueous CO2 gas in ocean, and the gas above the liquid,
for example CO2 in the air.
Aqueous CO2 gas reacts in seconds in
water by disassociating into several forms of carbonate ions. These
carbonate ions then react with ionic forms of other molecules which
are also dissolved in ocean water, for example calcium ions.
Calcium
ions (Ca+2) react with a carbonate ions to form calcium carbonate
(limestone, dolomite, CaCO3).
This calcium carbonate precipitates as
a solid and becomes slurry, sedimentation, then stone on the sea
floor. This disassociation chemistry is not determined by Henry's
Law.
Ocean buffering systems such as this calcium chemistry are
removing aqueous CO2 gas from the Henry's Law equilibrium equation.
This calcium buffering chemistry is very important to the
concentration of CO2 in the ocean and atmosphere and is defined by
other laws, but I will only briefly mention it in this article.
A rain droplet falls through air containing CO2 gas.
The CO2 gas
partition ratio between the air and the rain droplet is adjusting in
real time (no significant lag, no equilibrium) to the temperature
differential experienced in the rain droplet and the CO2
concentration in the surrounding air as the droplet falls.
As the
rain droplets fall to earth, in tropical and temperate latitudes
when the droplet temperature exceeds 26ºC, the droplets begin
emitting CO2 gas.
In higher temperate and polar latitudes, when
droplet temperatures are less than 26ºC, the falling drops will be
absorbing CO2 gas from the air as they fall.
Droplets of water nucleate (condense) on particles in the
atmosphere. The types of particles vary widely based on geography.
Salt and other minerals and gases are carried aloft by wind,
currents, convection, storms over ocean.
Oceans are ~70% of earth's
surface. Over land the chemical composition of raindrops is much
more variable; no simple algorithm is possible.
Rain droplet
formation is discussed in detail in Professor Murry Salby's text
Physics of the Atmosphec and Climate, 2012.
The chemical composition of raindrops varies with the amount of rain
falling during a given time period.
Rain (and dew) scrub the air of
particulates and gases, e.g., hydrocarbon gases.
Hydrocarbon, sulfur
and nitric gases are higher concentration in urban areas than over
ocean, and these gases are found in raindrops in those areas, again
obeying Henry's Law K for each gas.
The same is happening for CO2,
methane, argon, and other gases found in air:
each gas has its
Henry's Law solubility K for water...
You have probably noticed that
the air is cleaner after a good rain.
In general, wherever water temperature is below
26ºC, that water is
absorbing CO2 gas in real time, no delay, in proportion to the
temperature difference above 26ºC and in proportion to the area of
water surface which is in contact with air at that temperature.
Anywhere water temperature is above 26ºC it will be emitting CO2 gas
into air.
Rain arriving at ocean surface changes the concentration
of CO2 gas in ocean surface, which will then drive re-equilibration
based on Henry's Law partition ratio in that surface water.
Water droplets in clouds, falling from clouds, and condensing in air
sum to a relatively high surface area compared to the flat 2-D
surface area of the ocean. Approximately 4πr2 verses r2.
Therefore,
taken altogether, the additional sink and source due to raindrops
would appear to be significant relative to other sinks and sources.
But, building an algorithm to calculate the size of this additional
rain sink and source would be as uncertain as predicting the
weather, primarily due to variances driven by water in all its
phases and chaotic conditions.
For example,
in Hawaii near the northern boundary between temperate
zone and tropical zone, rain and clouds are cooler than ocean
surface.
Raindrops have a larger ratio of surface area / volume
ratio than ocean surface.
Cooler raindrops temporarily increase the
aqueous CO2 gas concentration in ocean surface water in Hawaii and
all of the tropics.
But since ocean water in the tropics is usually
warmer than 26 degrees, that additional aqueous CO2 gas will be
rapidly (seconds) emitted to atmosphere as the temperature of the
cooler rainwater rapidly warms to the temperature of the ocean's
massive heat sink.
Thus, raindrops are another large, chaotic CO2
gas flux between sink and source. It would be difficult or
impossible to model with accuracy this chaotic bi-directional CO2
flux between sink and source.
To calculate how much CO2 is in rain, we would need to know,
the
amount of precipitation that is liquid, the surface area of rain
drops, the temperature gradients in the global atmosphere and ocean,
of course Henry's Law for myriad conditions, etc.
Some of the needed
information is measured and estimated. Volume of global
precipitation is calculated by taking the product of the Earth's
surface area and its average annual rainfall.
Total annual volume of
precipitation of water in all phases is about 5.1 × 10¹⁴ m3.
In
other words, fossil fuel CO2 gas emission on the order of 5.5
x 109
metric tons (see below graphic) is being absorbed into a volume of rain
that is on the order of 1014 cubic meters.
Raindrops are a large sink
and source for CO2 gas.
Rain is scrubbing the air of CO2 just as it
scrubs air of other gases and particles. Whether rain is a sink or
source of CO2 depends on temperature in that location.
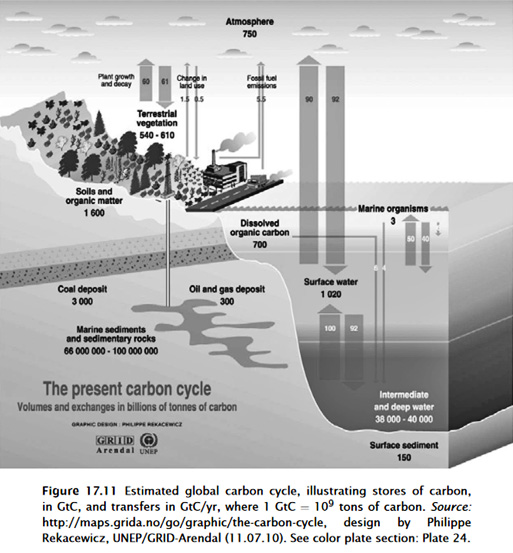
The following below two graphics of carbon cycle, an older graphic
followed by a newer graphic, are routinely provided by UN IPCC and
other proponents of anthropogenic global warming. Notice that rain
is not included in these graphics.
Also the graphics imply that the
different CO2 sources and sinks are not connected. They also clearly
imply that fossil fuel emissions are only emitted and not absorbed.
However, in fact, all of these fluxes into air and into ocean are
connected by
Henry's Law.
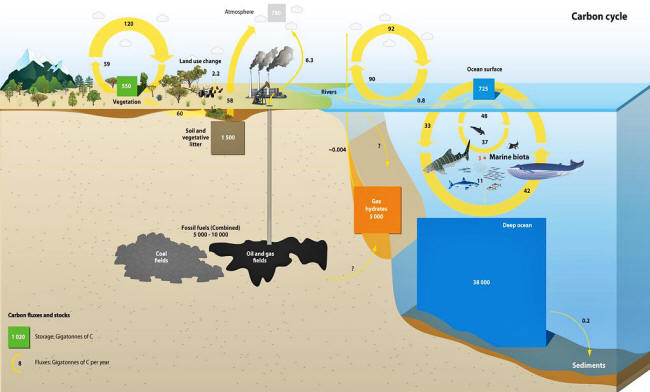
Notice that according to the newer carbon cycle graphic, CO2 gas in
the ocean surface is about 1020 gigatons (1020 x 109 metric tons),
while absorption into ocean surface is about 92 gigatons, while the
estimated fossil fuel CO2 emission into air is 8 gigatons.
The
implication of this graphic is that 8 gigatons of fossil fuel
emission is not mixed with or absorbed by the environment.
The
author/artist and global agencies and governments and
AGW proponents
clearly imply that CO2 emission from fossil fuel is a net addition
of the CO2 to the atmosphere:
this is false...
All of these amounts of
CO2 gas shown in the atmosphere are soluble into an annual volume of
water precipitation of about 5.1 × 10¹⁴ m3! that is annual rainfall.
Simultaneously,
atmospheric CO2 from all sources is being absorbed
into ocean surface and emitted into air, and all of this is
happening in seconds.
CO2 gas concentration in air and ocean is independent of human
emission (Salby).
CO2 concentration in air and ocean is controlled
by the net residual difference of natural emission of CO2 minus net
absorption of CO2 (Salby).
That net residual difference results
primarily from temperature changes in ocean and soil, following
Henry's Law.
Driven dominantly by temperature, all CO2 emissions
from all CO2 sources are compensated by natural adjustment of the
partition ratio of CO2 gas concentration in air versus aqueous CO2
gas concentration in surface water.
This equilibration is occurring
rapidly and continuously.
Human CO2 emission (~5.5 gigatons) into
atmosphere is immediately diluted into an order of magnitude (16
times) larger CO2 sink (90 gigatons of CO2) in the atmosphere.
Then,
atmosphere in contact with ocean results in another order of
magnitude (16 times) dilution into the 92 gigaton sink of CO2 gas in
the surface of the ocean.
The dilution into ocean surface water
begins immediately in seconds as described above.
There is another significant dilution.
As mentioned above, aqueous
CO2 gas in ocean water is continuously diluted and removed from
ocean and from the Henry's Law equilibrium by rapid dissolution into
carbonates joining the multiple, vast inorganic ionic buffering
systems in ocean water. (Mason)(Segalstad.)
"The upper 200 m of ocean water contains enough dissolved calcium to
bind all human produced pogenic CO2 as precipitated calcium
carbonate (in the ocean) without affecting the ocean's pH (Jaworowski
et al., 1992a; Segalstad, 1996; 1998)."
Segalstad, page 818
Note this is only the calcium buffering system, one of several
oceanic buffering systems.
All human CO2 emission could be dissolved
in only the top 200 meters of ocean water by the calcium buffering
system alone (Segalstadt).
The average abundance,
of oxygen, calcium and carbon in earth's crust
is 1456:113:1. (Mason)
In seawater, the Ca2+ ion is 2.9 times more
concentrated than the carbonate (HCO3–) ion (0.4121 g/kg
vs. 0.1424
g/kg) (Stumm & Morgan).
Dissolution into this calcium buffering
system is very fast (seconds.)
This is easily demonstrated by
blowing bubbles through a straw into a water solution containing
calcium hydroxide [Ca(OH)2 i.e. caustic lime] at its oceanic
concentration.
Within seconds, the CO2 in your breath forms white
calcium carbonate solid in the water and precipitates to the bottom
of the container.
The requirements for this precipitation are excess
calcium ions and excess hydroxyl ions (OH– ) ; ocean surface has
both, which is measured by the alkaline pH of ocean water indicating
excess hydroxyl ions.
The same fast precipitation rate occurs in
ocean water.
This process continuously removes aqueous CO2 gas from
the water, converting it to ionic carbonates and then to solid
precipitate stone thus driving continuous absorption of more CO2 gas
into ocean water to maintain Henry's Law partition between ocean and
air.
The ocean calcium buffering system is a gigantic, continuous
CO2 sink. Limestone rock is plating on ocean floor in mid-ocean
depths controlled by temperature and water pressure.
Converting this
solid calcium carbonate (limestone) back into atmospheric CO2 gas
requires volcanic temperatures, a chemistry well known for centuries
by production of cement by burning limestone.
Some "climate science"
literature argues this ocean buffering chemistry operates in time
frames of hundreds to thousands of years.
That is only half true...
The sink (absorption) side of this chemical reaction is ongoing
continuously and happens in seconds.
Only the source side (emission)
of this chemistry, i.e., CO2 emissions from a volcanic eruption is
long term.
"The Law of Mass
Action ensures when all these chemical reactions have been
accounted for in the total net reaction (and when increasing the
amount of a gas, CO2, in the air), calcium carbonate (solid)
will be stabilized in the ocean, because the chemical reaction
will be forced in the direction from left to right.
This result
is the opposite of what is commonly asserted (that solid calcium
carbonate would be dissolved by the increasing amount of CO2 in
the air)."
(Segalstad, page 819)
"The loss of carbon dioxide from the atmosphere by deposition as
carbonate and organic carbon in sedimentary rock was estimated by Rubey as totaling 920
x 1020 g.
More recently, Wickman (1956) has
published some revised figures. He places the amount of carbonate
carbon per square meter of earth's surface as 2420 +/- 560 g and of
organic carbon at 700 +/- 200 g.
Taking the figure of 3100 g/m=cm2
for the total amount of carbon transferred from the atmosphere to
the sedimentary rock, this is equal to a total of 158 x 1020 g of
carbon, or 580 x 1020 g of CO2.
This latter figure is of the same
order of magnitude as Rubey's but considerably lower.
The figures
show clearly that the amount of carbon dioxide deposited in
sedimentary rocks far exceeds the amount in the present atmosphere,
hydrosphere, and biosphere (about 1.5 x 10²⁰), and thus indicate
that large amounts of carbon dioxide must have been released from
magmatic sources throughout geological time to maintain organic
activity.
Wickman's figures show, in addition, that far more carbon
dioxide has been removed as limestone and dolomite than as coal
or other organic carbon."
(Mason, page 209)
|
Dissolved gases in sea water, concentrations ml/l
Oxygen 0-9
Nitrogen 8.4-14.5
Total Carbon dioxide 34-56 [which Mason explained includes
carbonates]
Argon (residual after removal of N) 0.2-0.4
Helium and Neon 1.7 x 10⁻⁴
Hydrogen Sulfide 0-22 or more
(Mason. page 28)
|
All of the above discussed CO2 sinks and sources turn over in months
except the emission of CO2 from limestone rock which in most cases
is permanent removal of CO2 from the environment.
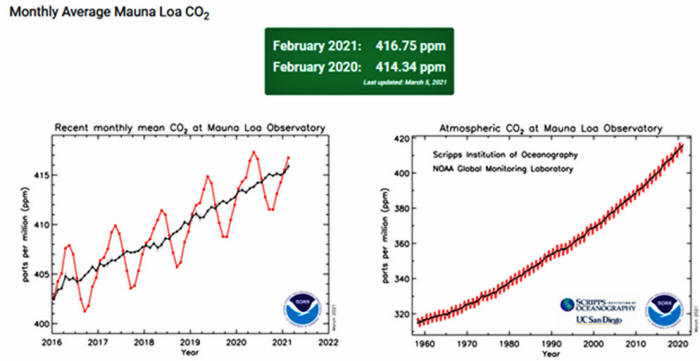
This monthly rate
is inferred from NOAA Mauna Loa data.
The large (two to four times)
differences observed in the within-year rates of change of slope are
stated to be due to seasonal photosynthesis and ice cover
differences between the northern and southern hemispheres.
Within-year changes in slope are +1.5 to +3.5 to -7 to +3.5 and more
and returning to the +1.5 ppmv per year annual slope.
These are the
annual seasonal "sharks teeth" on the NOAA Mauna Loa CO2 slope
(graphic below.).
These rapid within-year changes in slope are
compared to the ongoing annual rate of change of slope (1.5 ppmv per
year) of the net global atmospheric CO2 concentration.
A very, very large rate-compensated drain is inferred from the more
than 2:1 rate differences observed within-year occurring in the
residual of two giant fluxes (CO2 emission and CO2 absorption).
A
small change in net CO2 concentration on the NOAA Mauna Loa slope
represents the residual difference between two enormous (gigaton)
CO2 fluxes in opposite directions.
The temperature and area of the
surface of water act as an adjustable-rate CO2 valve between ocean
and air.
Add more CO2 from any source, and the system adjusts the
rate in both time and volume to achieve Henry's K partition... without
regard to the source of the CO2.
And vice versa...
Henry's law partition is independent of the source of the CO2.
The
net average atmospheric concentration of CO2 (~400 ppmv) is
independent of human CO2 emission.
For example, during the
2020
corona virus 'pandemic', fossil fuel CO2 emissions have been estimated
to have decreased by 20% to 30%.
But the net global average CO2
trend increased for 2020 instead of decreasing, as measured by the
NOAA lab on Mauna Loa and shown in the graphic above.
The net global
average atmospheric concentration of CO2 is independent of human CO2
emission.
The CO2 trend is a function of temperature.
This is
explained in detail including derivation of the equations in the
video lecture at the link in the references below, by Dr.
Murry Salby, Professor of Atmospheric Physics and author of two
graduate school level textbooks on the subject.
On average, rainwater by itself has more than enough surface area to
scrub the atmosphere of all human-produced CO2 within each year.
However, rain is notoriously difficult to predict and absorption and
emission are happening locally.
Regions have dry periods and wet
periods.
But the surface of the ocean is much larger and ever
present and more than sufficient to scrub all human-produced CO2
annually.
As mentioned above, the oceanic buffering systems are
continuously removing aqueous CO2 gas from ocean water and producing
limestone sedimentation.
Ocean has,
"an almost infinite buffering
capacity" for CO2.
Segalstad, page 820. Stumm and Morgan; Segalstad
and Jaworowski, 1991
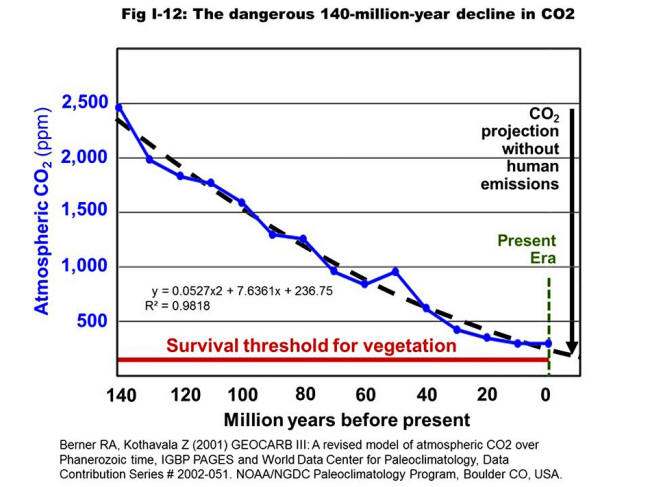
On a time scale of millions of years, atmospheric CO2 has been in a
steady declining trend.
Ocean is absorbing CO2 from air, converting
the CO2 to limestone rock on the walls and floor of the ocean.
There
have been fewer volcanic eruptions and open fissures at volcanic
temperatures which would reverse the chemical reaction equation and
convert the limestone rock back into CO2.
Any and all additional CO2 added to the air from any and all sources
will enter the ocean surface and be balanced in an Henry's Law
equilibrium of approximately 50:1 ratio between water and air at the
specific temperature in that location.
The graphic of net global average CO2 concentration, for example
from the NOAA Keeling Laboratory on Mauna Loa in Hawaii above, is a
graph of an equilibrium equation.
The equation for the line on the
graph is controlled by temperature.
Temperature controls the ratio
of the CO2 in the air versus the aqueous CO2 gas in water.
The line
on the graph is recording the points where the net global flux of
CO2 into the air is in equilibrium with the net global flux into
water in all its liquid forms at a specific temperature.
If
temperature is increasing, then relatively more CO2 is emitted from
water into air.
If temperature is decreasing, then more CO2 is
absorbed into water.
An equilibrium equation which is a function of temperature is
explained in this short video.
Simply substitute CO2 where the
professor has H2O as his example.
In the case of CO2, temperature is
driving the Henry's Law equation for the ratio of CO2 gas in water
versus CO2 gas in air.
Water does not distinguish between human-produced CO2 and
other
sources of CO2.
Contrary to the claims
by proponents of human-caused
global warming, human-produced CO2 does not stay in the atmosphere.
It is absorbed and emitted by water countless times per year based
on the temperature of the surface of water as happens to all other
CO2.
The net global CO2 trend is independent of CO2 absorbed and
emitted by the the biosphere.
The multiyear long term trend (or
slope) in net global average CO2 concentration (NOAA Mauna Loa
graphic above) is the result of slowly increasing surface
temperature since the end of the last ice age.
Ocean surface is about 70% of the surface of the earth.
The ocean is
the lung of all life on earth, breathing out life-giving CO2, and
breathing in life-giving CO2.
Carbon is the fundamental building block molecule for every cell in
all life forms on earth.
All of the carbon in all of your cells was
at one time CO2 in the air.
Carbon is a major component of all
cells.
All of the carbon in every cell of every plant, animal,
insect, fish, bacterium, virus, etc was once CO2 in the air. The
ONLY way that carbon gets into living things is by plants absorbing
CO2 from the air for photosynthesis, and then other living things
eat those plants.
People and plans to reduce atmospheric CO2 are essentially a
eugenics death cult which would, if successful,
reduce
sustainability of life on earth, resulting in less food and
ultimately lower population of all living things.
For example, plans
by billionaires and governments to create
artificial clouds to block
the sun would intentionally cool ocean surface and as explained
above.
As you now know from the discussion above, this catastrophic
plan would remove CO2 plant food from air and starve plants,
crushing food supply for all life:
these are very dangerous geoengineering plans driven by ideology, not science or even common
sense, and if done or seriously attempted most likely humanity will
have sealed its fate in stone.
During my seventy plus year lifetime, all of humanity has been
buried by a non-stop, extremely well funded propaganda campaign
designed to convince people to feel guilty about their carbon
footprint and to fear a never ending list of climate catastrophes,
all caused, they claim or imply,
by human-produced CO2...
It has been
accelerating since the 1960s following the required reading of "The
Population Bomb" and "Ecoscience."
This mistaken ideology is based
on the 18th century mistaken calculations of Thomas Malthus who
believed that,
human population growth would exhaust earth's natural
resources...
Although Malthus' forecasts have never happened,
including the fact that human population growth rate has been
declining for decades, his ideology has been adopted by
the wealthy,
the influential, the UN and over 100 governments, academics and
corporations.
They are driving what is in fact a globally
destructive
eugenics campaign financed by trillions of dollars.
The pace and
intensity of the propaganda campaign will increase as the date
approaches for the next
United Nations IPCC climate conference...
This is a
dangerous, gigantic global fraud.
"Stop treating it
(i.e. AGW... - 'anthropogenic global warming' - human-caused
global warming/climate change) as a worthy opponent.
Do not ascribe
reasonableness to the other side.
It is not reasonable, not true,
not even plausible."
Richard Lindzen, Professor Emeritus, Alfred
P. Sloan Professor of Meteorology, Massachusetts Institute of
Technology.
(31 March 2021. Zoom call Clintel Foundation)
References
-
(Salby)
Lecture by Professor Murry Salby, PhD.
https://youtu.be/b1cGqL9y548
-
(Mason)
Mason, Brian. Principles of Geochemistry. 2rd
Edition. 1958.
https://archive.org/details/principlesofgeoc0000unse/page/212/mode/2up
-
(Segalstad)
Segalstad, Tom. Some thoughts on ocean chemistry (Chapter
6.3.1.2). January, 2014. In book: Climate Change
Reconsidered II – Biological Impacts. Page 818, 819.
https://www.researchgate.net/publication/304797201_Some_thoughts_on_ocean_chemistry_Chapter_6312
-
Carbon
cycle graphics:
https://grid-arendal.maps.arcgis.com/apps/MapJournal/index.html?appid=a49488a79f6644c290f7e01a29f57fc7
-
(Stumm &
Morgan)
Stumm, Werner;
Morgan, James J. aut. Aquatic chemistry : an introd.
emphasizing chemical equilibria in natural waters. 1981.
https://archive.org/details/aquaticchemistry00stum/page/566/mode/2up
-
Segalstad,
T.V. and Jaworowski, Z. 1991. CO2 og globalt klima. Kjemi51:
13–15.
-
"Annual
average global precipitation is approximately 1123 mm (gauge
corrections considered), which is consistent with other
reported values. (Chonka-PTT)" = 5.73 × 10¹⁴ m3
(Legates, David R., Cort J. Willmott.
Mean seasonal and spatial variability in gauge-corrected,
global precipitation. International Journal of
Climatology 10(1990): 111-127.)
-
"Because
Earth's average annual rainfall is about 100 cm (39 inches),
the average time that the water spends in the atmosphere,
between its evaporation from the surface and its return as
precipitation, is about 1/40 of a year, or about nine days."
Encyclopædia Britannica. Encyclopædia Britannica
Online. 2008.
-
"The
average annual precipitation of the entire surface of our
planet is estimated to be about 1050 millimeters per year or
approximately 88 millimeters per month." Pidwirny, M.
Global Distribution of Precipitation. Fundamentals
of Physical Geography, 2nd Edition. 17 April 2008.
|