|

by Cap Allon
October 13,
2020
from
Electroverse Website
According to the Danish Meteorological Institute (DMI)
- who know a thing or two about Greenland - the world's largest
island is currently gaining snow and ice at a level never before
seen in mid-October.
Using the daily output from a weather forecasting model combined
with a model that calculates melt of snow and ice, the DMI calculate
the "surface mass budget" (SMB)
of the ice sheet.
This budget takes into account,
the balance between
snow that is added to the ice sheet and melting snow and glacier
ice that runs off into the ocean totaled over the course of a
year (from September 1 to August 31).
The ice sheet also loses
ice by the breaking off, or "calving"
of icebergs from its edge, but that is not included in this type of
budget.
Calving events
usually occur when an ice sheet is expanding, not shrinking;
furthermore, icebergs breaking off a glacier aren't necessarily
"lost" to the ocean, they continue existing, like some island
extension of the sheet.
SMB charts reveal the growth trend witnessed over the past
few years has continued into 2020, with multiple bouts of all-time
record gains documented throughout the year.
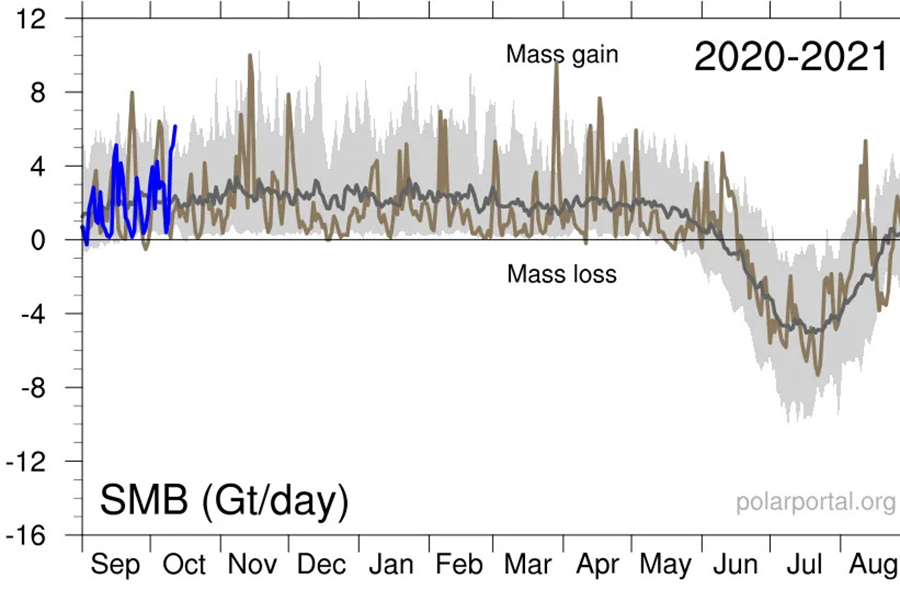
Latest charts reveal the astonishing SMB growth
has continued into October, too:
record daily gains
were registered on both October 11 and 12, with the sheet
gaining a whopping 11Gts (gigatonne)
of snow and ice over the two days - gains never before seen at
this time of year in data going back to 1981:

SMB gains (Gt/day) Greenland
[polarportal.dk]
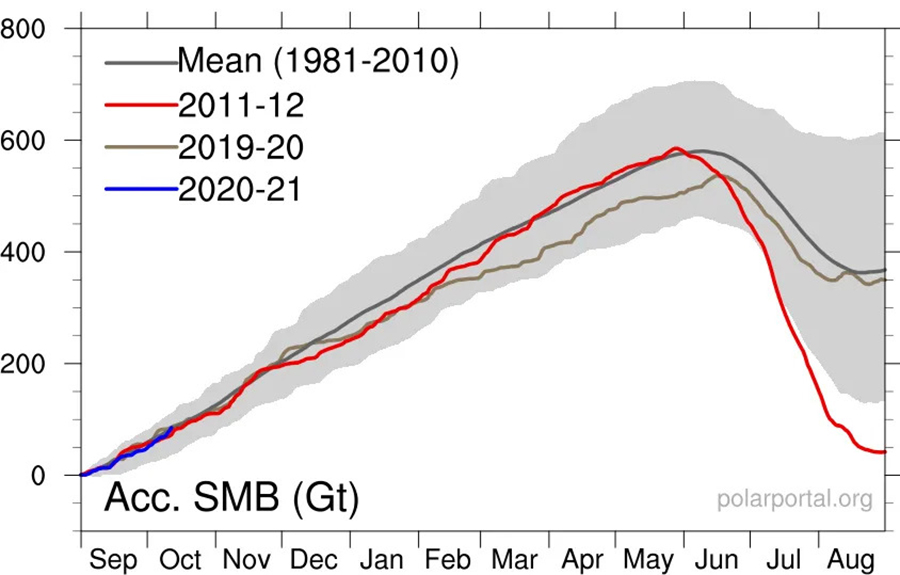
The conditions have nudged this year above the 1981-2010 mean:

Acc. SMB (Gt) Greenland
[polarportal.dk]
And the gains add to the impressive growth trend witnessed since
2016:
2016-17
For the 2016-17 SMB year, the Greenland ice sheet gained 544
billion tonnes of ice (compared to the 1981-2010 average of
368bn tonnes).
The season was the fifth highest in books dating back to 1981
(with the highest being the 619bn tonnes gained in 1995-96:
solar minimum of cycle 22).
Even taking into account calving, the year still wound-up with a
positive Total Mass Budget (TMB).
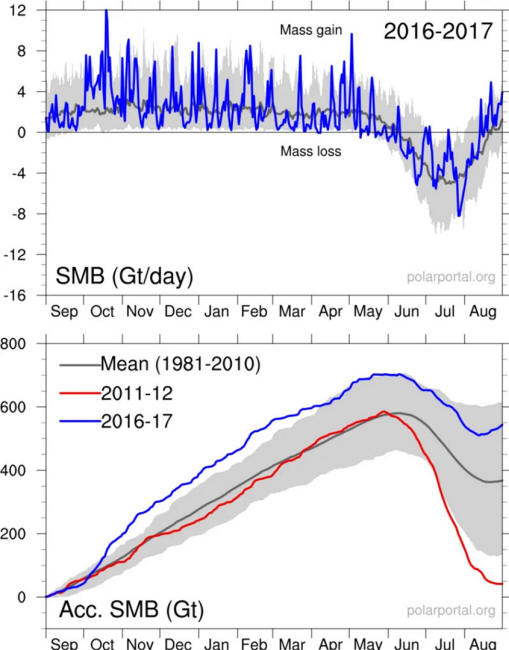
Daily (upper chart) and cumulative (lower)
surface mass budget of the Greenland ice sheet,
in billion tonnes per day, and billion tonnes, respectively.
Blue lines show 2016-17 SMB year.
The grey lines show the 1981-2010 average,
and the red line in lower chart shows the
record low SMB year of 2011-12
[DMI Polar Portal]
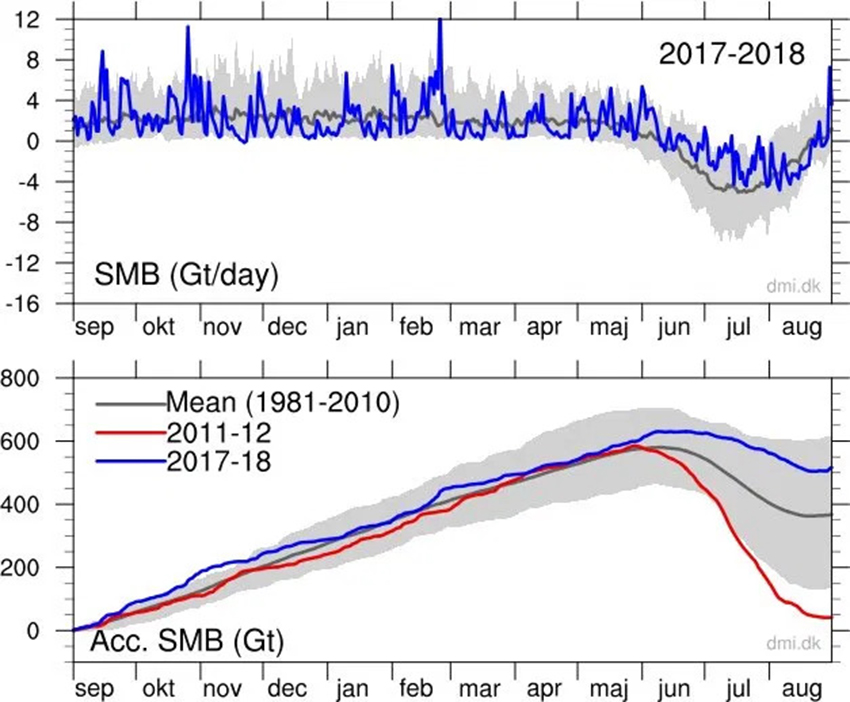
2017-18
For this year, the DMI calculated a total SMB of 517bn tonnes,
which is almost 150bn tonnes above the average for 1981-2010,
ranking just behind the 2016-17 season as sixth highest on
record (by contrast, the lowest SMB in the record was 2011-2012
with just 38bn tonnes).
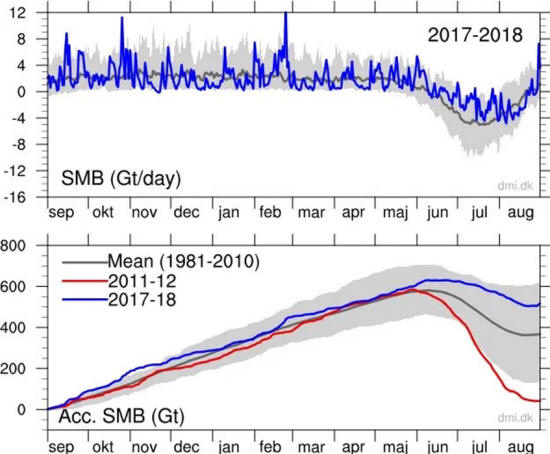
Daily (upper chart) and cumulative (lower)
surface mass budget of the Greenland ice sheet,
in
billion tonnes per day, and billion tonnes, respectively
[DMI
Polar Portal].
2018-19 and 2019-20
DMI estimates that the surface of the ice sheet gained 169bn
tonnes during 2018-19.
Certainly on the low
end, but still within the 1981-2010 average and comfortably
above 2011-12's paltry 38bn tonnes.
The 2019-20 SMB, having recently ended (Aug 31), has reversed
the relatively low gains of 2018-19 with 349bn tonnes added to
the ice sheet, levels very close to the 1981-2010 average of
368bn tonnes.
The DMI described the
year as "normal", and the gains look to have gotten things back
on track to the post 2012 trend of growth.
2020-21
We're barely six weeks into the 2020-21 season but as touched on
above, the SMB has started in record-fashion.
Looking ahead to Aug
31, 2021, gains north of 500bn tonnes - as occurred in 2016-17
and 2017-18 - are certainly a realistic possibility.
The period 2003-2011 saw ice sheet losses on Greenland average 234bn
tonnes each year.
Since then though, the
tide has clearly started turning, the trend is changing:
climate is cyclic,
after all - never linear.
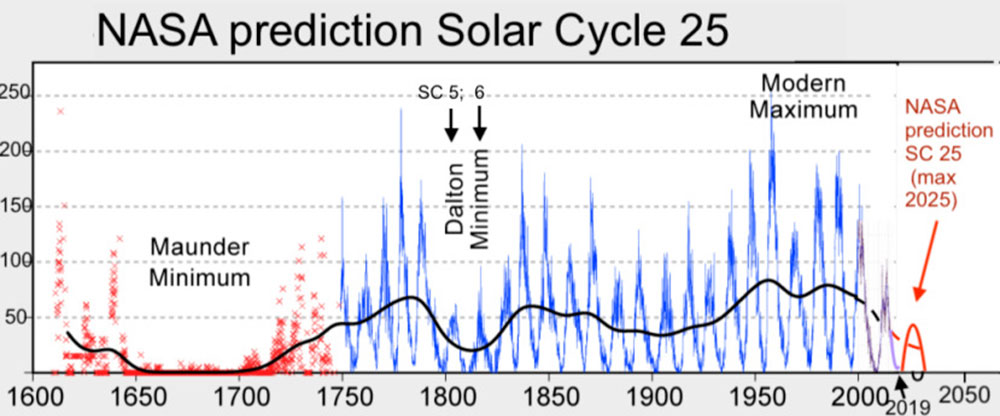
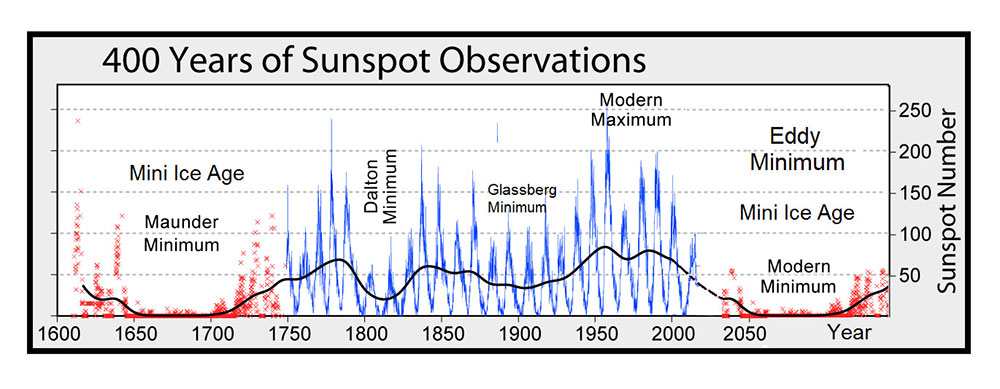
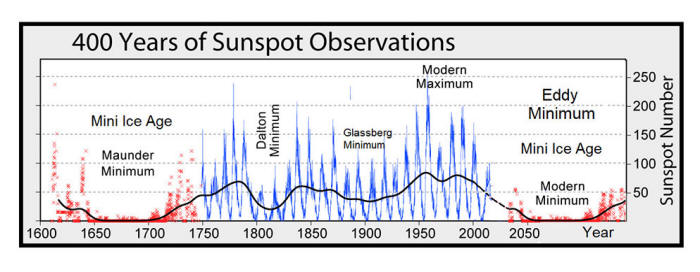
The COLD
TIMES are returning in line with,
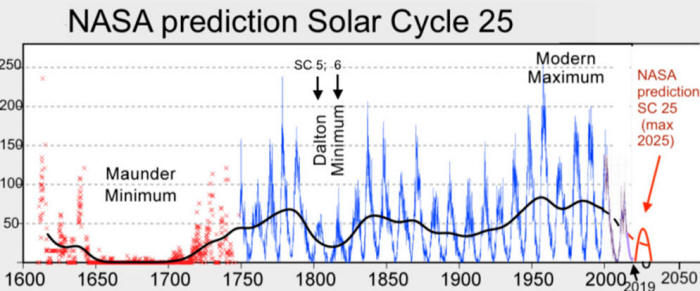
Both NOAA and NASA appear
to agree, if you read between the lines, with their forecast
for this upcoming
solar cycle 25 seeing
it as "the
weakest of the past 200 years," with the agency
correlating previous solar shutdowns to prolonged periods of
global cooling.
Prepare accordingly -
learn the facts, relocate if need be, and grow your own...
|