|
"They say it is observed in the Low Countries (I know not in what
part) that every five and thirty years the same kind and suit of
weather comes about again ... ; they call it Prime... computing
backwards, I have found some concurrence."
- Francis Bacon
10. Why Does It Rain on January 23?
It has been said that the mark of an educated man is his resistance
to new ideas. This characterization is not made disparagingly. The
educated man knows so much that he knows why a new idea won't work.
You'll never hear him say,
"Why don't they try it?" or "Why don't
they do it this way?"
These questions are usually asked by people
who would not ask if they knew more.
But sometimes educated people know too much. I recall a story from
World War I. The German zeppelins were striking terror in the hearts
of the people of London, and the British bullets, instead of
destroying them, were going right through the tough airship skins.
What was needed was a bullet that would ignite on contact with the
balloons, and British scientists applied various explosives to the
bullets to achieve the desired results.
Every attempt produced
failure.
One day an old man came to the war office and said he had the
solution. He told the harried military experts to put a dab of
dynamite on the nose of their bullets. The dynamite, he said, would
ignite the silk covers of the balloons.
Of course, no one paid any attention to him; everyone knew that
dynamite is relatively nonexplosive. It was unthinkable that it
would explode upon contact with silk. But the old man persisted.
Finally, to end their annoyance, one of the experts went with the
old man to his back yard. The test was made. A bullet with dynamite
on it, fired through a piece of silk, did set the fabric on fire.
The answer was simple. Dynamite is nitroglycerine and a filler. In
the process of being fired, the filler fell back and left a few
drops of pure nitroglycerine on the bullet's nose. When this hit the
taut silk it exploded.
The problem was solved - in spite of the educated men at the war
office. In this case they knew too much.
Something of the sort may be happening with regard to using cycle
knowledge as an aid to weather forecasting. Although largely ignored
by many, the possibility of cycles in weather has occupied the
attention of some of the most eminent meteorologists, who have felt
that long-range weather prediction is possible only through an
understanding and application of cycles.
Broadway and the Barometer
Whether you call it atmosphere or just plain air, there are
approximately 5 quadrillion tons of the stuff clinging to our earth.
Here, on the surface, we're at the bottom of the pile and the air
pressure at sea level is about 14.7 pounds per square inch, or one
ton per square foot.
Air pressure is measured by a barometer and recorded as inches of
mercury; 29.91 inches of mercury equals 14.7 pounds per square inch,
and so on, up and down the scale. Usually a falling barometer
indicates that a storm is coming and a rising barometer that good
weather is on the way.
Since 1873 barometric pressure at New York City has moved in a
cyclic pattern that has averaged 7.6 years. The precision with which
this strange cycle has repeated can be seen in Figure 40. The actual
barometric pressure has been smoothed by a three-year moving
average, shown by the solid line.
Significantly, of the twenty-four turning points shown in the chart,
a total of twelve came within half a year of ideal timing and in
only one instance was a turning point more than two years from the
ideal. A Bartels test of significance was performed in order to rate
the behavior of this cycle better.
This test showed that such a
performance could have resulted by chance no more than one time in
forty-eight. Adding to its credibility is the fact that the cycle
continued to perform in the ideal pattern after it was discovered in
1953; in fact, its behavior has been dramatically precise through
1968.
What does it all mean, you may ask. Why do we study repetitive
behavior in barometric pressure at New York City? These are logical
questions. First, there is the most obvious answer - we study it
because it is there. Secondly, such work may be invaluable in future
long-range forecasts. A third reason is that it may be possible that
this cycle found in nature may tend to influence other things in
seemingly unrelated areas.
For example, cycles of this length have been found in other
natural-science series. Douglass and Abbot both reported cycles of
this length in tree-ring growth; Alter and Lane both found similar
lengths as minor cycles in the behavior of sunspots; Abbot
discovered a 7.58-year cycle in solar radiation and one of 7.66
years in the average mean temperature in Berlin. Another
barometric-pressure study was performed by Clayton, who found a
7.54-year cycle at five widely separated weather stations throughout
the world.
Also, cycles of this approximate length have been reported in
pig-iron prices, steel prices, stock prices, sales of a
public-utility company, and revenue freight ton-miles.
Could it be that changes in pressure influence man, and man in turn,
reflects this influence in many ways? Long lists of reactions to a
falling barometer in both animals and humans have been compiled.
Generally the symptoms are restlessness, irritability, an increase
in traffic and industrial accidents, forgetfulness, and
sleeplessness.
One study by two biostatisticians, Digon and Bock, of the
Pennsylvania Department of Health, shows that suicides tend to
increase dramatically whenever barometric pressure changes by 0.35
inches or more, and there was also some indication that a falling
barometer was more dangerous than a rising one. The two scientists
did not offer any possible explanation for the apparent fact that
changes in barometric pressure may trigger acts of self-destructive
violence.
Whether or not there is any cause-and-effect relationship between
the barometric-pressure cycle and any psychological or economic
behavior will require long periods of extensive observations at
various latitudes. But what a fascinating subject for someone to
pursue!
Does barometric pressure at places other than New York City
have a 7.6-year cycle? Is the behavior worldwide? As the amount of
air surrounding our planet is fixed, one would imagine that a
7.6-year cycle in pressure in one part of the world would have to be
offset by an upside-down 7.6-year cycle in some other part of the
world. Is there such an upside-down 7.6-year cycle, and if so,
where? Also, in these other parts of the world do economic affairs
also have an upside-down 7.6-year cycle?
No one knows, but it is
extremely important to find out if we are to understand the rhythmic
forces to which we as human beings are subject.
The Rhythm of the Rain
The weatherman and his public image have shown great progress since
1870 when the U.S. Signal Corps initiated our first national weather
service.
Each evening as we watch our favorite television
prognosticator give his or her odds on rain occurring in the next
five days it is difficult to realize that until the late Henry
Wallace was Secretary of Agriculture (1933-1940) there were no
government forecasts made for more than twenty-four hours into the
future.
Concerned with the obvious effect of weather on crops, Wallace
suggested that the Weather Bureau attempt forty-eight-hour
forecasts. Now, with advanced computers, radar, and the Tiros
satellites monitoring the move of every cloud formation, it is
possible to make fairly accurate general weather predictions almost
two weeks in advance - and when meteorologists accept Einstein's
famous premise that "God does not play dice with the universe" and
recognize that there are rhythmic behavior patterns in climatology,
they may be able to predict weather several years into the future!
Yet many of them continue to work with their heads in the sand - or
the clouds. Show them the following graph (Figure 41), and they will
tell you that the obvious 4.33-year cycle in Philadelphia
precipitation since 1820 is mere coincidence.
This cycle, if real, is a small factor in total precipitation,
probably accounting for only slightly more than a one-inch change in
a year. Yet if the cycle is significant, if it is one of the reasons
for changes in levels of precipitation, then it is another important
clue to helping us unravel our puzzle.
As a further check on our Philadelphia figures the precipitation
figures from nearby New York City and Baltimore were both
investigated. Each produced the same 4.33-year cycle. Of the three
cities the Baltimore cycle is most pronounced (Figure 42). This
cycle could occur by chance only once in 400 times.
Why Does It Rain on January 23?
A heavy rainfall usually descends on Brisbane, Australia, on January
23.
Dr. E.G. Bowen, Chief of the Radiophysics Division of the
Commonwealth Scientific and Industrial Research Organization in
Australia, reported that on certain days, such as January 23, it
rained in Brisbane and that this has occurred so often that it could
hardly be chance.
Later the U.S. Weather Bureau corroborated Dr. Bowen's findings
concerning a recurring pattern of high and low rainfall on the same
calendar days. Dr. Bowen suggested that since certain meteoric
showers recur at regular dates, the entrance of meteoric dust into
the earth's atmosphere may have been the culprit, but there is still
no proof as to the exact cause of this yearly shower.
The 100-Year Cycle
The late Professor Raymond H. Wheeler, while at the University of
Kansas, engaged in an immense project to summarize, in an organized
fashion, all of recorded history.
The compilation of the 2,500 years
of records from which Wheeler derived so many brilliant hypotheses
took 20 years and at one time occupied as many as 200 people. You
will meet him again when we consider the cycles in war.
As Wheeler's work progressed, he noticed a marked correspondence
between the historical record of human events and the weather at the
time the events occurred. Wheeler's chief interest was in the
relation and reaction of man to his environment and, of course,
weather and climate are a major element in our environment.
Professor Wheeler discovered many cycles during the course of his
work but he felt the most important one to be a climate cycle of
about 100 years' duration. To this 100-year cycle of weather change
he tied the record of human events and concluded that the two
factors, weather and human events, were intimately related.
Wheeler's 100-year cycle is divided into four phases (see Figure
43).
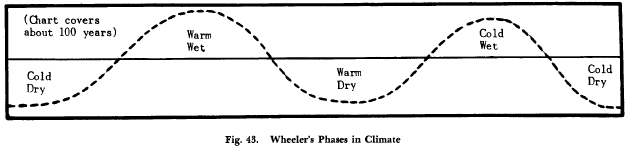
This cycle averages 100 years, although it may run as short as
seventy years and as long as 120 years.
Also, the four phases are
not precisely equal in duration. In general, the cycle has a warm
and a cold phase, with each of these having a wet and a dry period.
These expressions are only intended to describe world conditions in
general and not the weather conditions for specific geographic
locations at specific times.
Wheeler noted that the general character of the climate over a
period of years can be seen in historical cycles. Because people are
certainly affected by the character of the weather, similar events
have occurred throughout history during the same phases of the
100-year climate cycle.
COLD-DRY
The cold-dry period, according to Wheeler, is a time of general
individualism, with weak governments, migrations, and other mob
actions such as race riots.
Class struggles and civil wars ranging
from palace intrigues to revolutions occur during the general
anarchy of the cold-dry period. People are cosmopolitan and
Epicurean, borrowing culture and living by superficial and skeptical
philosophies. (In 1949 Wheeler indicated that we were passing
through a cold-wet period and heading into this ugly cold-dry era.
Draw your own conclusions.)
As this phase nears an end and fades into the next phase, leadership
emerges and societies become stabilized; new governments develop and
nationalistic spirit revives. Wars take the form of expansion and
imperialism.
In the transition from the cold to the warm era, human energies
operate at a high level (just as in the spring of the year).
Learning is revived, genius appears, industrial revolutions occur,
crops are good, and times are prosperous.
WARM-WET
The warm-wet period sees the climax of the trends started in the
previous transition, with achievement becoming organized, and the
emphasis put on cooperation and integration of views and effort
rather than individual accomplishment.
Interest in the state rather
than the individual develops and governments become more rigid and
centralized.
WARM-DRY
As the weather changes from a general warm-wet phase to warm-dry
phase, the rigid governments of the previous period become despotic,
police states emerge and personal freedom declines.
Behavior
patterns are introverted. In art, surrealistic and impressionistic
patterns develop, and in business, aggressiveness and
self-confidence decline with subsequent depressions and the collapse
of economic systems.
During the transition to the next cold period, according to Wheeler,
wars reflect the culmination of the decadence of the previous period
and become the crudest type of struggle with entire populations
slaughtered or enslaved. (This period saw the beginning of World War
II.)
However, as the temperature falls and rainfall increases,
activity increases, crops are again good, and general revival
begins.
COLD-WET
The cold-wet phase sees the reemergence of individualistic
philosophy, with decentralizing trends in government and business.
It is a period of emancipation and natural behavior; art is
straightforward and simple; scholarship follows mechanistic lines.
These trends continue and grow until they reach a climax of general
anarchy during the cold-dry period to follow.
If we are now into the cold-dry period, we can eagerly look forward
to the golden age of the warm-wet period coming up next. And the
sooner the better!
Our Shuddering Earth
Lake Hebgen, twelve miles west of Yellowstone Park, is a favorite
watering hole and resting place for waterfowl and other bird life.
At noon on August 16, 1959, every bird began to leave the area and
by nightfall not a bird was to be seen on the lake. This event was
so unusual that it aroused both local and national scientific
interest. At midnight the first shocks of Yellowstone's frightening
earthquake began just west of the park.
What mysterious force caused the birds to abandon the area twelve
hours before the first earth tremors?
Dr. John Aldrich of the
Department of the Interior searched all available literature on the
subject but failed to find any record of similar behavior in the
past. Although birds are known to be acutely sensitive to changes of
atmospheric pressure, one wonders from what source came the early
warning of impending disaster. How did the birds know that Lake Hebgen soon would not be a safe resting place?
More than a million earthquakes occur annually throughout the world
and are registered on sensitive seismographs with ratings in
intensity from 1 to 10. Earthquakes originate miles beneath the
surface of the earth, splitting tremendous masses of rock along
rupture planes called "faults." They recur in the same well-defined
areas year after year, especially along the Pacific coast, the
western mountain region of the United States, and a large part of
Canada.
That they occur in the same area time after time is common
knowledge. But there is growing evidence that their behavior has a
rhythmic pattern, and increased research and knowledge into possible
earthquake cycles may save the world countless lives and billions of
dollars in property damage.
Dr. Charles Davison, of England, studied records of earthquakes in
the northern hemisphere for the years 1305 to 1899. During this
581-year period there were fifty-three peaks of earthquake abundance
at an average of 10.96 years apart.
Davison found a close association between earthquakes and sunspots,
as you can see in Figure 44.
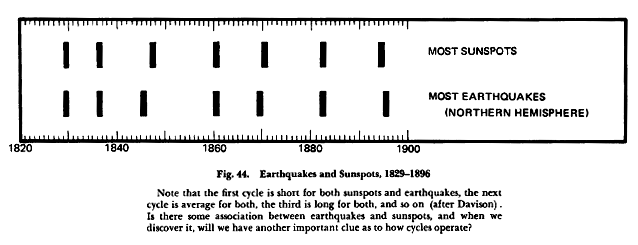
He noted that earthquakes and sunspots both fluctuate in a cycle
about eleven years long and that the ideal time of most quakes is
about the same as the ideal time of most sunspots.
Also, the
irregularities of the eleven-year earthquake cycle seem to be
similar to the irregularities of the eleven-year sunspot cycle.
Perhaps there is some association between earthquakes and sunspots.
What is it? When we discover it, will it throw light on the way
cycles operate and the cause of cycles in other things?
The sun and its fascinating behavior are closely related to our
weather in many ways. We will take a long look at these
meteorological "coincidences" later.
Many other cycles have been discovered in earthquakes. In Japan,
where the earth trembles several times a day, the great seismologist
Omori discovered an increase in numbers every 2.75 years.
Stanford
University's president, following the California earthquake of 1906,
concluded that earthquakes in the Portola rift appeared to have a
thirty-to-forty-year cycle, and a former Weather Bureau
meteorologist, W. C. Clough, working with 1,700 years of data,
alleged the existence of a thirty-seven-year cycle in the behavior
of Chinese earthquakes.
I tested his theory, refined the cycle
length to thirty-five years, and discovered an additional
significant cycle that measured 17.66 years.
Volcanos spew their "fire and brimstone" on land and man with little
warning. Most famous perhaps is Vesuvius, which erupted in A.D. 79
and buried the metropolis of Pompeii under twenty feet of pumice
stone and ash. Vesuvius still belches approximately every thirty
seconds.
Although volcanos are scattered throughout the world, the majority
are in the Pacific Ocean area. Unfortunately, accurate records for
their eruption are available only for this century so that any study
of their cycles is extremely limited.
Yet the volcanologist
Giuseppe Imbo stated that eruptions of Vesuvius occur at intervals
approximately fourteen to seventeen years apart, although he too
claimed that there were not sufficient data to make firm
predictions.
However, T. A. Jaggar, who was one of the world's outstanding
authorities on volcanic activity and lived on the edge of the crater
of the volcano Kilauea in Hawaii, had marked success with his
predictions. In January 1929 he successfully predicted the eruption
of Kilauea.
In 1945 he repeated his forecast, and again Kilauea
erupted. The striking features of the Kilauea pattern, according to Jaggar, were a long cycle of 134 years, another of approximately 33
years, and a minor cycle of approximately 11 years.
The 11-year
cycle, he noted, showed a tendency to correspond to the minimum
period of spots on the sun.
California's Lassen Peak is the most recently active peak in the
conterminous United States and it shows evidence of a
sixty-five-year cycle. A major eruption occurred in the period from
1914 to 1917, and according to the geologist H. A. Harkness, an
earlier eruption took place in the winter of 1850-1851. Other
geologists corroborate his dating and allege that there is good
reason to believe that sixty-five years earlier another outbreak
occurred.
Based on this brief evidence, if the cycle continues, there should
be a very hot year near Lassen Peak around 1980.
The Billion-Dollar Basin
The Great Lakes are the largest inland body of fresh water in the
world, encompassing in a "basin" approximately 295,000 square miles
of land and water.
The five lakes forming this great natural wonder
exhibit the same behavior that one notices in most other phenomena
in nature. Their lake levels go up and down in cycles, creating
havoc with shipping, fishing, beach resorts, and the manufacture of
electric power.
In 1964, when the water level of the Great Lakes had reached its
lowest point in history, a congressional hearing was called and
Senator Philip Hart's opening remarks contained an analogy pertinent
to our inquiry:
"The Basin is the heart of the Midcontinent... in
fact, the heart of the American continent. It is a heart which beats
in direct ratio to the strength and capacity and continued
availability of that water."
Colonel S. W. Pinnell, of the Army Corps of Engineers, testified
during the hearings.
He explained that the water levels in the Great
Lakes depend primarily on such natural processes as precipitation,
runoff, and evaporation. If there is a major variation in these
normal processes, there is a corresponding change in the net amounts
of water supplied to the lakes, and this results in consequent
periods of abnormally high or low water.
The major economic effects of low water level on commerce and power
were also explained. Colonel Pinnell said that a major portion of
commercial shipping on the Great Lakes is affected by the low levels
of Lakes Michigan and Huron. From an analysis of major items of lake
traffic into or out of United States harbors during 1964, when water
levels were about one foot too low, he noted that the loss in
commercial shipping was estimated at about $7 million.
Also,
reductions in power generation occur because when levels are low the
outflow from the lakes is low. During the first half of 1964 the
output of the state generating plant at Niagara was about I14
billion kilowatt-hours less than average.
Colonel Harry A. Musham, of Chicago, has been forecasting future
levels of Lakes Michigan and Huron for many years with considerable
success. In 1941 he predicted that Lake Michigan would reach maximum
levels in 1951 and 1952. It did. In 1943 he predicted that lake
levels would decline in 1963, twenty years later. They did - to a
point that brought about the aforementioned congressional
investigation.
Musham's forecasts, which he arrived at after studying data on the
levels in Lakes Michigan and Huron, are based on a cycle that he
says may be about 22.75 years long. Michigan and Huron have the same
water level, and changes in their levels are generally indicative of
changes in the other Great Lakes.
Musham extends his relationship
beyond the Great Lakes, saying,
"What happens in Lake Michigan is an
index of what is happening, fresh water-wise, throughout the world's
bread basket regions. Like all other landlocked reservoirs, the lake
is fed by rain. Studies show that Great Lakes' peak levels are
always preceded by bountiful worldwide precipitation."
A comprehensive scanning of the data for Lake Huron and Lake
Michigan recently made at the Foundation tends to confirm Musham's
work and suggests a number of cycles in these figures.
The post-1964
upturn in lake levels predicted by these cycles has indeed come
about.
A complete understanding of the cycles in the levels of the Great
Lakes would contribute greatly to the ability of hydrologists to
forecast future lake levels. The saving that would result from this
knowledge when applied to the stabilization of lake levels,
minimizing damage done to shore installations, controlling harbor
depths, and many other areas is incalculable.
Since precipitation is so closely related to lake levels, increased
knowledge could also aid in making more accurate long-range weather
forecasts, with subsequent reductions in agricultural losses. The
importance of knowing in advance the basic climate pattern - wet or
dry, hot or cold - for a large area of the country does not need
stating.
But it does need to be pointed out that the problem of long-range
weather forecasting, even with recent advances in equipment and
techniques, is far from being solved, and the possibility of cycles
being a large part of the solution should not be overlooked.
Back to Contents
|