|

by David Pratt
November 2006
from
ExploringTheosophy
Website
1.
Introduction
According to the reigning ideology in climate science, most of the
slight warming of the earth over the past century is due to
anthropogenic (man-made) emissions of greenhouse gases, and unless
drastic steps are taken to curb these emissions the present century
will see worldwide catastrophes - increased droughts, floods,
storms, hurricanes, agricultural disasters, and disease.
This
alarmist message is constantly repeated by mainstream scientific
publications, environmentalist organizations, and the world media.
The UK’s chief scientist Sir David King has said that global warming
is so serious that Antarctica is likely to be the world’s only
habitable continent by the end of this century!
Although it is frequently claimed that the science behind global
warming is ‘settled’ and that ‘consensus’ prevails, this is far from
the truth.
The earth has been alternately warming and cooling for
billions of years, and many scientists argue that present climate
change is in no way unusual and could be caused mainly by natural
processes. It is true that the late 20th century was warmer than the
earth has been for some 400 years, but 400 years ago a large part of
the earth was in the grip of the Little Ice Age - from which we are
still emerging.
Climate reconstructions for the past thousand years reveal a fairly
coherent picture of major climatic episodes: Medieval Warm Period,
Little Ice Age, and Recent Warming, but the amplitude of the
temperature variations in different reconstructions varies
significantly - a sign that the science is still very uncertain.
A
team of climatologists recently commented:
So what would it mean, if the reconstructions indicate a larger (Esper
et al., 2002; Pollack and Smerdon, 2004; Moberg et al., 2005) or
smaller (Jones et al., 1998; Mann et al., 1999) temperature
amplitude?
We suggest that the former situation, i.e. enhanced
variability during pre-industrial times, would result in a
redistribution of weight towards the role of natural factors in
forcing temperature changes, thereby relatively devaluing the impact
of anthropogenic emissions and affecting future temperature
predictions.
(Esper et al., 2005, p. 2166)
Many researchers believe that about a thousand years ago, during the
Medieval Warm Period, much of the earth was substantially warmer
than today.
The standard view, as championed by the UN’s Intergovernmental Panel
on Climate Change (IPCC), is that greenhouse gases, particularly
carbon dioxide (CO2), are the principal driver of climate change.
Since CO2 alone cannot explain the magnitude of the temperature
increase of about 0.6°C over the last century, a ‘positive water
vapor feedback’ has to be invoked.
However, a host of empirical
observations are leading a growing number of climatologists to
conclude that the sun’s role has been underestimated.
The Little Ice
Age, for example, coincided with a decline in solar activity, and
solar influences have also been linked to the current warming.
Geoscientist Ján Veizer (2005, p. 20) writes:
‘empirical
observations on all time scales point to celestial phenomena as the
principal driver of climate, with greenhouse gases acting only as
potential amplifiers’.
The current fixation on carbon dioxide emissions from fossil fuel
combustion makes little sense; by far the most important greenhouse
gas is water vapor, but its role is often minimized or ignored in
the public discussion.
Moreover, the correlation between temperature
changes and CO2 increases over the past century is poor. Most of the
warming took place in the first half of the last century whereas 80%
of the increase in CO2 didn’t happen until after the Second World
War. From 1940 up to the mid-70s, when the buildup of CO2 was
accelerating, global temperatures actually fell.
This gave rise to
scare stories about ‘global cooling’ and the threat of an imminent
new ice age, which would bring wholesale death and misery to
mankind. And then, as now, humans were identified as the main
culprits: the release of fine particles (carbon and sulphur
aerosols) was identified as the principal cause of the cooling.
The modern global warming hysteria was ignited in 1989.
During a
second consecutive, unusually hot summer, a NASA scientist testified
before Congress that his computer models predicted an average global
temperature rise of 0.45°C between 1988 and 1997 and 8°C by 2050 due
to greenhouse gas buildup. Despite enormous uncertainties in his
simulations, belief in a looming global warming catastrophe soon
became the politically correct view. Just 12 years earlier the
National Science Board had announced that we were heading for a new
ice age!
But fashions in science can change as abruptly as in other
domains of life.
The earth’s climate is an immensely complex, dynamic, nonlinear
system in which small changes in initial conditions can have
disproportionately large effects. Even weather forecasts for the
next day or two are often unreliable. The forecasts made for the
rest of this century based on biased and highly simplified computer
models should be taken with a huge pinch of salt.
The models embody
prevailing assumptions about the dominant role of CO2 in forcing
climate change and the existence of unverified mechanisms for
amplifying its effects. At the same time, they essentially ignore a
link between sun and climate, and are unable to handle the key role
played by clouds.
As more and more variables have been incorporated into the models,
climate forecasts have had to be revised downwards. In the 1980s
climate modelers were predicting temperature rises of 1.5 to 2.0°C
by 2000 - more than five times what most scientists now believe
occurred. So while atmospheric CO2 has increased substantially, the
large temperature increase predicted by the IPCC models has not
occurred. The IPCC’s response is to speculate on what cooling
factors must be offsetting the predicted rise, rather than to
reassess its assumptions.
Despite over $50 billion spent on climate change research over the
last 15 years, humans’ role in the modest warming over the past
century remains highly controversial. Too little is known at present
about the natural internal variability of the climate system and its
various feedback mechanisms to say for certain what effect
additional CO2 is having.
Thousands of independent scientists
disagree with the ‘consensus’ position that CO2 is the dominant
factor, but their views rarely receive a fair hearing in
high-profile science journals and the media. A recent survey found
that 30% of scientists disagreed to some extent that ‘climate change
is mostly the result of anthropogenic causes’, and that less than
10% ‘strongly agreed’ (Murray, 2006).
A Canadian scientist who dared to ask critical questions at a
meeting on global warming was shocked by the virulent reaction:
‘it
was as if I was back in the Middle Ages and had denied the Virgin
Birth’.
Geologist Gerrit van der Lingen (2005) remarks:
The global warming debate has left the realm of science a long time
ago. It has become totally politicized. Any scientific criticism is
not met with a scientific response, but with name-calling and a
stepping up of the scare tactics. Some skeptics have even lost their
jobs or are told to shut up or else. ...
It is clear that the politicizing of climate science has resulted in
an abandoning of good scientific practice and ethics.
While dissident scientists with links to coal or oil companies are
automatically dismissed as biased and untrustworthy, the financial
interests of salaried green activists and government-funded
greenhouse bureaucrats and researchers are ignored.
Palaeoclimatologist Mike Jorgensen (2004) says that although ‘green’
groups such as the Sierra Club, Friends of the Earth, and
WWF, like
to present themselves as non-profit and non-partisan, they are
really neither.
They are just as biased and unscientific in their approach as the
big oil, car, and chemicals companies are. They make money from fear
mongering to collect funds from well meaning, concerned, but
scientifically naive people. ...
Global warming advocacy is big business, hundreds of millions in
research and other funds are available annually for those scientists
and organizations who spout the party line ...
The media tend to uncritically publicize the doctrine of
anthropogenic global warming and make little effort to present a
balanced perspective.
Warming incidents, such as collapsing ice
shelves and record high temperatures, grab the headlines, while
cooling incidents, such as thickening of ice caps, snow in Saudi
Arabia, and record low temperatures, are ignored.
UK Foreign
Secretary Margaret Beckett recently compared climate skeptics to
advocates of Islamic terror, and said that both should be denied
access to the media!
In an article entitled ‘Got a problem? Blame global warming!’, John Brignell presents a list of over 300 phenomena that have been blamed
on human-caused warming. Examples include: allergies, bananas
destroyed, bananas grow, blackbirds stop singing, diarrhea,
extinction of pygmy possums, five million illnesses, glacial
retreat, glacial growth, Maple syrup shortage, outdoor hockey
threatened, rainfall increase, rainfall reduction, societal
collapse, sour grapes, spiders invade Scotland, tree beetle attacks,
wolves eat more moose, and yellow fever.
The
Stern Report (October 2006), which
breaks new ground in climate sensationalism, adds many new items to
the list, such as increased gender inequalities, with men migrating
and women subject to impoverishment, forced marriage, labor
exploitation, trafficking, and natural disasters!
All scientists accept that there has been some degree of overall
planetary warming during the past hundred years, though the exact
value is disputed.
A wide range of factors are at work and,
contrary to the prevailing fad, humans are arguably a long way from
being the most significant.
2. The
ever-changing climate
The climate is in constant flux. Warming and cooling cycles have
succeeded one another throughout the earth’s history, with a
periodicity ranging from tens of millions of years to several years.
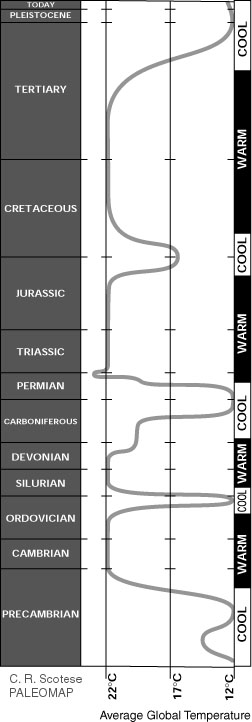
Fig. 2.1
Changes in global climate through time.
(www.scotese.com)
There is evidence that virtually the
entire earth may have been covered with ice sheets twice in the
Precambrian, 700 million and 2.4 billion years ago.
During the
Phanerozoic (the period since the beginning of the Cambrian, 545
million years ago), the earth has passed through eight great climate
cycles. For more than 90% of the earth’s history, conditions were
much warmer than today.
Two million years ago forests extended
nearly to the north pole.
And as recently as 125,000 years ago,
temperatures were so high that hippopotami and other animals now
found only in Africa made their homes in northern Europe.
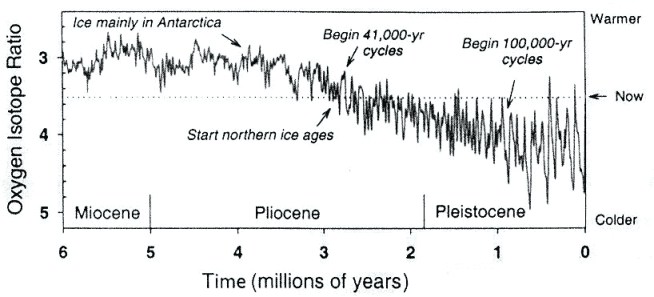
Fig. 2.2
Temperature
curve for the last 6 million years, based on an ocean core. (Carter,
2006)
The past million years have seen 8 to 10
ice ages, each about 100,000 years long, with short, warm
interglacial periods of about 10,000 years.
The difference in
globally averaged temperatures between glacials and interglacials is
about 5°C.
The transition between glacial and interglacial conditions can take
place in less than a thousand years - sometimes in as little as
decades. Such dramatic climatic shifts occurred near the end of the
last major ice age, about 15,000 years ago.
First, a brief warming
occurred, and then the ice age returned for roughly a thousand
years. Finally, by 11,500 years ago, the climate quickly warmed
again. Ice core data indicate that temperatures in central Greenland
rose by 7°C or more in a few decades.
(Marshall Institute, 2006, p.
27)
The present interglacial warm period (known as the Holocene), which
began about 10,000 years ago, has experienced a series of major
temperature swings.
A long-lasting Holocene Warming took place 3500
to 6000 years ago, when the average temperature was 2°C warmer than
today.
This was when forests and herd animals numbering millions thrived
across what today are barren Siberian tundra, the Sahara was green
and traversed by rivers, and the plains of Europe and North America
resembled safari parks.
None of this was due to fossil-fuel power
plants or refrigeration industries operated by the Vikings or
Paleolithic village dwellers.
(Hogan, 2004, p. 241-2)
During the Medieval Warm Period (or Medieval Climatic Optimum), from
about 900 to 1300 AD, the earth was up to 3°C warmer than today.
This made it possible for the Vikings to colonize Greenland and
Newfoundland. The forest boundary in Canada reached 130 km further
north than today, and in Poland, England, and Scotland vineyards
flourished.
The warmer climate brought a flowering of prosperity,
knowledge, and art to Europe.
Agricultural yields increased, marshes
and swamps dried up, removing breeding grounds for mosquitoes that
spread malaria, and wetlands were turned into productive farmland.
In general, civilization has tended to flourish during warm periods,
while cold periods have brought more drought, famine, disease, and
wars.
The Medieval Warm Period was followed by the Little Ice Age, which
lasted intermittently from about 1350 to 1850. The Thames river in
England froze regularly in winter with ice thick enough for fairs to
be held on it, and people were able to travel from Poland to Sweden
across the Baltic Sea on sleighs, staying overnight in taverns built
on the ice. We are still emerging from the Little Ice Age, and this
is an important factor behind the moderate rise in temperature since
the late 19th century.
Based on a detailed analysis of 240 proxy climate studies from all
parts of the world, Soon & Baliunas (2003) concluded that the
Medieval Warm Period and Little Ice Age were probably global in
extent. Neither is explained by changes in atmospheric
concentrations of CO2 and other greenhouse gases, since these
remained relatively constant.
Many researchers contend that a decline
in solar output was a primary factor in triggering and sustaining
the Little Ice Age, and that an increase in solar output may be
responsible for much of the warming in the 20th century (Balling,
2005).
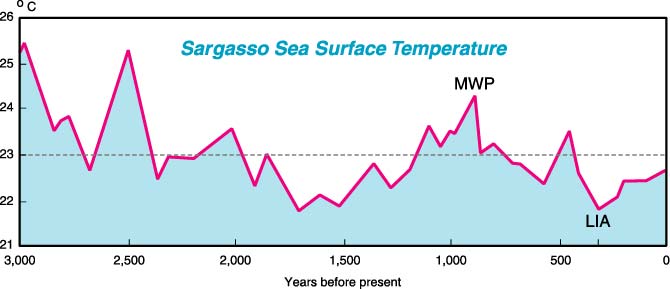
Figure 2.3
Surface
temperature in the Sargasso Sea (Northern Atlantic),
as determined by
isotope ratios of marine organism remains in marine sediment.
The horizontal line
is the average temperature for this 3000-year period.
The Medieval Warm
Period (MWP) and Little Ice Age (LIA) are clearly evident.
(Bluemle, 1999)
Temperature records based on thermometer
readings began only in the mid-19th century.
Temperatures in earlier
times have to be inferred from proxy data (e.g. tree rings and
isotope ratios) and are therefore more uncertain.
The instrumental record shows that the
globally averaged surface temperature remained nearly level from
1856 to about 1910, rose until 1945, declined slightly until about
1975, and then increased again. The overall increase during the 20th
century was 0.45°C according to AccuWeather, 0.5°C according to the
US National Climate Data Center, and 0.6°C according to the IPCC.
The highest warming rates occurred in land areas pole-ward of 30°N,
and minimum (night) temperatures have increased much more than
maximum (day) temperatures. But some parts of the globe (e.g.
northeastern Canada and western Greenland) have cooled considerably
since 1960.
The main natural driver of the climate system is the intensity of
solar radiation reaching the earth, determined by changes in the sun
and shifts in the earth’s orbit and axial tilt.
About a third of the
radiation entering the atmosphere is either reflected or absorbed by
clouds and airborne particles (aerosols). Low-level clouds reflect
solar radiation and have a cooling effect, while some high-level
clouds have a warming effect. Sulfate-based aerosols tend to cool
the earth whereas black carbon (soot) tends to warm it.
Two thirds of the incoming solar energy reaches the earth’s surface
and is either absorbed or reflected depending on the surface
brightness (albedo); snow and ice reflect much of the energy, while
bare soil absorbs it. Some of the energy reaching the surface is
redistributed by atmospheric and oceanic circulations. Greenhouse
gases, such as water vapor, CO2, methane, nitrogen dioxide, ozone,
and chlorofluorocarbons, absorb the energy reradiated by the
surface, warming the atmosphere.
Volcanic eruptions emit both
greenhouse gases and aerosols.
Science still lacks a detailed,
integrated understanding of how solar energy and the various
components of the climate system interact.
3. IPCC
pseudoscience challenged
The Intergovernmental Panel on Climate Change (IPCC) advises the UN
on climate issues.
It published assessment reports in 1990, 1996,
and 2001, and its fourth report will appear in early 2007. Each
report includes a ‘summary for policymakers’, which is an openly
political document heavily influenced by government bureaucrats.
The IPCC is not an impartial body, as most of the lead authors are
enthusiastic proponents of anthropogenic global warming.
Since the mid-1990s it has come under
increasing criticism for its biased and pseudoscientific practices,
and several scientists have resigned (New Zealand Climate Science
Coalition, 2006b). For instance, Chris Landsea, a world authority on
hurricanes, resigned in January 2005, saying that the IPCC process
was ‘motivated by pre-conceived agendas’ and ‘scientifically
unsound’.
The Summary for Policymakers in Climate Change 2001:
The Scientific
Basis states:
The global average surface temperature (the average of near surface
air temperature over land, and sea surface temperature) has
increased since 1861. Over the 20th century the increase has been
0.6 ± 0.2°C. ...
New analyses of proxy data for the Northern Hemisphere indicate that
the increase in temperature in the 20th century is likely to have
been the largest of any century during the past 1,000 years. It is
also likely that, in the Northern Hemisphere, the 1990s was the
warmest decade and 1998 the warmest year. (IPCC)
In the light of new evidence and taking into account the remaining
uncertainties, most of the observed warming over the last 50 years
is likely to have been due to the increase in greenhouse gas
concentrations. (IPCC)
Fig. 3.1
The year by
year (blue curve) and 50 year average (black curve) variations
of the average
surface temperature of the northern hemisphere for the past 1000
years.
The large
uncertainties in more distant times are represented by the grey
region (95% confidence range).
(IPCC, 2001)
In support of its claim that the 1990s
were the warmest decade and 1998 the warmest year for a millennium,
the 2001 IPCC report quoted the work of Mann, Bradley &
Hughes
(1998, 1999; ‘MBH98/99’) and reproduced their now
infamous ‘hockey
stick' graph (see fig. 3.1 above).
The graph shows fairly constant
temperatures for the last millennium followed by a dramatic rise in
the 20th century (the blade of the hockey stick).
The accepted view before that, as
embodied in a graph in the IPCC’s 1990 report (fig. 3.2), was that
the world had undergone a Medieval Warm Period that was warmer than
today.
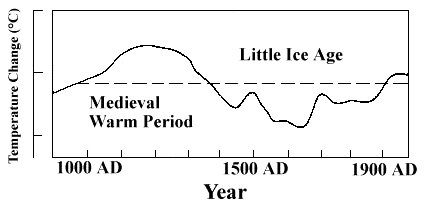
Fig. 3.2
Graph from
the IPCC’s 1990 report.
In the 1990 graph, the current warming
falls within the range of natural historical variation, whereas the
hockey stick graph makes it look anomalous and alarming.
The
existence of the Medieval Warm Period and the Little Ice Age, and
further back the Dark Ages Cold Period and the Roman Warm Period,
had been accepted in textbooks for decades.
But such natural climate
fluctuations are an embarrassment to the hypothesis that mankind is
mainly to blame for the present warming. Indeed, one global warming
zealot, in an unguarded moment, stated:
‘We have to get rid of the
Medieval Warm Period’.
(see Deming, 1995, p. 249)
That is exactly
what Mann’s team did.
Statistical experts Ross McKitrick and Steve McIntyre published a
critique of the hockey stick in the peer-reviewed journal Energy and
Environment in 2003 and further critiques in 2005 (www.climateaudit.org;
McKitrick, 2005).
They criticized MBH98/99 for inappropriate data
selection and incorrect use of statistical methods.
They had great
difficulty getting the necessary information from Michael Mann,
who
put many obstacles in their path. He refused to release his computer
code, saying that,
‘giving them the algorithm would be giving in to
the intimidation tactics that these people are engaged in’ and that
‘if we allowed that sort of thing to stop us from progressing in
science, that would be a very frightening world’!
The MBH temperature reconstruction was based mainly on
bristlecone-pine datasets, even though the IPCC had recommended
against reliance on bristlecone pines because 20th century CO2
fertilization accelerated annual growth, creating a false impression
of exceptional recent warming.
Moreover, their statistical model had
given these datasets 390 times more prominence than the other
datasets they had used.
McKitrick and McIntyre found that MBH’s
statistical methods nearly always produce a hockey stick shaped
graph, even when random numbers are used.
They also discovered that MBH had excluded from their calculations a dataset covering the
later medieval warm period, which had been stored in a computer file
marked ‘Censored-Data’. After correcting these various errors, they
found that the 15th century contained an extensive warm period with
a higher temperature than the late 20th century.
Prior to McIntyre and McKitrick’s work, no palaeo-climatologist had
attempted to replicate MBH98/99. In fact, many climate scientists
derided the very idea!
The fact that the flawed MBH98 paper passed
peer review for Nature magazine speaks volumes. So does the fact
that Nature, along with other leading peer-reviewed scientific
journals, refused to publish McIntyre and McKitrick’s 2003 article
exposing the flawed graph. Only after prolonged pressure did the
editors of Nature publish a correction by MBH, who falsely claimed
that the flaws made no difference to their results.
The IPCC itself never made any attempt to verify the MBH98/99
findings.
This may have something to do with the fact that the lead
author of the chapter that gave prominence to the Mann study was
none other than Michael Mann himself! Some senior climate scientists
have severely criticized the system that allows such conflicts of
interest. But it remains in place for the fourth IPCC assessment
report, due out in February 2007.
As reviewers of the next IPCC report,
McIntyre and McKitrick (2006) write:
we have expressed concerns to the
IPCC about prominent use of graphics and empirical results from
the lead authors’ own freshly published papers, which have not
been in print long enough to have undergone adequate,
independent review and assessment ...
Independent review is also hindered by
the unscientific practice of refusing to disclose datasets and
calculations.
The US House of Representatives’ science committee asked the
National Academy of Sciences (NAS) to evaluate the criticisms of
Mann’s work and assess the larger issue of climate reconstructions.
In its report (July 2006), it accepted virtually all the criticisms
of the hockey stick, and said that Mann’s data and methodology did
not permit him to claim with confidence that 1998 was the warmest
year of the millennium or the 1990s the warmest decade.
But it still
stated that his reconstruction was ‘plausible’ as studies by several
other scientists had also concluded that the 20th century was warmer
than the Medieval Warm Period.
Another analysis of the hockey stick paper was carried out by a
panel of three independent statisticians appointed by the US House
of Representatives’ energy and commerce committee. Its report (July
2006) states that the criticisms made by McKitrick and McIntyre are
‘valid and compelling’.
Referring to the small band of
scientists who dominate the field of climatology, the panel’s
leader, Edward Wegman, says:
[T]here is a tightly knit group of
individuals who passionately believe in their thesis. However,
our perception is that this group has a self-reinforcing
feedback mechanism and, moreover, the work has been sufficiently
politicized that they can hardly reassess their own public
positions without losing credibility.
(Wall Street Journal, 2006)
‘In other words,’ says the Wall
Street Journal, ‘climate research often more closely resembles a
mutual-admiration society than a competitive and open-minded
search for scientific knowledge.’
Regarding the claim that many other
studies support Mann’s conclusions, the panel points out that the
scientists concerned often work with Mann, and tend to use the same
datasets.
McIntyre and McKitrick (2006) comment:
We’ve attempted to replicate these
other studies as well, only to run into one obstacle after
another in identifying data and methods - similar to the
problems that led to the original congressional questions about
the Mann study. In one case, the authors even refused to
identify the sites from which data was collected for their
study!
Despite these pointless obstacles, we know enough about the
‘other studies’ to be confident that none of them meets the
methodological standards now recommended by the panel. In fact,
somewhat remarkably, two of the most recent studies even
continue to use Mann’s discredited principal components series
[bristlecone pines].
The hockey stick graph was featured six
times in the IPCC’s 2001 report, and has been a key weapon in the
campaign to convince the public and politicians of the dangers of
human-caused warming.
Although the graph has been convincingly
discredited, the IPCC has not issued an apology or correction and
continues to use it in its publications. The Canadian government
circulated a copy of the graph to every household in the country,
but it too has not circulated any correction.
The other main graph that the IPCC presented in its 2001 report to
support its claims about anthropogenic global warming is shown in
fig. 3.3. It is based on an analysis of world temperatures by main
author Phil Jones, from the Climatic Research Unit (CRU) of the
University of East Anglia in the UK.
Some independent scientists asked Jones
for his basic data, but he replied that he had invested 25 years in
his work and wasn’t going to turn it over to people who would try to
find something wrong with it!
Fig. 3.3
Variations
of the earth’s surface temperature for the period 1860 to 2000.
The temperature is
shown year by year (red bars) and approximately decade by decade
(black line).
(IPCC, 2001)
The graph has come under strong
criticism, because some of the data are of dubious quality,
especially those from third world countries, and because most of
them come from land-based stations that are mostly located in or
close to urban centers and are therefore distorted by purely local
warmth from urban heat islands.
The ‘urban heat island effect’
refers to the fact that the temperature of large cities with lots of
asphalt and concrete can be as much as 5°C above normal.
Independent scientists have found that there is no systematic
compensation for urban warming in the Jones dataset.
Warwick Hughes
says that there is,
‘no doubt that the CRU temperature graphs are
contaminated with pervasive and substantial urban heat which has
nothing to do with greenhouse gases’.
De Freitas (2003, p. 8)
states:
‘Where warming occurs, it results from a rise in the minimum
temperature, rather than the maximum, and in cold climates, in
winter, and at night - which is what one would expect from so-called
“urbanisation” effects.’
Even the IPCC (2001) admits that the urban
heat island effect could account for up to 0.12°C of the temperature
rise during the 20th century, or one fifth of the total observed.
A major problem in determining the average near-surface air
temperature record for different periods is that substantial parts
of the globe lack the necessary measurements.
Ocean areas off major shipping lanes, ice-covered areas, many arid
and hyper-arid areas, and mountainous areas often lack the
temperature records necessary to generate the monthly temperature
anomalies for individual grid cells.
And not surprisingly, the area
of the earth without valid data increases further back in time and
also during periods of global strife. Less than 30 percent of the
planet had temperature records at various times in the twentieth
century, and today, fully 20 percent of the earth is not covered by
the Jones database....
[T]he longest, most reliable records tend to originate in land areas
of the Northern Hemisphere, particularly North America, Europe and
the former Soviet Union.
These areas should show enhanced warming
under a changing greenhouse, so the fact that the observed
greenhouse-only warming is still beneath the average global
projections for the models remains somewhat troubling to the glib
consensus of model rectitude.
(Balling, 2005, p. 54-5)
Fig. 3.4
The
thermometer record of surface temperature in the continental United
States
shows no appreciable
warming since about 1940. (Hansen et al., 2001)
Balling (2005) identifies various other
problems which introduce warming biases into the temperature record
- e.g. the switch from traditional mercury-in-glass thermometers to
electronic thermistors, the deteriorating reflectivity of the
white-painted shelters in which equipment is housed, and
time-of-observation biases.
Furthermore, nearly all
temperature-measuring stations are land-based, whereas 71% of the
earth (and 90% of the southern hemisphere) is covered with water.
Far too few temperature-sensing buoys are deployed at sea to give an
even remotely accurate assessment of the atmospheric temperature
trends in these vast areas.
Many marine ‘surface’ temperatures are measurements of water, not
the air adjacent to its surface... Indeed, many decades ago,
mariners would measure sea-surface temperature after pulling canvas
or wooden buckets onto the deck and inserting a glass thermometer
into the captured sea water.
Later, mechanical injection systems for
cooling water were used to measure sea-surface temperature,
introducing an obvious warm bias from the ship itself.
(Balling,
2005, p. 58)
Balling concludes that while the upward temperature trend over the
past century is probably real,
‘the general error is most likely in
the positive direction, with a maximum possible (though unlikely)
value of 0.3°C’.
(p. 59)
The same climate models that predict warming near the earth’s
surface from CO2 emissions predict even more warming above the
surface.
However, measurements with weather balloons (radiosondes)
since 1958 and with satellites (microwave sounding units, or MSUs)
since 1979 show that the lower troposphere is not warming at a rate
consistent with the models.
The IPCC’s 2001 report conceded that the
discrepancies were ‘not fully resolved’.
But Christy (2005, p. 73)
asks:
Why ... was a full page of the brief
‘Summary for Policymakers’ devoted to surface temperature charts
that depict considerable warming with another half-page of
supporting text, while changes in the full bulk temperature of
the atmosphere - far more important for the physics of the
greenhouse effect - garnered but seven sentences?
Various ‘adjustments’ and ‘corrections’
have been made to the satellite and balloon data, on the assumption
that they ought to match the surface temperature records; this
contrasts with the lack of effort to correct surface records for
urban bias.
But significant discrepancies between the two
temperature trends remain, especially if account is taken of the
enhanced influence of volcanoes and El Niño events in the lower
troposphere.
Gray (2006) writes:
If a temperature sequence
comparatively free from these influences (1979-1997) is chosen,
there is no detectable warming in the lower atmosphere for six
of the seven records, and for the seventh, no warming between
1988 and 1997, whereas warming still prevails on the surface
over these periods.
The supposed enhanced greenhouse effect is
thus currently undetectable in the lower atmosphere, where it is
supposed to be the most prominent, so the warming on the surface
must have some other cause.
Fig. 3.5
Surface and satellite measurements compared.
(www.envirotruth.org)
In other words, once the perturbing
effects of volcanic eruptions and El Niño oscillations are removed,
the tropospheric data show no significant temperature trend since
1970.
As Balling (2005, p. 68) states:
‘Warming near the surface with
little or no warming in the lower to mid-troposphere is not a
clear greenhouse signal!’
4. CO2
fixation, Kyoto and beyond
When first drafted, the Summary for Policymakers in the IPCC’s 2001
report stated:
‘there has been a discernible human influence on
global climate’.
Government-appointed scientists then changed this
to:
‘it is likely that increasing
concentrations of anthropogenic greenhouse gases have
contributed substantially to the observed warming over the last
50 years’.
In the final version the language was
further toughened up:
‘most of the observed warming over
the last 50 years is likely to have been due to the increase in
greenhouse gas concentrations’.
A UN spokesman admitted:
‘There was no new science, but the
scientists wanted to present a clear and strong message to
policymakers.’
Greenhouse gases absorb some of the
solar radiation reflected from the earth’s surface, thereby warming
the atmosphere. Without this ‘greenhouse effect’, average
near-surface air temperature would be -18°C, rather than +15°C, as
it is now; in other words, there would be permanent ice at the
equator.
CO2 is generally reckoned to account for 4.2 to 8.4% of the
greenhouse effect, whereas water accounts for about 90% - some 70%
is due to water vapor and 20% to clouds (droplets) (Milloy, 2006a).
Over 99.9% of the earth’s atmosphere consists of nitrogen, oxygen,
and argon. Whereas CO2 makes up about 95% of the atmospheres of
Venus and Mars, it currently accounts for only about 0.038% of the
earth’s atmosphere (i.e. 380 parts per million), compared with a
pre-industrial revolution figure of about 0.028%.
Water in its
various forms ranges from 0 to 4% of the atmosphere and its
properties vary according to what form it is in and the altitude at
which it is found.
Humans are responsible for about 3.4% of
the CO2 emitted to the atmosphere annually, mostly from
the burning of coal, oil, and natural gas, and the production of
cement; the rest comes from natural sources such as volcanoes, the
out-gassing of the oceans, and the biosphere.
Humans are probably
responsible for about 2.5% of the total greenhouse effect (Milloy,
2006a).
The warming effect of CO2 is roughly logarithmic, meaning
that the next 100-ppm increase adds only half as much heat as the
previous 100-ppm increase. This is because, whereas water vapor
absorbs heat across the whole infrared range, heat absorption by CO2
is confined to two narrow bands, and as CO2 levels rise, more and
more of the long-wave radiation that can be absorbed at those
frequencies has already been absorbed.
The New Zealand Climate Science
Coalition (2006a, p. 8) writes:
CO2 concentration in the
atmosphere is near saturation in terms of its ability to trap
more heat. This means the effects of adding more CO2 into the
atmosphere are likely to be insignificant.
For significant global warming to occur, increased
concentrations of CO2 must set in motion positive (or
destabilizing) feedback processes. Such processes would cause
temperatures to rise by some other mechanism (such as increased
absorption of solar energy) or cause increases in the
concentration of other greenhouse gases, the most important of
which is, by far, water vapor.
Yet to date, scientific evidence suggests that negative (or
stabilizing) feedback processes prevail. This means that it is
unlikely that higher concentrations of CO2 in the
atmosphere will greatly influence the climate.
Most standard computer simulations
assume that CO2 concentrations are increasing at 1% per
year - compared to a measured rate of about 0.45%.
This makes the
doubling time for CO2 just under 70 years, compared to
the empirical estimate of 120 years. Even when other greenhouse
gases are factored in, the rate of increase is only 0.6%.
The figure of 1% is used for simplicity
and convenience, though the IPCC, which uses a figure of 0.85%,
admits that this is ‘arbitrary’ and ‘on the high side’ (Lomborg,
2001, p. 278-80). The models therefore run far too fast. They also
invoke positive feedback loops involving increased atmospheric water
vapor and neglect negative feedback loops such as the generation of
additional low cloud cover.
The IPCC (2001) predicts that a doubling of CO2 would
lead to a temperature increase of 1.5 to 4.5°C. Other researchers
believe that a more realistic figure is less than 1°C. For instance,
Soon et al. (2001, p. 5) say that analysis of the climatic response
to volcanic eruptions suggests that a doubling of CO2 would lead to
a temperature increase of only 0.3°C to 0.5°C.
Posmentier & Soon (2005) point out that
there are currently no reliable predictions for the response of
clouds to increased atmospheric CO2, and say that a 4%
increase in the area of stratus clouds over the globe could
compensate for the warming produced by a doubled atmospheric CO2
concentration. Our grasp of the carbon cycle and the conversion
processes that CO2 engages in is highly tenuous.
A key factor is the
residence time of carbon in the atmosphere, but this is uncertain.
It is commonly said to be over 100 years, but Rudesill (2006a)
argues that this is more than ten times too high.
It is instructive that the models used in the IPCC’s 1990 report and
into the 1990s predicted far too much warming from CO2
and other greenhouse gases. The temperature predicted for 2000 was
almost half a degree higher than observed.
The IPCC assumes that
sulphate aerosols and the depletion of atmospheric ozone are
partially counteracting the warming caused by increases in
greenhouse gases. It has also been argued that the oceans hold the
‘missing’ global atmospheric warming predicted by climate models.
But the strong oscillations in ocean temperature do not match
variations in atmospheric CO2 content. Stevenson (2000) argues that
ocean warming occurs in 100-year cycles, independent of human
influences. It seems very likely that climate models are
overestimating the warming caused by increasing CO2 concentrations
and underestimating the associated compensatory feedbacks.
There is no linear relationship between changes in atmospheric CO2
levels and the global mean temperature. At the end of the 19th
century the amount of CO2 discharged into the atmosphere by world
industry was 13 times smaller than now, but the climate at that time
had warmed up, as a result of natural causes, emerging from the
500-year-long Little Ice Age.
During the 20th century, atmospheric
concentrations of CO2 and other greenhouse gases rose steadily, but
average surface temperature rose over much of the globe between 1910
and 1940, fell between 1940 and 1975 despite a more than threefold
increase in CO2 emissions, and has been rising since.
The idea of
CO2 increases causing temperature increases was abandoned in the
1940s precisely because global temperatures had not even remotely
matched the 1°C predicted by the theory.
Overpeck et al. (1997) found that the Arctic warmed by 1.5°C between
1840 and 1955, during which time the air’s CO2 concentration rose by
28 ppm, whereas between 1955 and 1990 the arctic air temperature
declined by 0.4°C even though the CO2 concentration rose by 41 ppm.
Polyakov et al. (2003) found that from 1875 to 2000 the surface air
temperature of the region pole-ward of 62°N hardly rose at all, but
then suddenly climbed 1.7°C in just 20 years, even though the
atmosphere’s CO2 concentration rose by a mere 8 ppm.
Over the next
six decades the CO2 concentration rose by about 55 ppm, but the
region in question experienced no net warming and may have cooled
slightly. This clearly indicates that CO2 is not the main driver of
climate change.
The atmospheric concentration of CO2 reached a low of about 180 ppm
during several periods of glaciation over past 400,000 years, but
rose to 300 ppm or more during interglacials. According to Fischer
et al. (1999), ice core records show that at the end of each of the
last three major ice ages, atmospheric temperatures rose 400 to 1000
years before CO2 levels increased.
During the penultimate warm
period, there was also a 15,000-year time interval when distinct
cooling took place without any change in atmospheric CO2, and when
the air’s CO2 content gradually dropped over the next 20,000 years,
air temperatures either rose or remained fairly constant. We also
know that, today, the global mean atmospheric concentration of CO2
lags behind changes in tropical sea surface (and hence atmospheric)
temperature by six to eight months.
This is because as the ocean
warms, it is unable to hold as much CO2 in solution and releases it
into the atmosphere.
In more ancient times, CO2 concentration in the air is generally
thought to have been far higher than today, without having a
dramatic impact on temperature. In the Ordovician (440 million years
ago), the concentration was 18 times higher, but glaciers existed on
the continents of both hemispheres.
In the Eocene (50 million years
ago) it was six times larger than today but the temperature was only
1.5°C higher.
There have been geological times of global cooling
with rising CO2, e.g. during the mid-Miocene (about 12.5 to 14
million years ago), and times of global warming with low levels of
atmospheric CO2, e.g. during the Miocene Climate Optimum (about 14.5
to 17 million years ago).
Fig. 4.1
Global temperature and atmospheric CO2 over geologic time.
Late Carboniferous to Early Permian time (315 to 270 million years
ago)
is the only period in the last 600 million years when both
atmospheric CO2 and temperatures were as low as they are today.
(www.geocraft.com)
Although CO2 is commonly
labeled a pollutant, increases in
atmospheric CO2 during the 20th century have significantly increased
plant growth rates.
Hundreds of experiments with plants growing in
an atmosphere with double the present level of CO2 have shown
productivity increases of between 20 and 50%.
Soon et al. (2001, p.
37-38) state:
The impacts of enhanced plant growth and related soil changes may
even provide a strong quenching effect on warming from carbon
dioxide. The vegetation feedbacks as a result of carbon dioxide
fertilization have yet to be correctly incorporated in the climate
simulations.
The IPCC’s second report, which gave the impression that the science
was settled and humans were known to be significantly interfering
with an otherwise stable climate, led to the adoption of the Kyoto
Protocol in 1997, which calls for substantial reductions in
greenhouse gas emissions by industrialized nations, especially CO2
from fuel burning.
The US and Australia have not ratified the
Protocol, nor does it cover China, India, or developing countries.
Most of the signatories are finding it difficult if not impossible
to meet their targets by the deadline of 2012.
Kyoto is a flop. The IPCC’s own projections indicate that, if fully
implemented, the Protocol will make the world only 0.15°C cooler in
2100 than it would otherwise be; in other words, the temperature in
2100 will be what it would otherwise have been six years earlier.
And sea level will rise 2.5 cm less by 2100 than it would otherwise
do.
Yet implementing Kyoto is estimated to cost 150 billion dollars
a year! In other words, the agreement imposes crippling costs for no
discernible environmental benefits.
Bjørn Lomborg, a statistician, environmentalist, and former
Greenpeace member, accepts that man-made greenhouse gases contribute
to global warming, but argues that since the Kyoto Protocol will
have negligible effects on climate change, the exorbitant cost of
implementing it represents a colossal waste of resources.
The money
could be much better spent in providing health, education, clean
water, and sanitation to the third world; UNICEF estimates that this
could be done for just $70-80 billion a year.
In his book
The Skeptical Environmentalist (2001), Lomborg exposes
the fear-mongering tactics indulged in by many ‘environmentalists’.
He concludes that,
‘global warming is not anywhere near the most
important problem facing the world’ (p. 323), and that ‘it will be
far more expensive to cut CO2 emissions radically than to pay the
costs of adaptation to increased temperatures’ (p. 318).
In response
he has been subjected to vilification; he has been called the
‘Antichrist’ and the IPCC chairman compared him to Adolf Hitler.
The Stern Review on the Economics of Climate Change (October 2006)
takes climate scaremongering to dizzying new heights. It was
compiled by a team headed by former World Bank chief economist
Nicholas Stern at the request of Britain’s Blair government.
It
argues that,
‘if we don’t act, the overall costs and risk of climate
change will be equivalent to losing at least 5% of global GDP [gross
domestic product] each year, now and forever’.
In the worst-case
scenario, ‘the estimates of damage could rise to 20% of GDP or
more’, causing ‘major disruption to economic and social activity, on
a scale similar to those associated with the great wars and the
economic depression of the first half of the 20th century’.
In
contrast, stabilizing greenhouse gas emissions at no more than 550
parts per million (ppm) would ‘avoid the worst impacts of climate
change’, and the cost would be ‘limited to around 1% of global GDP
each year’.
Stern’s message is that either we spend $450 billion per
year now, or we’ll end up paying up to $9.6 trillion per year later.
Many scientists and economists have expressed concern at the poor
quality of the
Stern Report
(CSPP, 2006).
Economist Richard Tol
calls it ‘alarmist and incompetent’, and points out that it
selectively quotes only the most pessimistic studies on the impacts
of climate change. Stern’s doomsday visions are based on the use of
an artificially low discount rate to assess whether it makes sense
to spend money now to reap a hypothetical payoff in many decades’
time.
Stern never states what discount rate he is using, but it
appears to be less than half the figure of 5 to 6% recommended by
the UK Treasury. Also, the social cost of CO2 is generally put at
$2.5 per ton, but Stern uses a figure of $85 per ton. Stern actually
developed a whole new computer model - the forecasts made by
existing models were apparently not apocalyptic enough!
Stern claims that stabilizing greenhouse gas emissions at 550 ppm
(CO2 equivalent) - compared to the current level of 420 ppm
- would
cost 1% of GDP. But this is contradicted by the IPCC. In its
upcoming report it says that the cost would be up to 5% of GDP.
Incredibly, nowhere does Stern say what the effect of such measures
would be on temperature.
It turns out that, according to
conventional climate science, they would reduce the rise in
temperature from 2.53°C to just 2.42°C.
‘One can understand the
reluctance of the Stern review to advertise such a puny effect,’
says Lomborg
(CSPP, 2006, p. 19).
This means that on top of the 1 to
5% of GDP spent on curbing emissions, it would still be necessary to
spend money on adapting to higher temperatures.
Moreover, it is
naive to think that all the countries of the world, including China
and India, would flawlessly implement Stern’s multitrillion dollar,
century-long policy proposal. Nor is there any good reason for them
to do so given that orthodox climate science has probably vastly
overrated the role of greenhouse gases and vastly underrated the
role of the sun.
As Balling (2005, p. 69) says:
‘This era should be a time of
scientific assessment, not a time of impulsive policy actions
targeted at a problem that may not even be a problem, and will not
be significantly impacted by those very policy actions.’
5. Sun and climate
The dominant factor driving the earth’s climate system is the energy
reaching the planet from the sun.
This is determined partly by the
amount of energy emitted by the sun and partly by changes in the
earth’s orbital geometry: the Milankovitch theory takes account of
the 90-100,000-year eccentricity cycle, the 22,000-year
climatic-precession cycle, and a 41,000-year axial-tilt cycle, which
are believed to play a key role in triggering the onset and
termination of ice ages.
There is still much to be learned about the impact on climate of the
magnetic sunspot cycle (divided into two half-cycles of about 11
years each), which is modulated by the approx. 90-year Gleissberg
cycle and 210-year DeVries-Suess cycle. The most important solar
cycles are related to the sun’s irregular oscillation about the
centre of mass of the solar system (Landscheidt, 1998).
There is abundant evidence that throughout the Holocene the earth
has alternately warmed and cooled at 1500 ± 500-year intervals.
Braun et al. suggested that these climate shifts might be linked to
a combination of the DeVries-Suess and Gleissberg cycles (Idso et
al., 2006). In a study of the 1500-year climatic cycle on the basis
of solar-related cosmogenic nuclide variations, Bond et al. (2001)
found that ‘over the last 12,000 years virtually every centennial
time-scale increase in drift ice documented in our North Atlantic
records was tied to a solar minimum’, and concluded that the climate
effects were probably felt worldwide.
Other researchers have found evidence of these global, solar-induced
climate oscillations going back over a million years (Idso, 2001).
The Medieval Warm Period and Little Ice Age appear to be the latest
examples, with the global warming of the past century being
essentially a solar-mediated recovery from the Little Ice Age.
The
mini ice age from 1420 to 1570 coincided with a prolonged lull in
the sun’s activity, and the Maunder Minimum from 1645 to 1715 was an
exceptionally cool period when the sun had very few spots.
Fig. 5.1
Global temperature and solar activity compared.
(www.john-daly.com)
Observations of the surface magnetism of solar-type stars show that
their irradiance varies by up to 0.6%.
Our own sun’s total radiation
output currently varies by about 0.1%, which is generally considered
too small to have a significant impact on climate. However, the
solar wind (a continuous flow of energetic charged particles
released by the sun) and possible terrestrial amplification
mechanisms also need to be taken into account.
A growing number of
scientists are becoming convinced that the sun/climate link is much
stronger than so far recognized by the IPCC.
There are various pathways by which solar activity could influence
the climate. One suggestion is that solar-induced changes high in
the stratosphere are propagated downward through the atmosphere and
trigger an amplified response in deep ocean circulations.
Another
theory highlights the strong correlation between solar activity,
cosmic rays, and low-altitude cloud cover (Svensmark & Friis-Christensen,
1997; Marsh & Svensmark, 2000; Usoskin et al., 2004; Shaviv, 2005).
It proposes that cosmic rays (high-speed atomic particles
originating in exploded stars) ionize air molecules, transforming
them into condensation nuclei for cloud formation.
Greater sunspot
activity results in a stronger solar wind and more powerful magnetic
fields, which divert more galactic cosmic rays away from the earth,
leading to less low-level cloud formation and higher surface
temperatures.
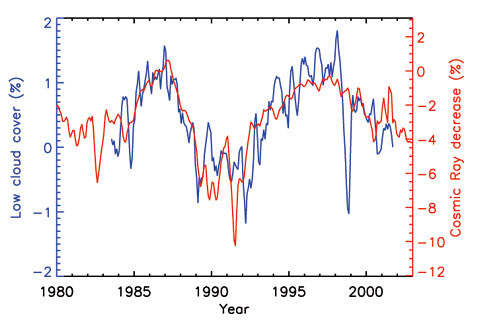
Fig. 5.2
The correlation between cosmic ray flux (red)
measured in
low magnetic latitudes and low-altitude cloud cover (blue) using ISCCP satellite data.
(Shaviv, 2005)
The idea that cosmic rays seed clouds has met with strong resistance
from mainstream climate experts, who prefer to fixate on CO2.
The IPCC (2001) concluded:
‘At present there is insufficient evidence to
confirm that cloud cover responds to solar variability.’
However,
the causal mechanism linking cosmic rays and cloud formation has
recently received support from an experiment in Denmark called SKY
(Danish for ‘cloud' ), which was carried out in a large reaction
chamber containing a mixture of gases to simulate the atmosphere,
and using ultraviolet lamps to mimic the action of the sun’s rays.
Theodor Landscheidt (1998) contends that the effect of clouds on
weather and climate is a hundred times stronger than that of
atmospheric CO2. Even if the atmosphere’s CO2 content doubled, its
effect would be cancelled out if the cloud cover expanded by 1%.
He
writes:
The global cloud coverage diminished from its peak at the end of
1986 to its bottom in the middle of 1990 by more than 3%.
According
to observations by V. Ramanathan, B.R. Barkstrom, and E.F. Harrison
[1989], clouds have a net cooling effect of -17 W/m². Svensmark and
Friis-Christensen [1997] conclude from the diminution of this
cooling effect between 1986 and 1990 that the solar irradiance has
increased by about 1.5 W/m² within these three and a half years.
A
change of this order is quite remarkable, since the total radiative
forcing by carbon dioxide accumulated since 1750 has been estimated
by the IPCC not to go beyond 1.5 W/m². This means that cosmic rays,
strongly modulated by solar activity, achieve an effect within three
and a half years for which the accumulation of carbon dioxide in the
atmosphere needs centuries.
This shows clearly to what extent the
greenhouse effect has been overestimated in comparison with the
solar contribution to climate change, which turns out to be the most
important factor.
In the same vein, Ján Veizer (2005) notes that the cloud-driven
changes in earth’s radiation budget during last two decades (up to
10 W/m²) considerably exceed the forcing the IPCC (2001) attributes
to the entire ‘industrial’, i.e. post-Little Ice Age, anthropogenic
greenhouse impact (2.4 W/m²).
He writes:
The tiny carbon cycle is piggybacking on the huge water cycle
(clouds included), not driving it. In such a perspective, CO2 can
amplify or modulate natural climatic trends, but it is not likely to
be their principal ‘driver’.
(p. 22)
Veizer says that the temperature trend over the past century
correlates well with solar properties such as cosmic-ray flux (CRF)
and total solar irradiance (TSI), except perhaps for the last two
decades of the 20th century.
Some researchers believe that solar
activity is responsible for no more than 30% of warming since 1970
(Stuart, 2006). This is often interpreted as a sign that greenhouse
gases, specifically CO2, have taken over as the main climate driver.
However, Veizer points out that climate models generally do not
incorporate the active carbon cycle and its dynamics; CO2 is
inputted in the form of energy (~4 W/m² for a doubling of CO2).
These models would yield outcomes in the same general direction,
regardless of the source of this additional energy, be it CO2 or TSI.
Moreover, taking into account the empirical evidence, such as the
unprecedented solar activity during the late 20th century or the
coeval decline in global albedo (‘earthshine’) and considering that
the 1915-1999 TSI trend from the Mt. Wilson and Sacramento Peak
Observatories can explain 80% of the 11-year smoothed variance in
global temperature, the celestial cause as a primary driver again
appears to be a more consistent explanation.
(p. 20)
He also argues that, while the balloon and satellite data do not
show any clear temperature trend in recent decades, their
inter-annual temperature oscillations correlate clearly with the
solar irradiance and cosmic-ray flux, and he concludes that solar
phenomena were probably the primary climate driver in both the
distant and most recent past.
Landscheidt (1998, 1999, 2000a,b, 2001, 2003), too, argues that
solar forcing has been just as strong in recent decades as in the
first half of the last century.
He shows that El Niño, the North
Atlantic Oscillation, the Pacific Decadal Oscillation, maxima and
minima in global temperature anomalies, drought in Africa and the
USA, and European floods are probably linked to cycles in solar
activity.
Having already made a number of accurate forecasts, he
predicts that a trend towards global cooling should develop
in the next five to six decades - despite the ongoing buildup of greenhouse
gases.
Earth scientist Tim Patterson writes:
With our star’s variability accounting for about half of all the
recorded warming in the last hundred years, only 0.3°C is left over
for everything else, including urbanization and land use. The amount
is even less if an additional 0.1-0.2°C of natural temperature
fluctuation is factored in. If increased CO2 levels have contributed
to global warming at all in the past century, its contribution must
have been very minor indeed.
(www.envirotruth.org)
We are living in a period of abnormally high solar activity; the
latter half of the 20th century saw the highest sunspot numbers in
the past 1150 years. High solar activity tends to last 50-100 years,
followed by a crash.
The sun’s activity will be weaker during the
next decade than for over 100 years, and some calculations suggest
that this could lead to a cooling of the earth’s atmosphere by 0.2°C
(Stuart, 2006) - greater than the reduction expected from Kyoto by
the end of the century.
6. Modeling fantasies
A serious menace is posed by the large band of ‘climate modelers’
armed with supercomputers and wedded to the anthropogenic global
warming ideology and agenda.
They are largely responsible for the
widespread belief that humans are disrupting the climate in ways
already visible and about to spiral out of control.
Although the IPCC (2001) admits that, since the climate is a coupled nonlinear
system, ‘the prediction of a specific future climate is not
possible’, the Summary for Policymakers tends to play down
uncertainty and presents alarmist scenarios for which there is no
real evidence.
Climate models (known as general circulation models or GCMs)
inevitably fail to do justice to the immense complexity of the
climate system. They reflect our incomplete understanding of how the
various atmospheric, land surface, and oceanic components interact.
Even their own creators admit that they are no more than ‘an attempt
at computer-aided story-telling’.
The models embody the basic assumption that CO2 is the principal
climate driver and that variations in solar input are of subordinate
or negligible impact.
Due to the models’ coarse spatial resolution,
important climate processes such as clouds or ocean circulations can
only be roughly approximated (‘parameterized’). The models cannot
accurately reproduce the motions of the atmosphere and oceans, and
do a poor job of simulating the natural variability of the climate.
Key factors that are still poorly handled include volcanic
eruptions, stratospheric ozone variations, sulfate aerosol changes,
water vapour feedback, and the impact of solar particles and
radiation.
Climate models are unable to project or back-cast cyclical climatic
behavior, such as the El Niño - Southern Oscillation (ENSO), which
is the warm phase of a natural ocean cycle and repeats every 2 to 8
years in the tropical Pacific, the 60-to-80-year North Atlantic
Oscillation (NAO), and the Pacific Decadal Oscillation (PDO).
Since
CO2-based models produce smooth temperature increases, not sudden
jumps, they could neither predict nor explain the 1976 Great Pacific
Climate Shift (a sudden warming, marking a phase shift in the PDO),
or the temperature peak in 1998, when an unusually strong El Niño
led to an increase in water vapor at the equator, causing an almost
1°C spike in worldwide average temperatures. Nor did the models
predict the slight cooling that followed.
Commonly used climate models have higher rates of heat transfer to
the deep ocean than observed, and tend to over-predict the warming
of the surface layer by a factor of up to three. Moreover, the heat
content of the upper ocean decreased between 2003 and 2005 by an
amount equal to about 21% of the upper-ocean heat gain between 1955
and 2003 (Lyman et al., 2006).
This underlines the inter-annual
variability in upper-ocean heat content - something which current
climate models are unable to simulate.
As Roger Pielke says, this
indicates that ‘we know less about natural- and human-climate
forcings and feedbacks than included in the IPCC Reports’.
The present models have errors on the order of 50%. They are unable
to calculate correctly either the present average temperature or the
temperature ranges from the equator to the poles, and have to be
‘tuned’ to replicate the current climate. But a ‘tuned’ model may
provide an adequate simulation of present-day climate for the wrong
reasons.
Computer-model predictions have consistently been wrong. In
1988, IPCC models predicted temperatures would rise 0.8°C per
decade. By 1990, the estimates were down to 0.3° and by 1995 it was
0.2°. The UK Hadley Centre’s models, too, predicted a temperature
increase for the 20th century that was far too high. To solve the
problem, it simply divided the model output by three to ‘predict’
the temperature correctly!
Apart from climate models being speculative, unverified, and
deficient, the IPCC uses them to project global temperature
increases based on unrealistic future scenarios.
Some of them
include absurd assumptions such as an 11-fold increase in coal
production, or a GDP for African countries higher than that of the
US by 2100. Unfortunately the results of these climate computer
games tend to be reported in the media as facts.
As De Freitas
(2003, p. 10) says:
‘There is a difference between scientific
findings and scientists’ speculations. Often the public is not told
which is which.’
Climate models are made more interesting by including positive
feedbacks (multiplier effects) so that a small temperature increase
expected from increasing atmospheric CO2 produces large increases in
water vapor, which produce an exponential rather than a logarithmic
temperature response in the models.
Steve Milloy (2006a) comments:
It appears to have become something of a game to see who can add in
the most creative feedback mechanisms to produce the scariest
warming scenarios from their models but there remains no evidence
the planet includes any such effects or behaves in a similar manner...
[W]e can only measure what the world actually does, and there
simply isn’t room in the measured change for the existence of
significant unmitigated positive feedbacks.
The IPCC expects a doubling of CO2 to lead to a 1.2°C temperature
increase, but if feedbacks are taken into account the figure becomes
1.5 to 4.5°C. If estimates by other researchers and modelers are
included, the range becomes 0.2 to 6.3°C.
Milloy (2006a) says:
‘there has been no narrowing of the estimated range of “expected”
warming from a doubling of CO2 - in fact the range has widened even
further as ever more players attempt to stand out in a crowded
publication field.’
7. Global alarmism
1998 was the warmest year in the instrumental record (which goes
back 150 years), but it was also the year of a particularly strong
El Niño event.
Since then, global temperature has remained fairly
stable. 2005 was the second warmest year in the instrumental record
but is in full accordance with the warming trend of 0.17°C per
decade during the past 30 years.
If this trend were to continue, the
21st century would experience an average increase in surface
temperature of about 1.7°C.
By making a lot of unwarranted
assumptions, however, the IPCC claims in its 2001 report that the
temperature could increase by up to 5.8°C. And the inimitable
Nicholas Stern has recently suggested that the temperature could
rise by up to 10°C.
It should be borne in mind that the 20th century did not see a
constant, steady increase in temperature, and there is no reason to
assume that the present century will be any different. The late
20th-century temperature rise could represent a culmination, and
perhaps even the last culmination, along a warming trend that
started 150 years ago at end of the Little Ice Age.
There are, in
fact, empirical computer models which forecast that early 21st
century temperatures will fall (New Zealand Climate Science
Coalition, 2006b).
As already explained, there is no proof as yet that increasing CO2
concentrations have played a significant role in the rise in
temperature over the past century, let alone that they are the main
factor. Global warming alarmists, however, denounce anyone who makes
such a statement as a ‘denialist’ or ‘flat-earther’, and repeat the
mantra that there is ‘overwhelming evidence’ that anthropogenic CO2
is the main cause of climate change.
They also like to give the
impression that a warming climate will bring only more calamities
and suffering, but no benefits (e.g. warmer winters, wetter deserts,
faster-growing plants).
In his book and accompanying documentary, An Inconvenient Truth
(2006), global warming evangelist
Al Gore accuses scientists who
disagree with the ‘consensus’ of spreading disinformation.
But as
Marco Lewis (2006) and Iain Murray (2006) have documented in detail,
Gore indulges in countless distortions of his own.
A few examples
are presented below.
As far as Gore is concerned, scientists who question the
anthropogenic global warming dogma are just as untrustworthy as
scientists funded by the tobacco industry.
But as John Rudesill
(2006b, p. 22) cautions,
‘alarmist appeals delivered by politicians
in the guise of universal consensus science - with no fair
acknowledgement of contrary views - are likely to be more about
money and power than about objective science’.
(courtesy of Ken Fallin)
Gore makes the false claim that the rate of global warming is
accelerating.
He calls CO2 the ‘most important greenhouse gas’,
ignoring the fact that water vapor is the leading contributor to
the greenhouse effect.
He presents a graph of CO2 levels and global
temperatures during the past 650,000 years, but fails to mention
that it shows that global temperatures were several degrees warmer
than the present during each of the past four interglacial periods,
even though CO2 levels were lower.
He implies that throughout this
period, changes in CO2 levels preceded and largely caused changes in
global temperature, whereas CO2 changes generally followed global
temperature changes by hundreds to thousands of years (Lewis, p. 2,
25).
Gore claims that CO2 concentrations in the Holocene (the period
since the last ice age) never rose above 300 ppm in pre-industrial
times, and that the current level (380 ppm) is far above the range
of natural variability. However, proxy data indicate that, in the
early Holocene, CO2 levels exceeded 330 ppm for centuries and
reached 348 ppm (Lewis, p. 26).
Gore assumes that rising CO2 levels are responsible for recent
rising temperatures and declining sea ice in the Arctic, whereas
both are within the range of natural variability. He fails to
mention that arctic temperatures in the 1930s equaled or exceeded
those of the late 20th century, that the rate of warming during the
earlier decade was 50% higher, and that the Arctic during the early-
to mid-Holocene was significantly warmer than today (Murray 2006).
He warns that melt-water from Greenland could disrupt the Atlantic
thermohaline circulation (the ocean ‘conveyor belt’ that, along with
the Gulf Stream, keeps Europe relatively warm in wintertime).
This
is based on research indicating that a major disruption occurred
8200 years ago when a giant ice dam burst in North America, allowing
two lakes to drain rapidly into the sea. He forgets to mention that
the lakes injected more than 100,000 cubic kilometers of freshwater
into the sea, whereas Greenland ice melt contributes just a few
hundred cubic kilometers a year (Lewis, p. 102-3).
Gore claims that global warming endangers polar bears even though
polar bear populations are increasing in Arctic areas where it is
warming and declining in Arctic areas where it is cooling. He states
that polar bears ‘have been drowning in significant numbers’ - based
on a report that four drowned polar bears were found in one month in
one year, following an abrupt storm!
Gore portrays the collapse in 2002 of the Larson-B ice-shelf
- a
formation the ‘size of Rhode Island’ - as a harbinger of doom. For
comparison, the Larson-B was 1/180th the size of Texas and 1/246th
the size of the West Antarctic Ice Sheet. Small areas of
the
Antarctic Peninsula, where the ice-shelf was situated, also broke up
in earlier times. But according to a forthcoming report from the IPCC, climate models based on anthropogenic forcing cannot explain
the anomalous warming of the Antarctic Peninsula (Murray 2006).
The
recent temperature increase in this part of Antarctica may be due to
a small change in the position of low pressure systems.
Although
Gore gives the impression that all of Antarctica is losing ice mass,
from 1992 to 2003 the East Antarctic Ice Sheet gained mass (from
snow accumulation) faster than the western ice sheet lost mass,
yielding a net increase in Antarctic ice (David et al., 2005).
Lewis writes:
[Gore cites] Turner et al. (2006), who found a 0.5°C to 0.7°C per
decade wintertime warming trend in the mid-troposphere above
Antarctica, as measured by weather balloons, but neglects to mention
that Turner et al. found much less warming - about 0.15°C/decade - at the Antarctic surface, or that NASA satellites, which also
measure troposphere temperatures, show a 0.12°C/decade Antarctic
cooling trend since November 1978.
(p. 98)
Gore manages to blame anthropogenic global warming for each and
every negative climate event.
An example is the European heat wave
of 2003 - but this is generally attributed to an atmospheric
pressure anomaly, not global warming. Gore exaggerates the link
between global warming and the frequency and severity of tropical
storms. Even the IPCC admits that storm intensity and frequency are
dominated by interdecadal and multidecadal variations, and that no
significant trends are evident over the 20th century.
Gore automatically assumes that retreating glaciers are evidence of
anthropogenic global warming.
But things are not so simple: many
glaciers have been retreating since the Little Ice Age, long before
any increase in man-made greenhouse gases, while others have been
static or are advancing. Despite the warming, the world’s two major
icecaps appear to be stable, and there is no compelling evidence
that modern glacial changes fall outside natural climate
variability.
Gore cites the shrinking snows of Kilimanjaro as an illustration of
the havoc wrought by global warming. But Kilimanjaro’s glacier began
to recede around 1880, well before the modern era of greenhouse
warming.
Moreover, the Kilimanjaro glacier has retreated in periods
of both global warming and cooling - and even in a period of
regional cooling. The strong recession of all glaciers in equatorial
East Africa in modern times seems to be caused mainly by reduced
precipitation and increased shortwave radiation due to decreases in
cloudiness (Lewis, p. 7).
The number of floods has been increasing, but so have the reporting
and recording of floods. For Gore, flood damage data are clear
evidence of a global-warming ravaged planet. For instance, he blames
global warming for severe floods in China’s Sichuan and Shandong
provinces in 2003, even though far more damaging floods struck those
areas in the 19th and early 20th centuries.
Gore blames global warming for the disappearance of Lake Chad, a
disaster more likely stemming from a combination of regional climate
variability, population increase, and overgrazing. He claims global
warming is drying out soils all over the world, whereas evaporation
studies indicate that the earth’s surface is generally becoming
wetter. He warns that global warming is destroying coral reefs, even
though today’s main reef builders evolved and thrived during the
Mesozoic, when temperatures and CO2 levels were far higher than
today (Lewis, p. 102-3).
Gore blames global warming for the resurgence of malaria in Kenya,
even though several studies found no climate link and attribute the
problem to decreased spraying of homes with DDT, anti-malarial drug
resistance, and incompetent public health programs.
In The Lancet
(June 2004) nine leading malariologists criticized models linking
global warming to increased malaria as ‘misleading’ and displaying a
‘lack of knowledge’ (Murray, 2006).
Gore insinuates that global
warming is a factor in the emergence of some 30 ‘new’ diseases over
the last three decades, but cites no supporting research or
evidence.
Sea level has risen by over 120 meters since the end of the last ice
age. During the last century it rose by about 18 cm and showed no
sign of accelerating. If present trends continue, it will rise by
about 31 cm (about one foot) by 2100 (Lewis, p. 72). The IPCC (2001)
projects a sea level rise of 9 to 88 cm for 1990-2100, mainly due to
thermal expansion and loss of mass from glaciers and ice caps.
However, in its forthcoming 2007 report it reduces the expected rise
to between 14 and 43 cm.
But none of this is scary or ‘gory’ enough for Gore, who creates the
impression that sea levels could rise by 20 feet (6 meters) within
our own lifetime! He presents 10 pages of before-and-after
‘photographs’ showing what 20 feet of sea level rise would do to the
world’s major coastal communities.
Lewis comments:
There is no credible evidence of an impending collapse of the great
ice sheets. We do have fairly good data on ice mass balance changes
and their effects on sea level. Zwally et al. (2005) found a
combined Greenland/Antarctica ice-loss-sea-level-rise equivalent of
0.05 mm per year during 1992-2002. At that rate it would take a full
millennium to raise sea level by just 5 cm.
(p. 104)
Gore cites the Polynesian island of Tuvalu as a place where rising
sea levels are forcing residents to flee their homes. In reality,
sea levels at Tuvalu fell during the latter half of the 20th century
and even during the 1990s, allegedly the warmest decade of the
millennium (Lewis, p. 105).
Alarmists also like to claim that the
Maldives in the Indian Ocean are about to disappear beneath the
ocean waves. But a study in 2004 found that the sea level there had
been falling for the last 30 years (Van der Lingen, 2005).
Further warming could in fact slow down rather than accelerate the
ongoing rise in sea levels:
‘Modest warming of the Earth would
increase evaporation from the oceans, leading to increased
deposition of snow on the polar ice caps, principally in the
Antarctic... During the strong warming episode of 1920-1940,
sea-level rise did not accelerate but actually stopped’.
(De Freitas,
2003, p. 9)
Gore claimed in an interview that ‘the debate in the scientific
community is over’.
But when confronted with the fact that the best
estimates of rising sea levels are far less dire than he suggests in
his movie, he asserted that scientists,
‘don’t have any models that
give them a high level of confidence’, and tried to defend his
idiotic claims by saying that scientists ‘just don’t know’.
(Lindzen,
2006)
Gore includes a quotation from Churchill about the era of
half-measures and delays coming to a close.
But Iain Murray advises
him to read what Churchill said when he was asked what qualities a
politician requires:
‘The ability to foretell what is going to
happen tomorrow, next week, next month and next year. And to have
the ability afterwards to explain why it didn’t happen.’
8. New science and technology
The experimentally-grounded aether-science model known as
aetherometry, developed by Paulo and Alexandra Correa, has
identified fundamental deficiencies not only in mainstream physics,
chemistry, and biology, but also in meteorology and climatology.
What official science lacks above all is any understanding of the
world of the aether, which interpenetrates and largely generates and
sustains our physical world of matter.
One of aetherometry’s key insights is that the sun does not emit
electromagnetic radiation that then travels through space and is
absorbed or reflected in the earth’s atmosphere or by its surface.
What the sun emits is aetheric (‘mass-free’) electric radiation.
Aetherometry sees this electric radiation, whose spectrum it has
identified, as one of the two primary components of the aether.
It
is ambipolar (whereas mass-bound charges such as electrons and
protons are monopolar), propagates as longitudinal waves (whereas
electromagnetic radiation consists of transverse waves), and is not
limited to the speed of light.
Photons are considered to be transient, locally-produced vortices of
aether; ionizing photons result from the decay of elements of
matter, whereas non-ionizing (blackbody) photons are generated when
matter particles decelerate and shed the kinetic energy gained from
interaction with aetheric electric radiation. The local production
of photons has been established experimentally and is confirmed by
some of the Correas’ aether-energy technologies.
Another key insight is that ‘heat’ comprises more than just sensible
heat - which takes the form of either molecular motion or thermal
(infrared) electromagnetic radiation.
According to aetherometry, the
second main component of the aether is latent energy:
Nonelectric
energy with antigravitic properties, associated with the molecules
of matter and their phase states.
It is loosely known to chemists
and meteorologists as ‘latent heat’, but its true nature remains
unexplained by conventional science.
The Correas write:
even though meteorologists are taught that most of the atmospheric
energy budget exists only in the form of latent heat, there is no
adequate physics or physical understanding of the circulation and
key role of this latent form of energy in the atmosphere, nor a real
understanding of the energy conversions into and from it.
All
arguments are reduced to radiative treatments of electromagnetic
energy, plus the mechanics of the movements of cold and hot air
masses.
(Correa & Correa, 2005)
Orthodox science lacks a proper understanding of atmospheric cycles:
Earth climate is inextricably linked to the fundamental allotropic
cycle of gas substrates that constantly regenerates the atmosphere,
and in which water and oxygen play a privileged role.
But climate
modelers and global warming acolytes make parameters such as ozone
or CO2 concentrations into end-point references, disregarding the
complexity of such interlinked processes... Ozone is not an end
point, but a stage in the oxygen cycle, and cycles exist exactly so
that systems may self-regulate via negative feedback.
(ibid.)
The most fundamental atmospheric cycle is the cycle of
water,
oxygen, and ozone. It is noteworthy that official science has never
managed to balance the energy budget (enthalpy) of this cycle.
This
is ‘one more proof of how far meteorology and climatology are from
grasping their subject’.
The Correas (2001) were the first to
publish a solution to this problem, showing that the formation of
oxygen and water requires the creation of electrons and photons from
aether energy, and that it is through this process that the bulk of
solar energy is transformed into blue light and infrared photons,
i.e. radiant sensible heat.
They write:
Most such radiant sensible heat is generated as blue light and IR
photons, not by CO2 or water vapor, but by the atmospheric cycle
that forms oxygen from ozone together with the formation of water
from atomic oxygen, protons and electrons.
The joint formation of
oxygen and water are the main natural processes releasing heat in
the atmosphere.
(Correa & Correa, 2005)
The main energy reservoirs are the oceans, as land surfaces cannot
hold energy for long periods, but it is a great mystery to
oceanographers and climatologists how the oceans absorb solar
radiation and store it as latent heat.
The question of latent heat
is also crucial to understanding processes involving water vapor:
How it forms non-covalent bonds with other molecules, how it rises in
the atmosphere as a function of its latent heat content, how it
stores this latent heat in its phase state, how its latent heat
content is trapped in the formation of clouds - all these basic
questions have been insufficiently explored to be understood or
incorporated into general climatological models.
(ibid.)
The Correas argue that the myth of anthropogenic global warming is
based on a lack of understanding of natural decadal, supradecadal,
and intradecadal oscillations (not ‘trends’) in the temperature and
chemical composition of the atmosphere.
These oscillations reflect a complex interplay between various
natural factors and their fluctuation, most prominent among which
are solar radiation, atmospheric latent heat, atmospheric
electricity and geothermal energy.
Without a serious physical and
chemical grasp of these natural factors, there is little hope that
one can isolate the climatic and meteorological impact of man-made
actions - deforestation, urbanization, pollution, warming and
cooling.
(ibid.)
One of the great myths of media geoscience is that
stratospheric
ozone protects the earth from harmful ultraviolet radiation from the
sun.
The Correas say that,
‘enthalpy balance and a painstaking
analysis of energy and radiation shows that, in fact, ozone does not
absorb harmful UV’.
Rather, it emits near-UV upon its formation from
oxygen. Once formed, it can absorb near-UV radiation, but this
radiation is emitted locally from free electrons, and does not come
from the sun.
To say that stratospheric ozone over Antarctica has
decreased over a given period is not proof of anything, as it could
be due to reactions with pollutants or to variations in solar ambipolar radiation.
[C]laims of a ‘hole in the Antarctica ozone’ and ‘consequent
increased melanoma risk of skin exposure’, etc... are only further
instances of media-driven alarmist faddism, senseless
scientifically, but with plenty of logic when it comes to the jobs
of Antarctic climatologists, or the profits of media empires and
sunscreen industries.
(ibid.)
As the Correas say,
‘the atmosphere is far too complex a system, and
too dependent on the oceans, on geothermal energy and solar
radiation, to be arbitrarily reduced to processes driven by single
causes, such as the emission of carbon dioxide, or even the
production of “greenhouse gases” ’.
The main effect of man-made
pollution, they say, is not global warming but a complex alteration
of atmospheric chemistry and energy conversion processes, little of
which is being investigated. As a result, the role of CO2 in warming
the atmosphere has been overestimated.
They conclude:
Until a comprehensive account of all forms of sensible heat (radiant
and convective), latent heat (of state, as internal energy or
non-covalent) and electric energy (mass-bound kinetic energy and
mass-free radiation) is made, there will be no science of weather and
climate, no meteorology or climatology that can claim to be a
science and is able to predict climate change and hurricane paths.
Until then, it will remain what it is
- a media spectacle of
pseudo-scientists in the pay of the State and corporate interests, an
Official pseudo-Science.
(ibid.)
A more accurate understanding of the climate system will therefore
require new science.
But there is also a need for new technologies.
If the use of oil, coal, and gas for producing energy is reduced,
other energy sources will have to be found. There is considerable
controversy on the extent to which nuclear power and/or renewable
energy sources (e.g. wind power and solar power) could or should
contribute to meeting world energy needs.
Yet there is an infinite source of completely clean energy available
- the aether.
Since the second half of the 19th century, several
researchers have developed ‘free-energy’ devices of one type or
another, which tap energy from the aether (Tutt, 2001; Mallove,
2001). Key pioneers in this field include
Nikola Tesla and
Wilhelm
Reich, whose work has been taken further in recent decades by the Correas.
Intriguing results have also been obtained by, among
others, Peter and Neal Graneau (extraction of energy from water arc
explosions), Randell Mills (extraction of energy from collapsed
hydrogen, or ‘hydrinos’), and various researchers in the field of
low-energy nuclear reactions, or ‘cold fusion’.
The Correas have developed three power generation technologies:
-
the
patented Pulsed Abnormal Glow Discharge (PAGD)
electricity-generating reactors
-
the HYBORAC solar and atmospheric
energy converter, which taps the latent heat of metal enclosures (orgone
accumulators, or ORACs)
-
the patented aether motor (an
improvement of Reich’s orgone motor), which extracts mass-free energy
from ORACs, living beings, the ground, vacuums, and atmospheric
antennas (Correa & Correa, 2006)
Whether any investors are
far-sighted enough to back the development and commercialization of
these revolutionary technologies remains to be seen.
9. Sources
-
Balling, Robert C., 2005.
Observational surface temperature records versus model
predictions. In: Patrick J. Michaels (ed.), Shattered
Consensus: The true state of global warming, Lanham,
Rowman & Littlefield, p. 50-71
-
Bluemle, John P., 1999.
Global
warming: a geological perspective.
-
Bond, G., et al., 2001.
Persistent solar influence on North Atlantic climate during
the Holocene. Science, v. 294, p. 2130-36
-
Carter, Bob, 2006.
The Global Warming Emperor Has No
Clothes.
-
Christy, John, 2005. Temperature
changes in the bulk atmosphere: beyond the IPCC. In: Patrick
J. Michaels (ed.), Shattered Consensus: The true state
of global warming, Lanham, Rowman & Littlefield, p.
72-105
-
Clark, Stuart, 2006. Saved by
the sun. New Scientist, 16 Sept, p. 32-36
-
Correa, Paulo N., &
Correa, Alexandra N., 2001.
The allotropic cycle of oxygen, ozone and water: foundations
of photo- and aetherochemistry. ABRI monograph AS2-09,
Toronto, Akronos Publishing
-
Correa, Paulo N., &
Correa, Alexandra N., 2005. "Global
Warming" - An Official Pseudoscience.
-
Correa, Paulo N., &
Correa, Alexandra N., 2006.
The Discovery of the Aether Motor (1): (Re-)discovery of the
orgone motor. Toronto, Akronos Publishing
-
CSPP (Center for Science and
Public Policy), 2006.
The Stern Report: some early criticisms. November
-
David, C.H., et al., 2005.
Snowfall-driven growth in East Antarctic ice sheet mitigates
recent sea-level rise. Science, v. 308, p.
1898-1901.
-
De Freitas, Chris, 2003.
Global Warming - Predictions Versus
Reality. New
Zealand Geographic, no. 64, p. 6-10
-
Deming, David, 2005. Global
warming, the politicization of science, and Michael
Crichton’s State of Fear. Journal of Scientific
Exploration, v. 19, p. 247-56
-
Esper, J., Cook, E.R., &
Schweingruber, F.H., 2002. Low-frequency signals in long
tree-ring chronologies for reconstructing past temperature
variability. Science, v. 295, p. 2250-53
-
Esper, J., et al., 2005.
Climate - Past Ranges and Future
Changes. Quaternary
Science Reviews, v. 24, p. 2164-66
-
Fischer, H., et al., 1999.
Ice core records of atmospheric CO2
around the last three glacial terminations. Science,
v. 283, p. 1712-14
-
Gray, Vincent, 2004.
The
Greenhouse Delusion: Critique of ‘Climate Change 2001: the
scientific basis’.
-
Gray, Vincent, 2006.
Temperature trends in the lower atmosphere.
-
Hansen, J.E., et al., 2001.
A closer look at United States and global surface
temperature change. Journal of Geophysical Research,
v. 106, p. 23947-63
-
Hayden, Howard, 2004.
Global warming: more hot air. 21st Century Science
and Technology, spring
-
Hogan, James P., 2004.
Kicking
the Sacred Cow: Questioning the unquestionable and thinking
the impermissible. Riverdale, NY, Baen
-
Idso, Sherwood B., 2001.
The variable energy output of the sun appears to be the
major determinant of decadal- to millennial-scale global
climate change.
-
Idso, Sherwood, Idso, Keith, &
Idso, Craig, 2006.
Solar-powered millennial-scale climatic change.
-
IPCC, 2001.
Climate
Change 2001: IPCC Third Assessment Report.
-
Jaworowski, Zbigniew,
2003/4.
Solar Cycles, Not CO2,
Determine Climate. 21st
Century Science and Technology, winter, p. 52-65
-
Jones, P.D., et al., 1998.
High-resolution palaeoclimatic records for the past
millennium - interpretation, integration and comparison with
general circulation model control-run temperatures. The
Holocene, v. 8, p. 455-71
-
Jorgensen, Mike, 2004.
Discussion on The New Mexican website.
-
Landscheidt, Theodor, 1998.
Solar
activity: a dominant factor in climate dynamics.
-
Landscheidt, Theodor, 1999.
Solar activity controls el Niño and la Niña.
-
Landscheidt, Theodor, 2000a.
New confirmation
of strong solar forcing of climate.
-
Landscheidt, Theodor, 2000b.
Sun’s
role in the satellite-balloon-surface issue.
-
Landscheidt, Theodor, 2001.
Trends in Pacific decadal oscillation subjected to solar
forcing.
-
Landscheidt, Theodor, 2003.
Decadal-scale variations in El-Niño intensity.
-
Lewis, Marlo, 2006.
A Skeptic’s Guide to An
Inconvenient Truth. Competitive Enterprise Institute
-
Lindzen, Richard S., 2006.
Don’t believe the hype. OpinionJournal, 2 July
-
Lomborg, Bjørn, 2001.
The Skeptical
Environmentalist: Measuring the real state of the world.
Cambridge University Press
-
Lyman, J.M., Willis, J.K., &
Johnson, G.C., 2006.
Recent cooling of the upper ocean. Geophysical
Research Letters, v. 33, L18604
-
Mallove, Eugene F., 2001.
Aether science and technology. Infinite Energy,
v. 7, no. 39, p. 6-11
-
Mann, M.E., Bradley, R.S., &
Hughes, M.K., 1998. Global-scale temperature patterns and
climate forcings over the past six centuries. Nature,
v. 392, p. 779-87
-
Mann, M.E., Bradley, R.S., &
Hughes, M.K., 1998. Northern hemisphere temperatures during
the past millennium: inferences, uncertainties and
limitations. Geophysical Research Letters, v. 26,
p. 759-62
-
Marsh, Nigel D., & Svensmark,
Henrik, 2000.
Low cloud properties influenced by cosmic rays.
Phys. Rev. Lett., v. 85, p. 5004-07
-
Marshall Institute, 2006.
Climate Issues & Questions.
-
McIntyre, S., & McKitrick, R.,
2003. Corrections to the Mann et al. (1998) data base and
northern hemispheric average temperature series.
Environment and Energy, v. 14, p. 751-71
-
McIntyre, Steve, & McKitrick, Ross,
2006.
Misled again: the Hockey Stick climate. National
Post, 12 July
-
McKitrick, Ross, 2005. The Mann
et al. northern hemisphere ‘hockey stick’ climate index: a
tale of due diligence. In: Patrick J. Michaels (ed.),
Shattered Consensus: The true state of global warming,
Lanham, Rowman & Littlefield, p. 20-49
-
Michaels, Patrick J. (ed.),
2005. Shattered Consensus: The true state of global
warming, Lanham, Rowman & Littlefield
-
Milloy, Steven, 2006a.
The real
‘inconvenient truth’.
-
Milloy, Steven, 2006b.
If
‘global warming’ is real, what could be causing it?
-
Moberg, A., et al., 2005. Highly
variable northern hemisphere temperatures from low- and
high-resolution proxy data. Nature, v. 433, p.
613-17
-
Monckton, Christopher, 2006a.
Climate chaos? Don’t believe it. Sunday Telegraph,
5 Nov
-
Monckton, Christopher, 2006b.
Wrong problem, wrong solution. Sunday Telegraph,
12 Nov
-
Monckton, Christopher, 2006c.
Apocalypse cancelled: discussion, calculations and
references.
http://www.telegraph.co.uk/news/graphics/2006/11/05/warm-refs.pdf
-
Murray, Iian, 2006.
Gorey truths: 25 inconvenient truths for Al Gore.
National Review Online, 22 June
-
New Zealand Climate Science
Coalition, 2006a.
An open letter to the New Zealand House of Representatives.
-
New Zealand Climate Science
Coalition, 2006b.
Response to comments by Dr David Wratt.
-
Overpeck, J., et al., 1997.
Arctic environmental change of the last four centuries.
Science, v. 278, p. 1251-56
-
Pollack, H.N., & Smerdon, J.E.,
2004. Borehole climate reconstructions - spatial structures
and hemispheric averages. Journal of Geophysical
Research, v. 109, D11106
-
Polyakov, I.V., et al., 2003.
Variability and trends of air temperature and pressure in
the maritime Arctic, 1875-2000. Journal of Climate,
v. 16, p. 2067-77
-
Posmentier, Eric S., & Soon,
Willie, 2005. Limitations of computer predictions of the
effects of carbon dioxide on global climate. In: Patrick J.
Michaels (ed.), Shattered Consensus: The true state of
global warming, Lanham, Rowman & Littlefield, p. 241-81
-
Ramanathan, V., Barkstrom, B.R.,
& Harrison, E.F., 1989. Climate and the earth’s radiation
budget. Physics Today, May, p. 22-32
-
Rudesill, John A., 2006a.
Greenhouse gas effects on global climate: water vapor vs.
carbon dioxide. Infinite Energy, v. 11, no. 65, p.
19-22
-
Rudesill, John A., 2006b.
Insisting on honest and accurate science: a review of ‘An
Inconvenient Truth’. Infinite Energy, v. 12, no.
69, p. 21-23
-
Shaviv, Nir J., 2005.
Cosmic rays and climate. PhysicaPlus, no. 5
-
Soon, Wille, Baliunas, Sallie
L., Robinson, Arthur B., & Robinson, Zachary W. 2001.
Global Warming - A Guide to The
Science. Vancouver,
The Fraser Institute
-
Soon, W., & Baliunas, S., 2003.
Proxy climatic and environmental changes of the past 1,000
years. Climate Research, v. 23, p. 89-110
-
Stevenson, Robert E., 2000.
Yes, the ocean has warmed; no, it’s not ‘global warming’,
21st Century Science and Technology, summer, p.
60-65
-
Svensmark, H., & Friis-Christensen,
E., 1997.
Variation of cosmic ray flux and global cloud coverage - a
missing link in solar-climate relationships. Journal
of Atmospheric and Solar-Terrestrial Physics, v. 59, p.
1225-32
-
Turner, J., et al., 2006.
Significant warming of the Antarctic winter troposphere.
Science, v. 311, p. 1914-17.
-
Tutt, Keith, 2001. The
Search for Free Energy: A scientific tale of jealousy,
genius and electricity. London, Simon & Schuster
-
Usoskin et al., 2004.
Latitudinal dependence of low cloud amount on cosmic ray
induced ionization. Geophysical Research Letters,
v. 31, L16109
-
Van der Lingen, Gerrit J., 2005.
The anthropogenic global warming doctrine.
Newsletter of the Geological Society of New Zealand,
no. 138, p. 60-64
-
Veizer, Ján, 2005.
Celestial climate driver: a perspective from four billion
years of the carbon cycle. Geoscience Canada,
v. 32, p. 13-28
-
Wall Street Journal, 2006.
Hockey stick hokum. Editorial, 14 July
-
Zwally, H.J., et al., 2005. Mass
changes of the Greenland and Antarctic ice sheets and
shelves and contributions to sea-level rise: 1992-2002.
Journal of Glaciology, v. 51, p. 509-27
|