|
Acknowledgements
Fingerprints of the Gods could not have been written without the
generous, warm-hearted and sustaining love of my partner Santha
Faiia— who always gives more than she takes and who enriches the
lives of everyone around her with creativity, kindness and
imagination. All the photographs in the book are her work.
I am also grateful for the support and encouragement of our six
children—Gabrielle, Leila, Luke, Ravi, Sean and Shanti—each one of
whom I feel privileged to know.
My parents, Donald and Muriel Hancock, have been incredibly helpful,
active and involved through this and many other difficult times and
projects. Together with my uncle James Macaulay they have also
patiently read the drafts of the evolving manuscript, offering a
wealth of positive suggestions. Thanks, too, to my oldest and
closest friend, Peter Marshall, with whom I have weathered many
storms, and to Rob Gardner, Joseph and Sherry Jahoda, Roel Oostra,
Joseph and Laura Schor, Niven Sinclair, Colin Skinner and Clem
Vallance, all of whom gave me good advice.
In 1992 I suddenly found that I had a friend in Lansing, Michigan.
His name is Ed Ponist and he got in touch with me soon after the
publication of my previous book, The Sign and the Seal. Like a
guardian angel he volunteered to devote a hefty chunk of his spare
time to helping me out in the US with research, contacts and the
collection of documentary resources of relevance to Fingerprints of
the Gods.
He did a brilliant job, always sending me the right books
just when I needed them and finding references that I didn’t even
know existed. He was also an accurate weather-vane on the quality of
my work, whose judgment I quickly learned to trust and respect.
Last but not least, when Santha and I went to Arizona, to the Hopi
Nation, it was Ed who came with us and who opened the way.
Ed’s initial letter was part of an overwhelming deluge of mail that
I received from around the world after writing The Sign and the
Seal. For a while I tried to answer all the letters individually.
Eventually, however, I got swamped with the new work on Fingerprints
and had to stop replying. I feel bad about this, and would like to
take this opportunity to thank everybody who wrote to me and to whom
I did not write back. I’m intending to be more systematic in the
future because I enormously value this correspondence and appreciate
the high-quality information that it frequently turns out to contain
...
Other researchers who have helped me on Fingerprints of the Gods
have been Martin Slavin, David Mestecky and Jonathan Derrick. In
addition I would like to thank my Anglophone editors on both sides
of the Atlantic, Tom Weldon at Heinemann, Jim Wade at Crown and John
Pearce at Doubleday Canada, as well as my literary agents Bill
Hamilton and Sara Fisher, for their continuing commitment,
solidarity and wise counsel.
My warmest appreciation also to those co-researchers and colleagues
who have become my friends during the course of this investigation:
Robert Bauval in Britain (with whom I shall be co-authoring two
future books on related subjects), Colin Wilson, John Anthony West
and Lew Jenkins in the United States, Rand and Rose Flem-Ath and
Paul William Roberts in Canada.
Finally I want to pay tribute to Ignatius Donnelly, Arthur Posnansky,
R.A. Schwaller de Lubicz, Charles Hapgood and Giorgio de Santillana—
investigators who saw that something was badly wrong with the
history of mankind, who had the courage to speak out against
intellectual adversity, and who pioneered the momentous paradigm
shift that is now irrevocably under way.
Back to
Contents
Part I
The Mystery of the Maps
Chapter 1 -
A Map of Hidden Places
8 RECONNAISSANCE TECHNICAL SQUADRON (SAC)
UNITED STATES AIRFORCE
Westover Airforce Base
Massachusetts
6 July 1960
SUBJECT: Admiral Piri Reis World Map
To: Professor Charles H. Hapgood,Keene College,Keene, New Hampshire.
Dear Professor Hapgood,
Your request for evaluation of certain unusual features of the
Piri
Reis World Map of 1513 by this organization has been reviewed.
The claim that the lower part of the map portrays the Princess
Martha Coast of Queen Maud Land Antarctica, and the Palmer
Peninsula, is reasonable. We find this is the most logical and in
all probability the correct interpretation of the map.
The geographical detail shown in the lower part of the map agrees
very remarkably with the results of the seismic profile made across
the top of the ice-cap by the Swedish-British Antarctic Expedition
of 1949.
This indicates the coastline had been mapped before it was covered
by the ice-cap.
The ice-cap in this region is now about a mile thick.
We have no idea how the data on this map can be reconciled with the
supposed state of geographical knowledge in 1513.
HAROLD Z. OHLMEYER
Lt Colonel, USAF Commander
Despite the deadpan language, Ohlmeyer’s letter1 is a bombshell. If
Queen Maud Land was mapped before it was covered by ice, the
original cartography must have been done an extraordinarily long
time ago.
1
Letter reproduced in Charles H. Hapgood FRGS,
Maps of the Ancient
Sea Kings, Chilton Books, Philadelphia and New York, 1966, p. 243.
How long ago exactly?
Conventional wisdom has it that the Antarctic ice-cap, in its
present extent and form, is millions of years old. On closer
examination, this notion turns out to be seriously flawed—so
seriously that we need not assume the map drawn by Admiral Piri Reis
depicts Queen Maud Land as it looked millions of years in the past.
The best recent evidence
suggests that Queen Maud Land, and the neighbouring regions shown on
the map, passed through a long ice-free period which may not have
come completely to an end until about six thousand years ago.2 This
evidence, which we shall touch upon again in the next chapter,
liberates us from the burdensome task of explaining who (or what)
had the technology to undertake an accurate geographical survey of
Antarctica in, say, two million BC, long before our own species came
into existence.
By the same token, since map-making is a complex and
civilized activity, it compels us to explain how such a task could
have been accomplished even six thousand years ago, well before the
development of the first true civilizations recognized by
historians.
Ancient sources
In attempting that explanation it is worth reminding ourselves of
the basic historical and geological facts:
1 - The Piri Reis Map, which is a genuine document, not a hoax of any
kind, was made at Constantinople in AD 1513.3
2 - It focuses on the
western coast of Africa, the eastern coast of South America and the
northern coast of Antarctica.
3 - Piri Reis could not have acquired his information on this latter
region from contemporary explorers because Antarctica remained
undiscovered until AD 1818,4 more than 300 years after he drew the
map.
4 - The ice-free coast of Queen Maud Land shown in the map is a
colossal puzzle because the geological evidence confirms that the
latest date it could have been surveyed and charted in an ice-free
condition is 4000 BC.5
5 - It is not possible to pinpoint the earliest date that such a task
could have been accomplished, but it seems that the Queen Maud Land
littoral may have remained in a stable, unglaciated condition for at
least 9000 years before the spreading ice-cap swallowed it
entirely.6
6 - There is no civilization known to history that had the capacity or
need
to survey that coastline in the relevant period: between 13,000 BC
and
4000 BC.7
2 Ibid., pp. 93-98, 235. The period lasted from about 13000 BC to
4000 BC according, for example, to the findings of Dr Jack Hough of
Illinois University, supported by experts at the Carnegie
Institution, Washington DC. John G. Weiphaupt, a University of
Colorado specialist in seismology and gravity and planetary geology,
is another who supports the view of a relatively late ice-free
period in at least parts of Antarctica. Together with a number of
other geologists, he places that period in a narrower band than
Hough et al.—from 7000 BC to 4000 BC.
3 Ibid., preface, pp. 1,
209-211.
4 Encyclopaedia Britannica, 1991, I:440.
5 Maps of The
Ancient Sea Kings, p. 235.
6 Ibid.
7 Historians recognize no ‘civilizations’ as such prior to 4000 BC.
In other words, the true enigma of this 1513 map is not so much its
inclusion of a continent not discovered until 1818 but its portrayal
of part of the coastline of that continent under ice-free conditions
which came to an end 6000 years ago and have not since recurred.
How can this be explained? Piri Reis obligingly gives us the answer
in a series of notes written in his own hand on the map itself. He
tells us that he was not responsible for the original surveying and
cartography. On the contrary, he admits that his role was merely
that of compiler and copyist and that the map was derived from a
large number of source maps.8 Some of these had been drawn by
contemporary or near-contemporary explorers (including
Christopher
Columbus), who had by then reached South America and the Caribbean,
but others were documents dating back to the fourth century BC or
earlier.9
Piri Reis did not venture any suggestion as to the identity of the
cartographers who had produced the earlier maps. In 1963, however,
Professor Hapgood proposed a novel and thought-provoking solution to
the problem. He argued that some of the source maps the admiral had
made use of, in particular those said to date back to the fourth
century BC, had themselves been based on even older sources, which
in turn had been based on sources originating in the furthest
antiquity. There was, he asserted, irrefutable evidence that the
earth had been comprehensively mapped before 4000 BC by a hitherto
unknown and undiscovered civilization which had achieved a high
level of technological advancement.10
It appears [he concluded] that accurate information has been passed
down from people to people. It appears that the charts must have
originated with a people unknown and they were passed on, perhaps by
the Minoans and the Phoenicians, who were, for a thousand years and
more, the greatest sailors of the ancient world. We have evidence
that they were collected and studied in the great library of
Alexandria [Egypt] and that compilations of them were made by the
geographers who worked there.11
8
Maps of the Ancient Sea Kings, pp. 220-4.
9 Ibid., p. 222.
10 Ibid., p. 193
11
Maps of the Ancient Sea Kings (revised edition), Turnstone Books,
London, 1979, preface.
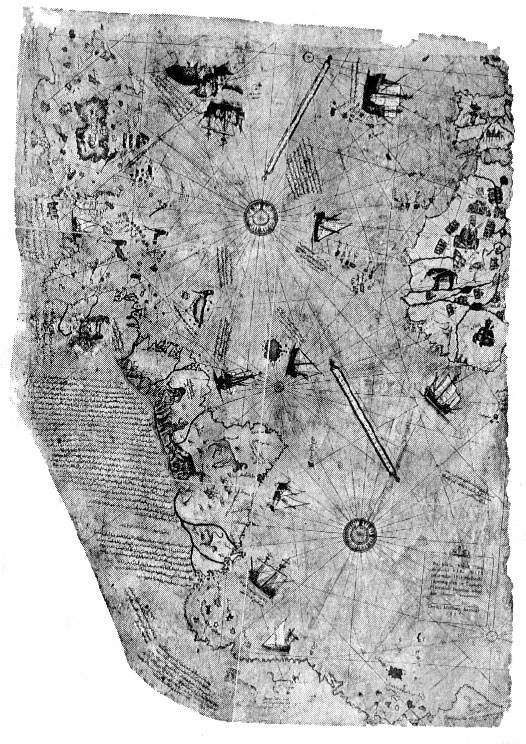
Piri Reis map (original)
Redrawing to show detail
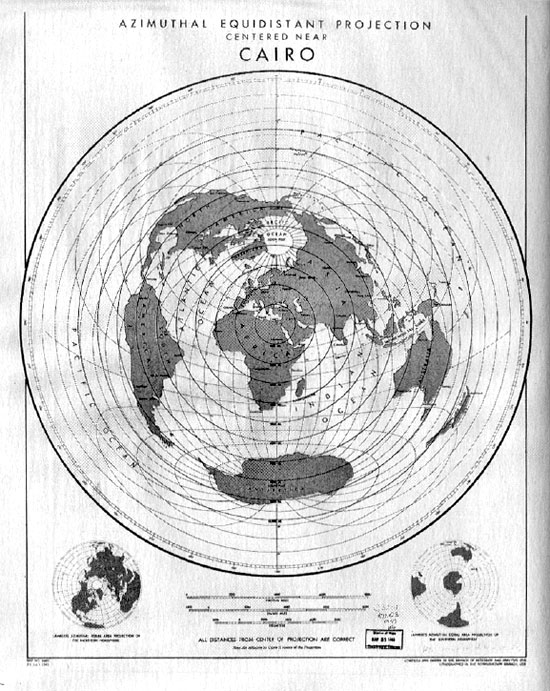
The US Airforce map shows the probable projection that governed the
layout of the ancient Piri Reis map.
From Alexandria, according to Hapgood’s reconstruction, copies of
these compilations and of some of the original source maps were
transferred to other centers of learning—notably Constantinople.
Finally, when Constantinople was seized by the Venetians during the
Fourth Crusade in 1204, the maps began to find their way into the
hands of European sailors and adventurers:
Most of these maps were of the Mediterranean and the Black Sea. But
maps of other areas survived. These included maps of the Americas
and maps of the Arctic and Antarctic Oceans. It becomes clear that
the ancient voyagers travelled from pole to pole. Unbelievable as it
may appear, the evidence nevertheless indicates that some ancient
people explored Antarctica when its coasts were free of ice. It is
clear, too, that they had an instrument of navigation for accurately
determining longitudes that was far superior to anything possessed
by the peoples of ancient, medieval or modern times until the second
half of the eighteenth century.
This evidence of a lost technology will support and give credence to
many of the other hypotheses that have been brought forward of a
lost civilization in remote times. Scholars have been able to
dismiss most of that evidence as mere myth, but here we have
evidence that cannot be dismissed. The evidence requires that all
the other evidence that has been brought forward in the past should
be re-examined
with an open mind.12
Despite a ringing endorsement from Albert Einstein (see below), and
despite the later admission of John Wright, president of the
American Geographical Society, that Hapgood had ‘posed hypotheses
that cry aloud for further testing’, no further scientific research
has ever been undertaken into these anomalous early maps.
Moreover,
far from being applauded for making a serious new contribution to
the debate about the antiquity of human civilization, Hapgood until
his death was cold-shouldered by the majority of his professional
peers, who couched their discussion of his work in what has
accurately been described as ‘thick and unwarranted sarcasm,
selecting trivia and factors not subject to verification as the
bases for condemnation, seeking in this way to avoid the basic
issues’.13
A man ahead of his time
The late Charles Hapgood taught the history of science at Keene
College, New Hampshire, USA. He wasn’t a geologist, or an ancient
historian. It is possible, however, that future generations will
remember him as the man whose work undermined the foundations of
world history—and a large chunk of world geology as well.
Albert Einstein was among the first to realize this when he took the
unprecedented step of contributing the foreword to a book Hapgood
wrote in 1953, some years before he began his investigation of
the Piri Reis Map:
I frequently receive communications from people who wish to consult
me concerning their unpublished ideas [Einstein observed]. It goes
without saying that these ideas are very seldom possessed of
scientific validity. The very first communication, however, that I
received from Mr. Hapgood electrified me. His idea is original, of
great simplicity, and—if it continues to prove itself—of great
importance to everything that is related to the history of the
earth’s surface.14
12
- Ibid.
13 -
Ibid., foreword. See also F. N. Earll, foreword to C. H. Hapgood,
Path of the Pole, Chilton Books, New York, 1970, p. viii.
14 -
From Einstein's foreword (written in 1953) to Charles H. Hapgood,
Earth's Shifting Crust: A Key to Some Basic Problems of Earth
Science, Pantheon Books, New York, 1958, pp. 1-2.
The ‘idea’ expressed in Hapgood’s 1953 book is a global geological
theory which elegantly explains how and why large parts of
Antarctica could have remained ice-free until 4000 BC, together with
many other anomalies of earth science. In brief the argument is:
1 - Antarctica was not always covered with ice and was at one time
much warmer than it is today.
2 - It was warm because it was not physically located at the South
Pole in that period. Instead it was approximately 2000 miles farther
north. This ‘would have put it outside the Antarctic Circle in a
temperate or cold temperate climate’.15
3 - The continent moved to its present position inside the Antarctic
Circle as a result of a mechanism known as ‘earth-crust
displacement’. This mechanism, in no sense to be confused with
plate-tectonics or ‘continental drift’, is one whereby the
lithosphere, the whole outer crust of the earth, ‘may be displaced
at times, moving over the soft inner body, much as the skin of an
orange, if it were loose, might shift over the inner part of the
orange all in one piece’.16
4 - During the envisaged southwards movement of Antarctica brought
about by earth-crust displacement, the continent would gradually
have grown colder, an ice-cap forming and remorselessly expanding
over several thousands of years until it attained its present
dimensions.’17
Further details of the evidence supporting these radical proposals
are set out in Part VIII of this book. Orthodox geologists, however,
remain reluctant to accept Hapgood’s theory (although none has
succeeded in proving it incorrect). It raises many questions.
Of these by far the most important is: what conceivable mechanism
would be able to exert sufficient thrust on the lithosphere to
precipitate a phenomenon of such magnitude as a crustal
displacement?
We have no better guide than Einstein to summarize Hapgood’s
findings:
In a polar region there is continual deposition of ice,
which is not symmetrically distributed about the pole. The earth’s
rotation acts on these unsymmetrically deposited masses, and
produces centrifugal momentum that is transmitted to the rigid
crust of the earth. The constantly increasing centrifugal
momentum produced in this way will, when it has reached a
certain point, produce a movement of the earth’s crust over the
rest of the earth’s body ...18
15 Maps of the Ancient Sea Kings, 1966 ed., p. 189.
16 Ibid., p. 187.
17 Ibid., p. 189.
18 Einstein's foreword to Earth's Shifting Crust, p. 1
The Piri Reis Map seems to contain surprising collateral evidence in
support of the thesis of a geologically recent glaciation of parts
of Antarctica following a sudden southward displacement of the
earth’s crust. Moreover since such a map could only have been drawn
prior to 4000 BC, its implications for the history of human
civilization are staggering. Prior to 4000 BC there are supposed to
have been no civilizations at all.
At some risk of over-simplification, the academic consensus is
broadly:
-
Civilization first developed in the Fertile Crescent of the Middle
East.
-
This development began after 4000 BC, and culminated in the
emergence of the earliest true civilizations (Sumer and
Egypt)
around 3000 BC, soon followed by the Indus Valley and China.
-
About 1500 years later, civilization took off
spontaneously and
independently in the Americas.
-
Since 3000 BC in the Old World (and about 1500 BC in the New)
civilization has steadily ‘evolved’ in the direction of ever more
refined, complex and productive forms.
-
In consequence, and particularly by comparison with ourselves, all
ancient civilizations (and all their works) are to be understood as
essentially primitive (the Sumerian astronomers regarded the heavens
with unscientific awe, and even the pyramids of Egypt were built by
‘technological primitives’).
The evidence of the Piri Reis Map appears to contradict all this.
Piri Reis and his sources
In his day, Piri Reis was a well-known figure; his historical
identity is firmly established. An admiral in the navy of the
Ottoman Turks, he was involved, often on the winning side, in
numerous sea battles around the mid-sixteenth century. He was, in
addition, considered an expert on the lands of the Mediterranean,
and was the author of a famous sailing book, the Kitabi Bahriye,
which provided a comprehensive description of the coasts, harbours,
currents, shallows, landing places, bays and straits of the Aegean
and Mediterranean Seas. Despite this illustrious career he fell foul
of his masters and was beheaded in AD 1554 or 1555.19
The source maps Piri Reis used to draw up his 1513 map were in all
probability lodged originally in the Imperial Library at
Constantinople, to which the admiral is known to have enjoyed
privileged access. Those sources (which may have been transferred or
copied from even more ancient centers of learning) no longer exist,
or, at any rate, have not been found. It was, however, in the
library of the old Imperial Palace at Constantinople that the Piri
Reis Map was rediscovered, painted on a gazelle skin and rolled up
on a dusty shelf, as recently as 1929.20
19 Maps of the Ancient Sea Kings, pp. 209-11.
20 Ibid., p. 1.
Legacy of a lost civilization?
As the baffled Ohlmeyer admitted in his letter to
Hapgood in 1960,
the Piri Reis Map depicts the subglacial topography, the true
profile of Queen Maud Land Antarctica beneath the ice. This profile
remained completely
hidden from view from 4000 BC (when the advancing ice sheet covered
it) until it was revealed again as a result of the comprehensive
seismic survey of Queen Maud Land carried out during 1949 by a joint
British-Swedish scientific reconnaissance team.21
21 Ibid., pp. 76-7 and 231-2.
If Piri Reis had been the only cartographer with access to such
anomalous information, it would be wrong to place any great weight
on his map. At the most one might say, ‘Perhaps it is significant
but, then again, perhaps it is just a coincidence.’ However, the
Turkish admiral was by no means alone in the possession of seemingly
impossible and inexplicable geographical knowledge.
It would be
futile to speculate further than Hapgood has already done as to what
‘underground stream’ could have carried and preserved such knowledge
through the ages, transmitting fragments of it from culture to
culture and from epoch to epoch. Whatever the mechanism, the fact is
that a number of other cartographers seem to have been privy to the
same curious secrets.
Is it possible that all these map-makers could have partaken,
perhaps unknowingly, in the bountiful scientific legacy of a
vanished civilization?
Back to
Contents
Chapter 2 -
Rivers in the Southern Continent
In the Christmas recess of 1959-60 Charles Hapgood was looking for
Antarctica in the Reference Room of the Library of Congress,
Washington DC. For several consecutive weeks he worked there, lost
in the search, surrounded by literally hundreds of medieval maps and
charts.
I found [he reported] many fascinating things I had not expected to
find, and a number of charts showing the southern continent. Then,
one day, I turned a page and sat transfixed. As my eyes fell upon
the southern hemisphere of a world map drawn by Oronteus Finaeus in
1531, I had the instant conviction that I had found here a truly
authentic map of the real Antarctica.
The general shape of the continent was startlingly like the outline
of the continent on our modern maps. The position of the South Pole,
nearly in the center of the continent, seemed about right. The
mountain ranges that skirted the coasts suggested the numerous
ranges that have been discovered in Antarctica in recent years. It
was obvious, too, that this was no slapdash creation of somebody’s
imagination.
The mountain ranges were individualized, some
definitely coastal and some not. From most of them rivers were shown
flowing into the sea, following in every case what looked like very
natural and very convincing drainage patterns. This suggested, of
course, that the coasts may have been ice-free when the original map
was drawn. The deep interior, however, was free entirely of rivers
and mountains, suggesting that the ice might have been present
there.1
Closer investigation of the Oronteus Finaeus Map by Hapgood, and by
Dr Richard Strachan of the Massachusetts Institute of Technology,
confirmed the following:
1 - It had been copied and compiled from several earlier source maps
drawn up according to a number of different projections.2
2 - It did indeed show non-glacial conditions in coastal regions of
Antarctica, notably Queen Maud Land, Enderby Land, Wilkes Land,
Victoria Land (the east coast of the Ross Sea), and Marie Byrd
Land.3
3 - As in the case of the Piri Reis Map, the general profile of the
terrain, and the visible physical features, matched closely seismic
survey maps of the subglacial land surfaces of Antarctica.4
1 Maps of the Ancient Sea Kings (henceforth Maps), p. 79.
2 Ibid.,
p. 233.
3 Ibid., p. 89.
4 Ibid., p. 90. These maps were made in 1958, International
Geophysical Year, by survey teams from several different nations.
The Oronteus Finaeus Map, Hapgood concluded, appeared to document,
‘the surprising proposition that Antarctica was visited and perhaps
settled by men when it was largely if not entirely non-glacial. It
goes without saying that this implies a very great antiquity ...
[Indeed] the Oronteus Finaeus Map takes the civilization of the
original map-makers back to a time contemporary with the end of the
last Ice Age in the northern hemisphere.’5

The Oronteus Finaeus map,
showing Antarctica with ice-free coasts,
mountains and rivers.
Ross Sea
Further evidence in support of this view arises from the manner in
which the Ross Sea was shown by Oronteus Finaeus. Where today great
glaciers like the Beardmore and the Scott disgorge themselves into
the sea, the 1531 map shows estuaries, broad inlets and indications
of rivers. The unmistakable implication of these features is that
there was no ice on the Ross Sea or its coasts when the source maps
used by Oronteus Finaeus were made:
‘There also had to be a
considerable hinterland free of ice to feed the rivers. At the
present time all these coasts and their hinterlands are deeply
buried in the mile-thick ice-cap, while on the Ross Sea itself there
is a floating ice-shelf hundreds of feet thick.’6
The Ross Sea evidence provides strong corroboration for the notion
that Antarctica must have been mapped by some unknown civilization
during the extensively ice-free period which ended around 4000 BC.
This is
emphasized by the coring tubes used, in 1949, by one of the
Byrd
Antarctic Expeditions to take samples of sediment from the bottom of
the Ross Sea.
The sediments showed numerous clearly demarcated
layers of stratification reflecting different environmental
conditions in different epochs:
‘coarse glacial marine’, ‘medium
glacial marine’, ‘fine glacial marine’, and so on. The most
surprising discovery, however, ‘was that a number of the layers were
formed of fine-grained, well-assorted sediments, such as are brought
down to the sea by rivers flowing from temperate (that is, ice-free)
lands ...’7
Using the ionium-dating method developed by
Dr W. D. Urry (which
makes use of three different radioactive elements found in sea
water8), researchers at the Carnegie Institute in Washington DC were
able to establish beyond any reasonable doubt that great rivers
carrying fine-grained well-assorted sediments had indeed flowed in
Antarctica until about 6000 years ago, as the Oronteus Finaeus Map
showed.
It was only after that date, around 4000 BC,
‘that the
glacial kind of sediment began to be deposited on the Ross Sea
bottom ... The cores indicate that warm conditions had prevailed for
a long period before that.’9
5 Ibid., p. 149.
6 Ibid., p. 93-6.
7 Ibid., p. 97.
8 For a detailed description of the process see Maps, P. 96.
9
Ibid., page 98.
Mercator and Buache
The Piri Reis and Oronteus Finaeus Maps therefore provide us with a
glimpse of
Antarctica as no cartographer in historical times could
possibly have seen it. On their own, of course, these two pieces of
evidence should not be sufficient to persuade us that we might be
gazing at the fingerprints of a lost civilization.
Can three, or
four, or six such maps, however, be dismissed with equal
justification?
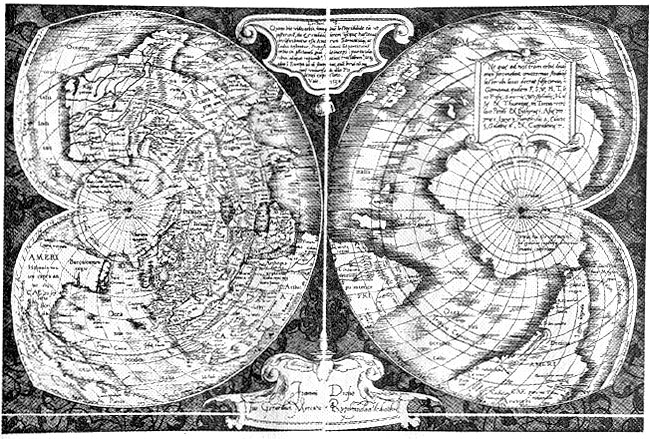
The Mercator map,
showing Antarctica’s mountains and rivers covered
by ice.
Is it safe, or reasonable, for example, for us to continue to ignore
the historical implications of some of the maps made by the
sixteenth-century’s most famous cartographer: Gerard Kremer,
otherwise known as Mercator? Best remembered for the Mercator
projection, still used on most world maps today, this enigmatic
individual (who paid an unexplained visit to the Great Pyramid of
Egypt in 156310) was reportedly ‘indefatigable in searching out ...
the learning of long ago’, and spent many years diligently
accumulating a vast and eclectic reference library of ancient source
maps.11
10
He left his graffito there. See Peter Tompkins, Secrets of the Great
Pyramid, Harper & Row Publishers, New York, p. 38, 285.
11 Maps, p.
102.
Significantly, Mercator included the Oronteus Finaeus map in his
Atlas of 1569 and also depicted the Antarctic on several he himself
drew in the same year.
Identifiable parts of the then undiscovered
southern continent on these maps are:
-
Cape Dart and Cape Herlacher in
Marie Byrd Land
-
the Amundsen Sea
-
Thurston Island in Ellsworth
Land
-
the Fletcher Islands in the Bellinghausen Sea
-
Alexander I
Island
-
the Antarctic (Palmer) Peninsula
-
the Weddell Sea, Cape Norvegia
-
the Regula Range in Queen Maud Land (as islands)
-
the Muhlig-Hoffman Mountains (as islands)
-
the Prince Harald Coast
-
the Shirase Glacier as an estuary on Prince Harald Coast
-
Padda Island
in Lutzow-Holm Bay
-
the Prince Olaf Coast in Enderby Land
‘In
some cases these features are more distinctly recognizable than on
the Oronteus Finaeus Map,’ observed Hapgood, ‘and it seems clear, in
general, that Mercator had at his disposal source
maps other than those used by Oronteus Finaeus.’12
And not only Mercator.
Philippe Buache, the eighteenth-century French geographer, was also
able to publish a map of Antarctica long before the southern
continent was officially ‘discovered’. And the extraordinary feature
of Buache’s map is that it seems to have been based on source maps
made earlier, perhaps thousands of years earlier, than those used by
Oronteus Finaeus and Mercator.
What Buache gives us is an eerily
precise representation of Antarctica as it must have looked when
there was no ice on it at all.13 His map reveals the subglacial
topography of the entire continent, which even we did not have full
knowledge of until 1958, International Geophysical Year, when a
comprehensive seismic survey was carried out.
12 Ibid., pp. 103-4.
13 Ibid., p. 93.
That survey only confirmed what Buache had already proclaimed when
he published his map of Antarctica in 1737. Basing his cartography
on ancient sources now lost, the French academician depicted a clear
waterway across the southern continent dividing it into two
principal landmasses lying east and west of the line now marked by
the Trans-Antarctic Mountains.
Such a waterway, connecting the Ross, Weddell and Bellinghausen
Seas, would indeed exist if Antarctica were free of ice. As the 1958 IGY Survey shows, the continent (which appears on modern maps as one
continuous landmass) consists of an archipelago of large islands
with mile-thick ice packed between them and rising above sea level.
The epoch of the map-makers
As we have seen, many orthodox geologists believe that the last time
any waterway existed in these ice-filled basins was millions of
years ago. From the scholarly point of view, however, it is equally
orthodox to affirm that no human beings had evolved in those remote
times, let alone human beings capable of accurately mapping the
landmasses of the Antarctic.
The big problem raised by the Buache/IGY
evidence is that those landmasses do seem to have been mapped when
they were free of ice.

The Buache map,
with landmasses which show Antarctica very much as
it would have looked before it became covered by ice.
This confronts scholars with two
mutually contradictory propositions.
Which one is correct?
If we are to go along with orthodox geologists and accept that
millions of years have indeed elapsed since Antarctica was last
completely free of ice, then all the evidence of human evolution,
painstakingly accumulated by distinguished scientists from Darwin
on, must be wrong. It seems inconceivable that this could be the
case: the fossil record makes it abundantly clear that only the unevolved ancestors of humanity existed millions of years
ago—low-browed knuckle-dragging hominids incapable of advanced
intellectual tasks like map-making.
Are we therefore to assume the intervention of alien cartographers
in orbiting spaceships to explain the existence of sophisticated
maps of an ice-free Antarctica? Or shall we think again about the
implications of Hapgood’s theory of earth-crust displacement which
allows the southern continent to have been in the ice-free condition
depicted by Buache as little as 15,000 years ago?14
14 For a fuller discussion of the evidence behind this theory see
Part VIII of this book and Hapgood's Earth's Shifting Crust.
Above left and right: Redrawings of the Mercator and Oronteus Finaeus
maps showing the progressive glaciation of Antarctica.
Below left:
Redrawing of the Buache map.
Below right: The subglacial topography
of Antarctica, according to modern seismic surveys.
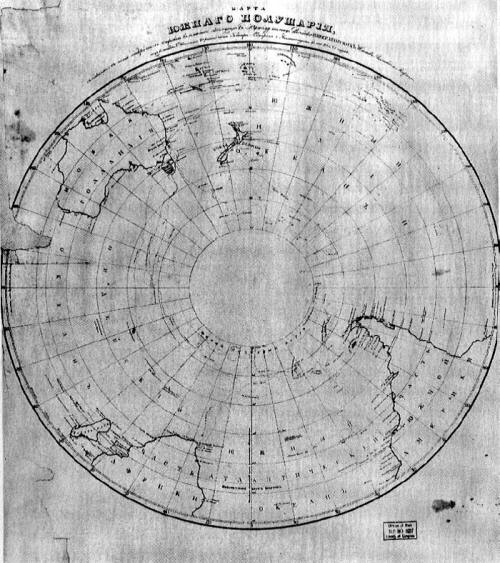
An early nineteenth-century Russian map showing that the existence
of Antarctica was at that time unknown. The continent was
‘discovered’ in AD 1818. But could it have been mapped thousands of
years earlier than that by the cartographers of an as yet
unidentified high civilization of prehistory?
Is it possible that a human civilization, sufficiently advanced to
have mapped Antarctica, could have developed by 13,000 BC and later
disappeared? And, if so, how much later?
The combined effect of the Piri Reis, Oronteus Finaeus, Mercator and
Buache Maps is the strong, though disturbing, impression that
Antarctica may have been continuously surveyed over a period of
several thousands of years as the ice-cap gradually spread outwards
from the interior, increasing its grip with every passing millennium
but not engulfing all the coasts of the southern continent until
around 4000 BC.
The original sources for the Piri Reis and
Mercator
Maps must therefore have been prepared towards the end of this
period, when only the coasts of Antarctica were free of ice; the
source for the Oronteus Finaeus Map, on the other hand, seems to
have been considerably earlier, when the icecap was present only in
the deep interior of the continent; and the source for the Buache
Map appears to originate in even earlier period (around 13,000 BC),
when there may have been no ice in Antarctica at all.
South America
Were other parts of the world surveyed and accurately charted at
widely separated intervals during this same epoch; roughly from
13,000 BC to 4000 BC? The answer may lie once again in the Piri Reis
Map, which contains more mysteries than just Antarctica:
Drawn in 1513, the map demonstrates an uncanny knowledge of South
America—and not only of its eastern coast but of the Andes mountains
on the western side of the continent, which were of course unknown
at that time. The map correctly shows the Amazon River rising in
these unexplored mountains and thence flowing eastwards.15
Itself compiled from more than twenty different source documents of
varying antiquity,16 the Piri Reis Map depicts
the Amazon not once
but twice (most probably as a result of the unintentional
overlapping of two of the source documents used by the Turkish
admiral17). In the first of these the Amazon’s course is shown down
to its Para River mouth, but the important island of Marajo does not
appear.
According to Hapgood, this suggests that the relevant source
map must have dated from a time, perhaps as much as 15,000 years
ago, when the Para River was the main or only mouth of the Amazon
and when Marajo Island was part of the mainland on the northern side
of the river.18
The second depiction of the Amazon, on the other
hand, does show Marajo (and in fantastically accurate detail)
despite the fact that this island was not discovered until 1543.19
Again, the possibility is raised of an unknown civilization which
undertook continuous surveying and mapping operations of the
changing face of the earth over a period of many thousands of years,
with Piri Reis making use of earlier and later source maps left
behind by this civilization.
15 Maps, p. 68.
16 Ibid., p. 222.
17 Ibid., pp. 64-5.
18 Ibid., p.
64.
19 Ibid., p. 65.
Neither the Orinoco River nor its present delta is represented on
the Piri Reis Map. Instead, as Hapgood proved,
‘two estuaries
extending far inland (for a distance of about 100 miles) are shown
close to the site of the present river. The longitude on the grid
would be correct for the
Orinoco, and the latitude is also quite accurate. Is it possible
that these estuaries have been filled in, and the delta extended
this much, since the source maps were made?’20
Although they remained undiscovered until 1592, the
Falkland Islands
appear on the 1513 map at their correct latitude.21
The library of ancient sources incorporated in the
Piri Reis Map may
also account for the fact that it convincingly portrays a large
island in the Atlantic Ocean to the east of the South American coast
where no such island now exists.
Is it pure coincidence that this
‘imaginary ’ island turns out to be located right over the
sub-oceanic Mid-Atlantic Ridge just north of the equator and 700
miles east of the coast of Brazil, where the tiny Rocks of Sts.
Peter and Paul now jut above the waves?22 Or was the relevant source
map drawn deep in the last Ice Age, when sea levels were far lower
than they are today and a large island could indeed have been
exposed at this spot?
20 Ibid., p. 69.
21 Ibid., p. 72.
22 Ibid., p. 65.
Sea levels and ice ages
Other sixteenth-century maps also look as though they could have
been based on accurate world surveys conducted during the last Ice
Age. One was compiled by the Turk Hadji Ahmed in 1559, a
cartographer, as Hapgood puts it, who must have had access to some
‘most extraordinary’ source maps.23
The strangest and most immediately striking feature of Hadji Ahmed’s
compilation is that it shows quite plainly a strip of territory,
almost 1000 miles wide, connecting Alaska and Siberia. Such a
‘land-bridge’, as geologists refer to it, did once exist (where the
Bering Strait is now) but was submerged beneath the waves by rising
sea levels at the end of the last Ice Age.24
The rising sea levels were caused by the tumultuous melting of the
icecap which was rapidly retreating everywhere in the northern
hemisphere by around 10,000 BC.25 It is therefore interesting that
at least one ancient map appears to show southern Sweden covered
with remnant glaciers of the kind that must indeed have been
prevalent then in these latitudes.
The remnant glaciers are on
Claudius Ptolemy’s famous Map of the North. Originally compiled in
the second century AD, this remarkable work from the last great
geographer of classical antiquity was lost for hundreds of
years and rediscovered in the fifteenth century.26
23 Ibid., p. 99.
24 Ibid.
25 Ibid., p. 164.
26 Ibid., p. 159.
Ptolemy was custodian of the library at Alexandria, which contained
the greatest manuscript collection of ancient times,27 and it was
there that he consulted the archaic source documents that enabled
him to compile his own map.28 Acceptance of the possibility that the
original version of at least one of the charts he referred to could
have been made around 10,000 BC helps us to explain why he shows
glaciers, characteristic of that exact epoch, together with ‘lakes
... suggesting the shapes of present-day lakes, and streams very
much suggesting glacial streams ... flowing from the glaciers into
the lakes.’29
It is probably unnecessary to add that no one on earth in Roman
times, when Ptolemy drew his map, had the slightest suspicion that
ice ages could once have existed in northern Europe. Nor did anyone
in the fifteenth century (when the map was rediscovered) possess
such knowledge. Indeed, it is impossible to see how the remnant
glaciers and other features shown on Ptolemy’s map could have been
surveyed, imagined or invented by any known civilization prior to
our own.
The implications of this are obvious. So, too, are the implications
of another map, the ‘Portolano’ of Iehudi Ibn Ben Zara, drawn in the
year 1487.30 This chart of Europe and North Africa may have been
based on a source even earlier than Ptolemy’s, for it seems to show
glaciers much farther south than Sweden (roughly on the same
latitude as England in fact)31 and to depict the Mediterranean,
Adriatic and Aegean Seas as they might have looked before the
melting of the European ice-cap.32
Sea level would, of course, have
been significantly lower than it is today. It is therefore
interesting, in the case for instance of the Aegean section of the
map, to note that a great many more islands are shown than currently
exist.33 At first sight this seems odd. However, if ten or twelve
thousand years have indeed elapsed since the era when Ibn Ben Zara’s
source map was made, the discrepancy can be simply explained: the
missing islands
must have been submerged by rising sea levels at the end of the last
Ice Age.
27 See Luciano Canfora, The Vanished Library, Hutchinson Radius,
London, 1989
28 Maps, p. 159.
29 Ibid., p. 164.
30 Ibid., p. 171
31 Ibid., pp. 171-2.
32 Ibid.
33 Ibid., pp. 176-7.
Once again we seem to be looking at the fingerprints of a vanished
civilization—one capable of drawing impressively accurate maps of
widely separated parts of the earth.
What kind of technology, and what state of science and culture,
would have been required to do a job like that?
Back to
Contents
Chapter 3 -
Fingerprints of a Lost Science
We saw that the Mercator World Map of 1569 included an accurate
portrayal of the coasts of Antarctica as they would have looked
thousands of years ago when they were free of ice. Interestingly
enough, this same map is considerably less accurate in its portrayal
of another region, the west coast of South America, than an earlier
(1538) map also drawn by Mercator.1
The reason for this appears to be that the sixteenth-century
geographer based the earlier map on the ancient sources which we
know he had at his disposal, whereas for the later map he relied
upon the observations and measurements of the first Spanish
explorers of western South America.
Since those explorers had
supposedly brought the latest information back to Europe, Mercator
can hardly be blamed for following them. In so doing the accuracy of
his work declined: instruments capable of finding longitude did not
exist in 1569, but appear to have been used to prepare the ancient
source documents Mercator consulted to produce his 1538 map.2
1 Maps, p. 107.
2 Ibid.
The mysteries of longitude
Let us consider the problem of longitude, defined as the distance in
degrees east or west of the prime meridian. The current
internationally accepted prime meridian is an imaginary curve drawn
from the North Pole to the South Pole passing through the Royal
Observatory at Greenwich, London. Greenwich therefore stands at
0°
longitude while New York, for example, stands at around 74° west,
and Canberra, Australia, at roughly 150° east.
It would be possible to write an elaborate explanation of longitude
and of what needs to be done to fix it precisely for any given point
on the earth’s surface. What we are concerned with here, however, is
not so much technical detail as the accepted historical facts about
humanity’s growing knowledge of the mysteries of longitude.
Among
these facts, this is the most important: until a breakthrough
invention in the eighteenth century, cartographers and navigators
were unable to fix longitude with any kind of precision. They could
only make guesses which were usually inaccurate by many hundreds of
miles, because the technology had not yet been developed to allow
them to do the job properly.
Latitude north or south of the equator did not pose such a problem:
it could be worked out by means of angular measurements of the sun
and stars taken with relatively simple instruments. But to find
longitude equipment of an altogether different and superior calibre
was needed, which could combine position measurements with time
measurements.
Throughout the span of known history the invention of
such equipment had remained beyond the capacities of scientists, but
by the beginning of the eighteenth century, with rapidly increasing
sea traffic, a mood of impatience and urgency had set in. In the
words of an authority on the period,
‘The search for longitude
overshadowed the life of every man afloat, and the safety of every
ship and cargo. Accurate measurement seemed an impossible dream and
“discovering the longitude” had become a stock phrase in the press
like “pigs might fly”.’3
3
Simon Bethon and Andrew Robinson, The Shape of the World: The
Mapping and Discovery of the Earth, Guild Publishing, London, 1991,
p. 117.
What was needed, above all else, was an instrument that would keep
the time (at the place of departure) with perfect accuracy during
long sea journeys despite the motion of the ship and despite the
adverse conditions of alternating heat and cold, wet and dry. ‘Such
a Watch’, as Isaac Newton told the members of the British
government’s official Board of Longitude in 1714, ‘hath not yet been
made’.4
Indeed not. The timepieces of the seventeenth and early eighteenth
centuries were crude devices which typically lost or gained as much
as a quarter of an hour per day. By contrast, an effective marine
chronometer could afford to lose or gain that much only over several
years.5
It was not until the 1720s that the talented English clockmaker John
Harrison began work on the first of a series of designs which
resulted in the manufacture of such a chronometer. His objective was
to win the prize of £20,000 offered by the Board of Longitude ‘for
the inventor of any means of determining a ship’s longitude within
30 nautical miles at the end of a six weeks’ voyage’.6
A chronometer
capable of fulfilling this condition would have to keep time to
within three seconds per day. It took almost forty years, during
which several prototypes were completed and tested, before Harrison
was able to meet these standards. Finally, in 1761, his elegant
Chronometer No. 4 left Britain on board HMS Deptford bound for
Jamaica, accompanied by Harrison’s son William.
Nine days into the
voyage, on the basis of longitude calculations made possible by the
chronometer, William advised the captain that they would sight the
Madeira Islands the following morning. The captain offered five to
one that he was wrong but agreed to hold the course. William won the
bet. Two months later, at Jamaica, the instrument was found to have
lost just five seconds.7
Harrison had surpassed the conditions set by the Board of Longitude.
Thanks to the British government’s bureaucratic dithering, however,
he was not awarded the £20,000 prize money until three years before
his death in 1776. Understandably, it was only when he had the funds
in his hands that he divulged the secrets of his design. As a result
of this delay, Captain James Cook did not have the benefit of a
chronometer when he made his first voyage of discovery in 1768.8
By
the time of his third voyage, however (1778-9), he was able to map
the Pacific with impressive accuracy, fixing not only the correct
latitude but the correct longitude of every island and coastline.9
4 Ibid., p. 121.
5 Ibid., p. 120.
6 Encyclopaedia Britannica, 1991, 3:289.
7 Shape of the World, pp.
123-4.
8 Ibid., p. 125.
9 Ibid., p. 131.
Henceforward, ‘thanks to Cook’s care and Harrison’s chronometer ...
no navigator could have an excuse for failing to find a Pacific
island ... or for being wrecked on a coastline appearing
from nowhere.’10
Indeed, with their accurate longitudes, Cook’s Pacific maps must be
ranked among the very first examples of the precise cartography of
our modern era. They remind us, moreover, that the making of really
good maps requires at least three key ingredients: great journeys of
discovery; first-class mathematical and cartographic skills;
sophisticated chronometers.
It was not until Harrison’s chronometer became generally available
in the 1770s that the third of these preconditions was fulfilled.
This brilliant invention made it possible for cartographers to fix
longitude precisely, something that the Sumerians, the Ancient
Egyptians, the Greeks and the Romans, and indeed all other known
civilizations before the eighteenth century were supposedly unable
to do. It is therefore surprising and unsettling to come across
vastly older maps which give latitudes and longitudes with modern
precision.
Precision instruments
These inexplicably precise latitudes and longitudes are found in the
same general category of documents that contain the advanced
geographical knowledge I have outlined.
The Piri Reis Map of 1513, for example, places South America and
Africa in the correct relative longitudes,11 theoretically an
impossible feat for the science of the time. But Piri Reis was
candid in admitting that his map was based on far earlier sources.
Could it have been from one of these sources that he derived his
accurate longitudes?
Also of great interest is the so-called ‘Dulcert Portulano’ of AD
1339 which focuses on Europe and North Africa. Here latitude is
perfect across huge distances and the total longitude of the
Mediterranean and Black Seas is correct to within half a degree.12
Professor Hapgood comments that the maker of the original source
from which the Dulcert Portulano was copied had,
‘achieved highly
scientific accuracy in finding the ratio of latitude to longitude.
He could only have done this if he had precise information on the
relative longitudes of a great many places scattered all the way
from Galway in Ireland to the eastern bend of the Don in Russia.’13
The Zeno Map14 of AD 1380 is another enigma. Covering a vast area of
the north as far as Greenland, it locates a great many widely
scattered places at latitudes and longitudes which are ‘amazingly
correct’.15
10 Ibid.
11 Maps, pp. 1, 41.
12 Ibid., p. 116.
13 Ibid.
14 Ibid., pp. 149-58.
15 Ibid, p. 152.
It is
‘unbelievable’, asserts Hapgood, ‘that anyone in the fourteenth
century could have found accurate latitudes for these places, to say
nothing of accurate longitudes’.16
The Oronteus Finaeus World Map also commands attention: it
successfully places the coasts of Antarctica in correct latitudes
and relative longitudes and finds a remarkably accurate area for the
continent as a whole. This reflects a level of geographical
knowledge not available until the twentieth century.17
The Portolano of lehudi Ibn Ben Zara is another map notable for its
accuracy where relative latitudes and longitudes are concerned.18
Total longitude between Gibraltar and the Sea of Azov is accurate to
half a degree, while across the map as a whole average errors of
longitude are less than a degree.19
16 Ibid.
17 Ibid., p. 98.
18 Ibid., p. 170.
19 Ibid., p. 173.
These examples represent only a small fraction of the large and
challenging dossier of evidence presented by Hapgood. Layer upon
layer, the cumulative effect of his painstaking and detailed
analysis is to suggest that we are deluding ourselves when we
suppose that accurate instruments for measuring longitude were not
invented until the eighteenth century.
On the contrary, the Piri
Reis and other maps appear to indicate very strongly that such
instruments were re-discovered then, that they had existed long ages
before and had been used by a civilized people, now lost to history,
who had explored and charted the entire earth. Furthermore, it seems
that these people were capable not only of designing and
manufacturing precise and technically advanced mechanical
instruments but were masters of a precocious mathematical science.
The lost mathematicians
To understand why, we should first remind ourselves of the obvious:
the earth is a sphere. When it comes to mapping it, therefore, only
a globe can represent it in correct proportion. Transferring
cartographic data from a globe to flat sheets of paper inevitably
involves distortions and can be accomplished only by means of an
artificial and complex mechanical and mathematical device known as
map projection.
There are many different kinds of projection. Mercator’s, still used
in atlases today, is perhaps the most familiar. Others are
dauntingly referred to as Azimuthal, Stereographic, Gnomonic,
Azimuthal Equidistant, Cordiform, and so on, but it is unnecessary
to go into this any further here.
We need only note that all
successful projections require
the use of sophisticated mathematical techniques of a kind
supposedly unknown in the ancient world20 (particularly in the
deepest antiquity before 4000 BC when there was allegedly no human
civilization at all, let alone one capable of developing and using
advanced mathematics and geometry).
Charles Hapgood submitted his collection of ancient maps to the
Massachusetts Institute of Technology for evaluation by Professor
Richard Strachan. The general conclusion was obvious, but he wanted
to know precisely what level of mathematics would have been required
to draw up the original source documents. On 18 April 1965 Strachan
replied that a very high level of mathematics indeed would have been
necessary.
Some of the maps, for example, seemed to express ‘a Mercator type projection’ long before the time of Mercator himself.
The relative complexity of this projection (involving latitude
expansion) meant that a trigonometric coordinate transformation
method must have been used.
Other reasons for deducing that the ancient map-makers must have
been skilled mathematicians were as follows:
1 - The determination of
place locations on a continent requires at least geometric
triangulation methods. Over large distances (of the order of 1000
miles) corrections must be made for the curvature of the earth,
which requires some understanding of spherical trigonometry.
2 - The
location of continents with respect to one another requires an
understanding of the earth’s sphericity, and the use of spherical
trigonometry.
3 - Cultures with this knowledge, plus the precision
instruments to make the required measurements to determine location,
would most certainly use their mathematical technology in creating
maps and charts.’21
20 Ibid., p. 225ff.
21 Ibid., p. 228.
Strachan’s impression that the maps, through generations of
copyists, revealed the handiwork of an ancient, mysterious and
technologically advanced civilization, was shared by reconnaissance
experts from the US Airforce to whom Hapgood submitted the evidence.
Lorenzo Burroughs, chief of the 8th Reconnaissance Technical
Squadron’s Cartographic Section at Westover Air Base, made a
particularly close study of the Oronteus Finaeus Map.
He concluded
that some of the sources upon which it was based must have been
drawn up by means of a projection similar to the modern Cordiform
Projection.
This, said Burroughs:
suggests the use of advanced mathematics. Further, the shape given
to the Antarctic Continent suggests the possibility, if not the
probability, that the original source maps were compiled on a
stereographic or gnomonic type of projection involving the use of
spherical trigonometry.
We are convinced that the findings made by you and your associates
are valid, and that they raise extremely important questions
affecting geology and ancient
history ...’22
Hapgood was to make one more important discovery: a Chinese map
copied from an earlier original on to a stone pillar in AD 1137.23
This map incorporates precisely the same kind of high quality
information about longitudes as the others. It has a similar grid
and was drawn up with the benefit of spherical trigonometry. Indeed,
on close examination, it shares so many features with the European
and Middle Eastern maps that only one explanation seems adequate: it
and they must have stemmed from a
common source.24
We seem to be confronted once again by a surviving fragment of the
scientific knowledge of a lost civilization. More than that, it
appears that this civilization must have been at least in some
respects as advanced as our own and that its cartographers had
‘mapped virtually the entire globe with a uniform general level of
technology, with similar methods, equal knowledge of mathematics,
and probably the same sorts of instruments’.25
22 Ibid., pp. 244-5.
23 Ibid., p. 135.
24 Ibid., p. 139.
25 Ibid.,
pp. 139, 145.
The Chinese map also indicates something else: a global legacy must
have been handed down—a legacy of inestimable value, in all
probability incorporating much more than sophisticated geographical
knowledge.
Could it have been some portion of this legacy that was distributed
in prehistoric Peru by the so-called ‘Viracochas’, mysterious
bearded strangers said to have come from across the seas, in a ‘time
of darkness’, to restore civilization after a great upheaval of the
earth?
I decided to go to Peru to see what I could find.
Back to
Contents
or
Continue to
Chapter 4
→
|
