|
Saturn
As seen in Figure 27, Saturn displays a quasi-stationary, highly geometric,
multi-tiered linear cloud pattern -- arranged in the shape of a perfect
hexagon -- centered precisely over its northern polar region. This
remarkable formation (the clouds within this geometric pattern continually
race backwards, against Saturn’s eastward spin) was first discovered by
time-lapse imaging from the Voyager unmanned missions, in 1980-1981. The
apparent “upper atmosphere, standing wave pattern” has remained stable and
visible for at least 15 years, “suggesting [it is] a long-lived feature
apparently insensitive to the strong seasonal forcing in Saturn’s
polar
regions.”
The hexagonal wave-structure is thus “conjectured to be deeply-rooted
in Saturn’s interior.” This provides powerful geometric support for an
ongoing, interior hyperdimensional energy flow through Saturn -- which, in
turn, creates a high-altitude, resonant, hexagonal (embedded tetrahedral)
atmospheric pattern around its northern rotational axis.[82]
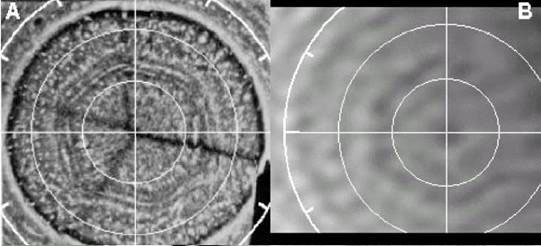
Figure 27 - Saturn’s North Polar Hexagon: as seen (A) by the Voyager
spacecraft in 1980
(resolution -- 566 nm; from Godfrey 1988) and (B) with the HST in July 1991
(resolution -- 656 nm).
In the space immediately surrounding
Saturn, the planet’s own tube-shaped (toroidal)
cloud of plasma energy (similar to that lying along the orbit of
Jupiter’s
moon, Io) became 1000% denser than expected between 1981 and 1993… truly a
stunning change for only twelve years’ time, exactly like the energetic
increases we are seeing with Jupiter.[83] We do know that this cloud is
closely aligned with the orbit of Saturn’s moon,
Enceladus. Unfortunately,
we have not been able to locate any images of this stunning, rapidly-changing
cloud formation.
And, though Saturn was approached three times previously --
by Pioneer II (in 1979) and Voyagers 1 and
2 (in 1980 and 1981, respectively)
-- it wasn’t until 1995 that a bright aurora was photographed around
Saturn’s poles by the Hubble Space Telescope, an
aurora capable of “rapid
changes in its brightness in short periods of time.”[84] This is not
conclusive proof that the Saturn aurorae are a new phenomenon, but it
certainly is another potential point of interest that correlates well with
the over 1000% increase in the density of Saturn’s plasma torus. Below
(Figure 28) is a Hubble image of the brilliant aurorae from 1998.
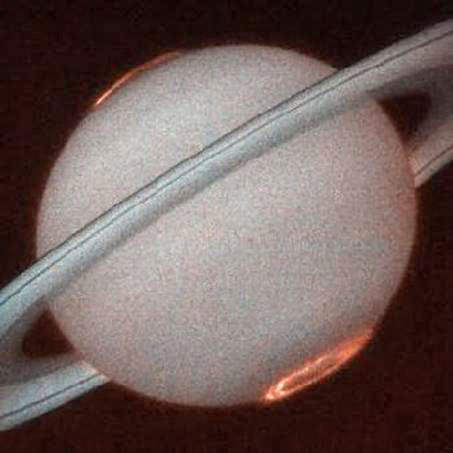
Figure 28 – Saturn aurorae imaged at both poles by HST in 1998 (NASA)
Between 1980 and 1996, the
speed of rotation for Saturn’s clouds at the
equator reduced by a whopping 58.2 percent, described as an “unexpected and
dramatic change in weather.” The NASA explanation offered for this
definitely anomalous behavior, however, was that old standby -- “seasonal
changes”:
WELLESLEY, Mass. - Saturn, one of the windiest planets, has recently had an
unexpected and dramatic change in weather: its equatorial winds have
subsided from a rapid 1700 km/hr during the Voyager spacecraft flybys in
1980-81 to a modest 990 km/hr from 1996 to 2002. This slow-down in the winds
has been detected by a Spanish-American team of scientists, including
Richard French of Wellesley College in Massachusetts, who report their
findings in the June 5 issue of the journal, Nature. (5 June 2003, Vol. 423,
pp. 623-625)…
Using the high-resolution capability of the
Wide Field Planetary Camera
onboard the HST, the Spanish-American team has been able to track enough
cloud elements in Saturn to measure the wind velocity over a broad range of
latitudes. The equatorial winds measured in 1996-2001 are only half as
strong as was found in 1980-81, when the Voyager spacecraft visited the
planet. In contrast, the windy jets far from the equator have remained
stable and show a strong hemispheric symmetry not found in Jupiter.
The different behavior of Saturn’s winds could have a simple explanation,
note the scientists. The long seasonal cycle in Saturn’s atmosphere (one
Saturn year is about thirty terrestrial years) and the equatorial shadowing
by the planet’s giant rings could account for the sudden slowdown in the
equatorial winds [emphasis added]….[85]
Even more provocative changes in
Saturn were detected by non-optical
telescopic data….
“Massive,” highly anomalous emissions of x-rays from Saturn’s equatorial
region (Figure 29) -- as opposed to x-rays accompanying the polar aurorae as
expected -- were detected and localized to Saturn’s equator for the first
time in 2004, by NASA’s Chandra X-Ray Observatory, operating in Earth
orbit.[86] Though the left image appears to show another “Great Spot”
similar to the one on Jupiter, this is actually a time-lapse image --
spanning more than one ~10-hour Saturnian rotation (actually, about ~20
hours total)!
So, the concentration of brightness here is NOT due to any
“Great Saturn Spot,” but is due to geometric factors of the x-ray image
acquisition process itself. The brightest x-rays are emerging from all along
the equatorial plane, not just in any one area.
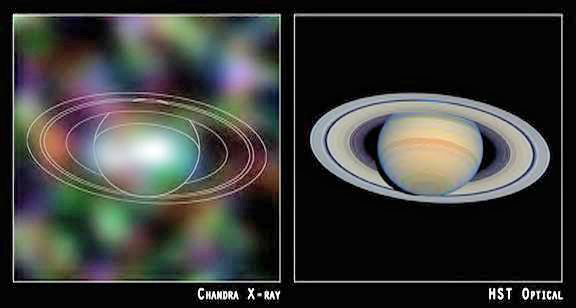
Figure 29 - Chandra X-Ray image of Saturn (left), compared with Hubble
visual image (right). Note concentration of x-ray emission from Saturn’s
equatorial atmosphere, below the sunlit plane of the rings (NASA)
NASA scientists have had to confront equally dramatic changes that also
seemed to be occurring in Saturn’s most well-known and illustrious feature
-- its stunning planetary rings .…
Curious, linear dark features… termed “spoke” formations (Figure 30)… were
first observed lying across the rings during the previously mentioned
Voyager robotic flybys in 1980-1981. Their most anomalous characteristic:
the spokes revolved in distinct “non-Keplerian” fashion -- with the outer
sections of the narrow, inexplicably radial formations racing around Saturn
much faster than the underlying ring particles can orbit under gravitational
attraction… at the same distance from the giant planet.[87]
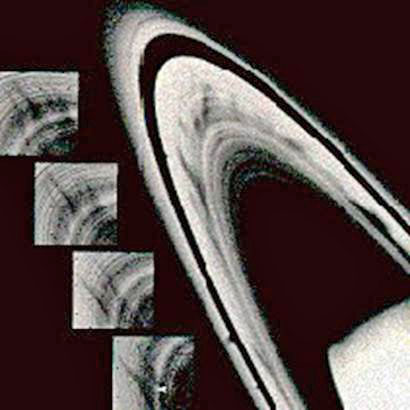
Figure 30 - Composite Image of “Spoke” Formations Observed by Voyager in
1980-81 (NASA)
In December of 2003, planetary scientists working the
Cassini mission -- the
first new spacecraft to return to Saturn since the ‘80’s Voyager visitations
-- eagerly anticipated learning more about these remarkable radial
formations -- this time, via extreme close-ups, acquired with a CCD Cassini
imaging system fully 100 times better than Voyager’s “primitive” vidicon
cameras.[88] How would they look? What new things could they teach us? How
did they get there? Why do they exist in the first place?
However, by February 2004, the problem could no longer be ignored… the
Cassini imaging team was forced to acknowledge that, mysteriously, the
spokes -- despite far superior imaging, taken at closer distances than
Voyager’s discovery observations (Figure 30) -- were no longer visible.[89]
They, quite literally, just disappeared! Hence, “something” in Saturn’s
formidable rings also has changed… dramatically… in just two decades, just
like the other changes we are seeing on Saturn and throughout the solar
system.
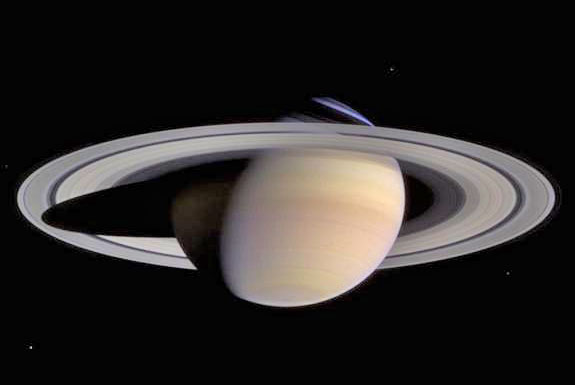
Figure 31 – Saturn as breathtakingly imaged by the approaching Cassini
spacecraft.
And… nary a “spoke” to be seen. (NASA)
Turning to some of Saturn’s major satellites:
Chandra x-ray observations of Saturn’s largest moon,
Titan, produced a major
surprise: Titan appears to have had a 10-15% increase in the height of its
atmosphere, as of January 2003 (Figure 32). According to the official
NASA
release:
“On January 5, 2003,
Titan -- Saturn’s largest moon and the only moon in the
solar system with a thick atmosphere -- crossed in front of the Crab Nebula…
The diameter of Titan’s shadow was found to be larger than the known
diameter of its solid surface. This difference in diameters yields a
measurement of about 550 miles (880 kilometers) for the height of the X-ray
absorbing region of Titan’s atmosphere.
The extent of the upper atmosphere is consistent with, or slightly (10-15%)
larger, than that implied by Voyager I observations made at radio, infrared
and ultraviolet wavelengths in 1980. Saturn was about 5% closer to the Sun
in 2003, so increased solar heating of Titan may have caused its atmosphere
to expand.”[90]
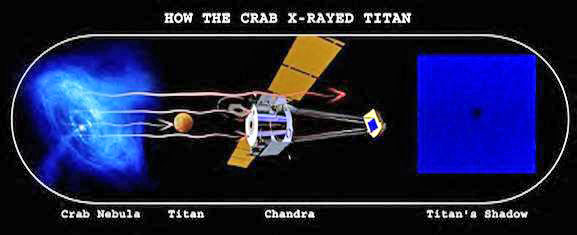
Figure 32 – Chandra X-ray Telescope captures x-ray shadow of Titan,
measuring its diameter, as Saturn’s largest satellite crosses in front of
the Crab Nebula – a shattered stellar remnant nebula emitting copious
x-rays, located approximately 6000 light years beyond Saturn. (NASA)
However, if NASA’s more conservative estimates of
Titan’s former atmospheric
depth (250 miles -- from Voyager observations in 1981) were correct,[91]
then Titan’s total atmosphere may have actually expanded by as much as 200%…
in just the last 23 years… from 250 to 550 miles in height!
In Titan’s atmosphere itself, optical and infrared observations carried out
with the 10-meter Keck telescopes in Hawaii have imaged fast-moving, bright
methane clouds in Titan’s southern hemisphere -- which are equally
inexplicable in mainstream models. According to a recent paper in Nature:
The December 2001 cloud has a brightness equivalent to about 0.3% of the
total brightness of the disk of Titan at these wavelengths, and can be
explained by a single (foreshortened) cloud of 200 km diameter or smaller
clouds within the same total area. The 28 February 2002 cloud is
significantly larger, reflecting a flux equivalent to about 1% of the total
flux of Titan…
The most striking property of these transient cloud events is their
unexpected concentration near the south pole of Titan. Although heating at
southern summer solstice might be expected to drive polar convection,
studies of tropospheric conditions on Titan have suggested an absence of
seasonal variation (12, 13) and predicted that methane clouds, if present,
should concentrate at the equator year round (14)…” [92] [emphasis added]
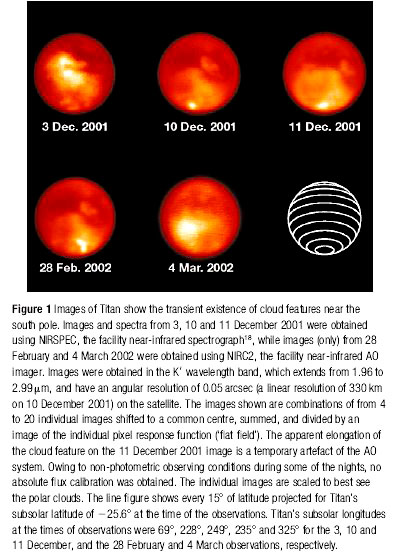
Figure 33 – Sequential IR imaging over several months by the 10-meter Keck
Telescope,
showing Titan surface features and bright, high-altitude methane polar
clouds.
In conventional Titan meteorology, “bright” clouds would be expected
over
the warmest, not the coldest, regions (because of thermal convection --
upward movement due to heating -- resulting in high level recondensation
into highly reflective methane “cirrus ice”). In colder latitudes, such high
methane cirrus -- if present at all -- would not be expected to move around
so quickly… so the observations of “fast-moving, bright clouds” in the
southern polar regions of Titan pose another major Saturnian puzzle.
However, since the south pole of Titan marks another perfect “standing wave”
resonance point in the Hyperdimensional Model, it is not surprising to see
brightness flares at and around that exact location -- as hyperdimensional
forces there, actually assisted by the extreme cold (via a dramatic
reduction in random thermal activity), could be causing the observed
high-level condensation. Also, if you go back to Figure 33 and look again --
particularly, at the one for Dec. 10, and Dec. 11, 2001, and also Feb. 22,
2002 (but especially, Dec. 11,) -- you can see portions of what appears to
be two straight lines enclosing a brighter area that could form part of
either a “hexagon,” or “pentagon.” Three lines are actually visible in the
Dec. 11th image within Figure 33…
And, while we’re on the subject of Titan and “Hyperdimensional signatures,”
we cannot leave without demonstrating one just more ….
A few years ago, in one of the first ground-based telescopic images to
penetrate Titan’s thick methane atmosphere in the infrared and see the
actual moon’s surface, a bright “mountain” was detected “near Titan’s
equator.” Careful measurements of its position by one of us (Hoagland),
revealed another fascinating confirmation of the internally resonating fluid
(lava), Hyperdimensional Model (Figure 34) ….
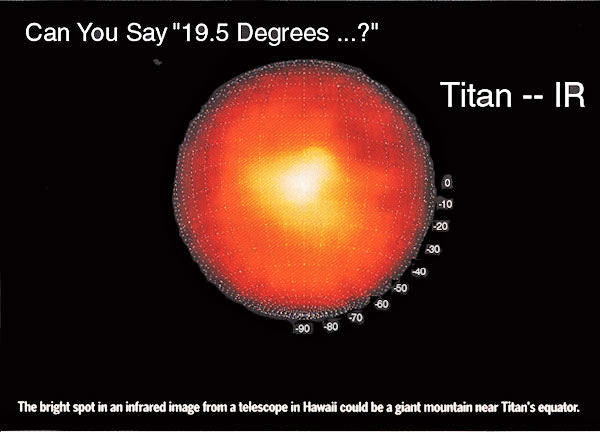
Figure 34 – 10-meter Keck infrared image reveals possible “large mountain”
on Titan … at 19.5 degrees south latitude. (Keck)
In terms of the other Saturnian moons: ozone molecules were detected over
two satellites for the first time, via Hubble observations in the late
1990s. The ozone was detected hovering over Saturn’s moons,
Dione and Rhea,
in 1997. The presence of ozone is impossible without a supply of free oxygen
– presumably, from the extensive (water) icy surfaces of these two
moons.[93]
But, what could suddenly be liberating enough water vapor from these frigid
satellites to be split into free oxygen… to then recombine into newly
detectable ozone… in the essential vacuum just above those perpetually icy
landscapes? Unless, of course, the water vapor was coming up from warmed
water beneath all that ice (but warmed by what -- underwater volcanoes?!) --
and the water vapor was then split into hydrogen and oxygen, when it escaped
(through surface cracks) and was exposed to the intense ionizing radiation
around Saturn .…
The split-off oxygen atoms would then have recombined (briefly) into the
detected ozone molecules.
No matter what the final explanation, the Hubble observations are
significant additional evidence of things also “heating up” -- more energy
available, from “somewhere” -- throughout the Saturnian system.…
Of all these new observations -- from persistent polar hexagonal cloud
geometries and mysterious “polar methane clouds,” to the appearance of
molecular ozone above otherwise geologically inactive icy satellites… all
indicative of internal hyperdimensional resonance patterns within both
Saturn and it’s largest moon… to totally baffling new x-ray phenomena in
Saturn’s atmosphere… to a 1000% increase in the bright cloud surrounding
Saturn… to the mind-boggling disappearance of one of the most alluring “new
Voyager phenomena” of Saturn’s rings, its remarkable “spokes” -- the
overwhelming evidence is that Saturn, like the rest of the solar system, is
inexplicably changing. Not on a timescale of “geological eras”… or, even in
a human lifetime… but in mere decades.
In another paper, we shall treat in some detail two of these dramatic
changes -- the highly mysterious disappearance of the “spokes”… and the
simultaneous detection of equally mystifying x-rays coming from the
equatorial regions of Saturn -- and how they are related.
For, it is obvious from official comments--
"It’s a puzzle, since the intensity of
Saturn’s X-rays requires that Saturn
reflects X-rays fifty times more efficiently than the Moon [emphasis
added].”[http://www1.msfc.nasa.gov/NEWSROOM/news/releases/2004/04-031.html]
--that mainstream NASA planetary scientists haven’t a clue as to what’s
causing these two simultaneous phenomena… Or-- the grave danger they pose to the approaching, billion-dollar
Cassini
Mission.
Fortunately, we do.
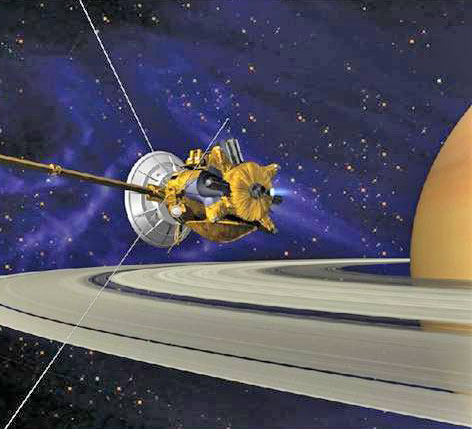
Figure 35 – Cassini brakes into Saturn orbit, July 1, 2004, directly over
the rings -- by firing its on-board engine to allow capture by Saturn’s
massive gravitational field. (NASA artist’s concept)
Uranus
Though Uranus “appeared as featureless as a cue ball” in 1986 when
Voyager
flew by, remarkably bright clouds began appearing as of at least 1996…
clouds “almost as large as continents on Earth, such as Europe” showing up
in only ten years or less! [94]
By 1998, two years later, the Hubble Space Telescope had discovered nearly
as many clouds in a short time in the high Uranian atmosphere as had ever
been observed in the entire history of Uranus before. One of these clouds
was “brighter than any other cloud ever seen on Uranus.”[95] (Figure 36)
About a year later in 1999, with the changes only continuing to increase,
NASA articles were referring to Uranus as being “hit” by “Huge Storms,” [96]
making it “a dynamic world with the brightest clouds in the outer solar
system.” As an interesting analogy, NASA also said that “If springtime on
Earth were anything like it will be on Uranus, we would be experiencing
waves of massive storms, each one covering the country from Kansas to New
York, with temperatures of 300 degrees below zero.”[97]
Sound a bit familiar … like certain cataclysmic weather elements being
depicted right now here on Earth … in a certain feature film?
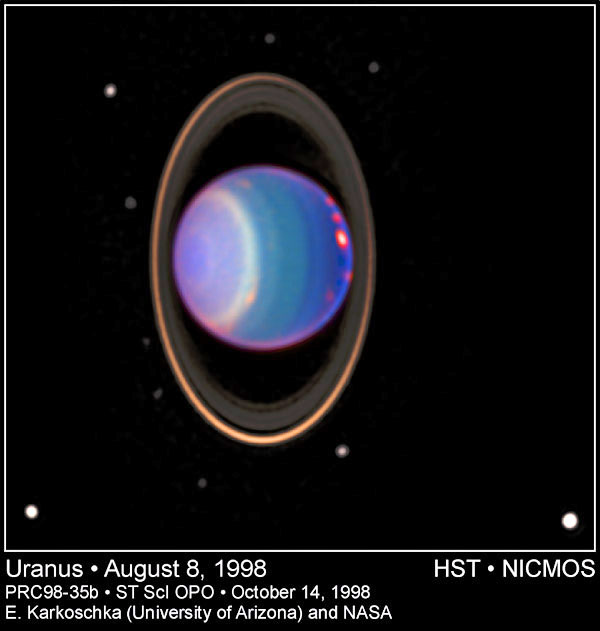
Figure 36 - False-Color Infrared Image of Emerging High-Altitude Bright
Clouds on Uranus (NASA/HST 1998)
All this begs a question, though ….
Has Uranus always been like this, displaying these specific brilliant
features in the clouds -- and we simply didn’t get the chance to properly
observe them any time before? Or, have they just tilted into Earth view with
the passage of time and Uranus’s ponderous 64-year orbit of the Sun? Are
there really any changes going on that are that unusual … or, are we just
learning about what was already there before?
Here’s the answer: the head NASA scientist referred to these increasingly
bright and active clouds as “really big, big changes” on Uranus [emphasis
added], compared to what we had seen with Voyager just years before. And,
let’s not forget that Voyager did not see Uranus from the same angle that we
do from Earth with ground-based telescopes or Hubble.[98]
Even so, some skeptics will probably still attack -- confidently asserting
“nothing unusual is going on” … “it’s all the ‘same-old-same-old’ …” or,
“any changes are just the result of normal ‘seasonal’ variations, due to
Uranus’ constantly changing position relative to the sun.”
Quite the contrary.
In October 2000, an official NASA briefing admitted that there are “discrete
features northward of 25 degrees N that have the highest contrast ever seen
for a Uranian cloud” [emphasis added]. Remember: the highest-contrast (read:
greatest brightness) cloud ever seen on Uranus was not spotted until the
year … 2000.
Here’s the official clincher: “long-term ground-based observations [of
Uranus, are showing] seasonal brightness changes”… So, even from
Earth,
significant changes have been cataloged… based on new cloud patterns “whose
origins are not well understood.”[99] [emphasis added]
Ok, even though it is easiest to blame Uranus’ brand new, continent-sized,
surprisingly bright clouds on its angular position relative to its orbit of
the Sun, the preceding official NASA analysis reveals that the science just
does not exist to explain how such clouds could be formed … in such a
manner.
The HD Model does ….
Higher-dimensional, fluid-like energy (existing all around us, in a
massfree
aether, just out of reach of our physical five senses and most conventional
detection instruments…) is obviously building up within Uranus, and the many
other bodies we’ve been examining all across the solar system. When this
occurs, objects (such as planets, or satellites) are forced to “bleed off”
this energy into our own three-dimensional frame of reference, where it
manifests in various forms depending on the nature of the three-D materials
involved.
In bloated, gaseous planets, it is signaled by the appearance of “bright,
new cloudlike features” -- via the additional input of energy sustaining
heightened convective activity, and the subsequent high-altitude
condensation of brilliant clouds of ice crystals … such as the methane
cirrus now appearing in Uranus’ upper atmosphere.
On the other hand, if the energy appears in a rocky satellite (or planet),
without a substantial atmosphere -- such as Jupiter’s Io -- the increased
thermal activity creates a recognizable geometric pattern of internal
volcanic heating and eruptions, corresponding to the hyperdimensional
resonance flow between dimensions -- resulting, for instance, in the
newly-seen “200-mile-wide lava hotspot” at a precise geometric location on
Io’s surface.
What about Uranus’ atmosphere itself?
If the overall planetary brightness of Uranus, due to increased convective
cloud activity, is changing so dramatically -- then is there any hint of
equally massive atmospheric compositional changes that should accompany
these climate variations in the HD Model? Changes similar to the “high
increases of helium and heavier ions” now being seen in the Sun’s
plasma
emissions; the “embarrassing” 10% decrease of heavy elements in
Jupiter’s
atmosphere (coupled to a corresponding 10% increase in helium, one of the
same basic elements also mysteriously increasing in the Sun); the recent
“surprise… abundance” of ozone in Mars’ atmosphere; or, the “dramatic”
decrease in sulfur gases in Venus’ atmosphere… coupled with that equally
baffling, apparent simultaneous increase in oxygen -- the latter appearing
in the form of a geometrically-defined, “tetrahedral” auroral brightness
increase … of over 2500 percent!?
There is, indeed.
We do, in fact, see a measurable change in the composition of the
Uranian
atmosphere, which has appeared just recently. Carbon monoxide (CO) gas was
detected in Uranus’ atmosphere for the first time in December 2003, and the
observing scientists feel that this gas comes from dust flowing throughout
the solar system.[100] The origin of this new dust plays a very important
role in (the Wilcock version of) the HD model, as we briefly explore later
in Part 4… This “anomalous” dust appears to be finding its way into
planetary atmospheres all across the solar system where it was never seen
before, including Earth.
By contrast, it is the other author’s opinion (Hoagland) -- backed by
revolutionary laboratory data from the “new energy community” -- that such
dramatic compositional changes are likely a direct by-product of the rising
HD energies themselves … a literal planetary alchemical transformation of
one element (or elements) into another, within these planetary atmospheres
…. A more definitive detailing of this Model, and an overview of the
current, supporting laboratory evidence, will be forthcoming on Enterprise
soon ….
Before we leave the Uranian system, we have yet another surprise in store.
There is a unique geometric phenomenon present on one of
Uranus’ most
intriguing moons -- not directly connected with any of the current changes
we’ve been highlighting -- but highly indicative of the fundamental Physics
underlying all these solar system changes. Our last set of images in this
section dramatically reveals this remarkable phenomenon -- a physical
process, involved in the formation (one of us, Wilcock, believes) of the
Uranian moon, Miranda -- a process that directly supports the
HD model.
Acquired by Voyager 2, in January, 1986, the startling images of a bright,
obviously geometric, “L- shaped” formation on
Miranda (Figure 37 -- left) is
very unambiguous -- and completely without any theoretical explanation in
conventional geological models for the moon’s formation, or subsequent
evolution .… Look closely, and study the two sides of the image (below)
carefully.…
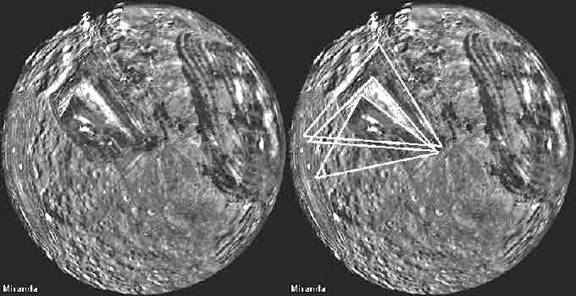
Figure 37 - Voyager image of Uranian moon Miranda (L) and underlying
three-fold triangular geometry (R).
(NASA (L) with additions by Wilcock (R), 2004.)
What is the likelihood of seeing a set of similar angles, in such nearby
proximity and relationship, with such straight-lined geometric perfection --
if this were only a “natural formation” (in the mainstream sense)? Even the
slightly widened nature of the two higher, smaller triangles is not
unexpected: since the shape of the underlying geometric “stress patterns” is
being projected onto a spherical surface. The geometry is patently obvious,
even without a theoretical basis in place -- with the major clue to its
origin being that the largest observable “triangle” on Miranda is … or once
was … perfectly equilateral.
A more complete overview of the scenario that accounts for this unique
satellite geometry has been presented in Wilcock’s “Divine Cosmos” (and will
be reiterated, to some degree, in Part 4 of this Report), but here’s the
crux of the model:
After Miranda formed, in the dust and gaseous nebula which orbited
Uranus in
the forming solar system, there was a subsequent, apparent physical
expansion of Miranda … shortly (geologically speaking) after its own
formation. The process appears to have been shaped by internal “geometric
forces” -- resonant internal energy patterns still unacknowledged (let alone
explained) by any mainstream planetary models.
When this process was occurring, most of the surface of the now icy
Miranda
was composed of a high percentage of liquid water (!) for a time -- ideal
conditions for a fluid-like HD energy to express itself as “formative
geometry” in our dimension. In that early era, the normally-invisible
internal geometric resonances that we have proposed elsewhere in this Report
-- as shaping surface other features on other planets and their moons --
were apparently able to leave their unmistakable geometric signature on the
rapidly-cooling, icy surface layers of this “ice ball” moon … for Voyager to
find.
According to Wilcock, the “triangles” that we can still make out in Figures
37 and 38 appear to show the faces of a regular geometric solid -- an icosahedron -- which is shaped like a soccer ball, with 20 faces, each of
which is a perfect equilateral triangle. Studying the image more closely, it
is also possible to see a straight white line (indicated) -- that could
indicate a fourth triangle, in a perfect “ratcheted” angular position
immediately below the two others, and perfectly offset at the same base
angle. Yet another white mark on the moon’s surface could locate the top
corner of a fifth triangle, smaller than the others and with the same basic
rotation involved, but we haven’t drawn it into Figure 38 in order that the
image stays a little less cluttered. See for yourself:
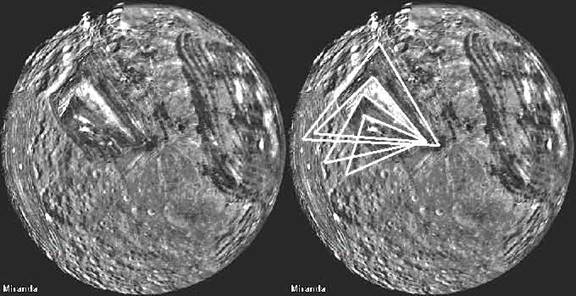
Figure 38 - Voyager composite image of Uranian moon Miranda (L) and
underlying
“ratcheting” four-fold triangular geometry (R). (NASA 1988 / Wilcock 2004)
Though we have not tried to model it here, notice that the largest (again,
equilateral!) triangle is not just one line… it is a series of “nested” or
“striated” straight lines, suggesting that the “energy geometry” may have
been rapidly expanding (or, the moon rapidly contracting), leaving the
striations in the freezing ice and dirt behind …. These striations are
easier to spot as we investigate the next image, Figure 39, where we get a
far more “up close and personal” view of the top of this remarkable
triangular formation.
In examining Figure 39 -- again, taken from the 1986 Voyager 2 imagery of
this amazing landscape -- you may notice a feature that NASA scientists have
also puzzled over for almost a generation… a very large, vertical cliff that
pokes straight up out of the surface, just above the northern tip of the
largest triangle (Figure 39 -- upper right), and aligned with its western
edge. Indeed, at 5 to 6.25 miles tall, this is quite literally the largest
cliff in the entire solar system -- fully 300% higher than the Grand Canyon
is deep!
This 6-mile-high, straight-lined cliff clearly shows the enormous internal
stresses that these geometric energies were able to exert during the
formation of the moon. The apparently fragile nature of the surface ice
allowed the internal geometric resonances to literally tear the brittle
surface of the moon apart … leaving 6-mile-high “fingerprints” pointing
toward the stars.
These silent sentinels now stand as 30,000-foot, shining shards of ice …
mute testimony to the awesome Hyperdimensional forces that can literally
shatter worlds ….
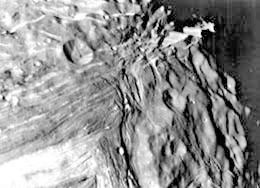
Figure 39 - Geometrically Positioned Vertical Cliff on Miranda, 5-6 Miles
High (NASA 1986)
When presented with this stupendous evidence, falling on the exact same
straight line that anyone can extend off of the main “triangle” on
Miranda,
even NASA had to say “something” about how “anomalous” it was… seeing such
huge cliffs towering above the surface of such a comparatively tiny moon
(Miranda is only ~300 miles across!). It is not often that
NASA claims that
an anomaly is “quite surprising,” but this is one example where they had
to:[101]
Figure P-15.3 offers more evidence of the intensity of both vertical and
horizontal deformation on Miranda. A near-vertical, stratified scarp 8 to 10
km [5-6.25 miles] in height (upper right) represents the highest cliff known
in the solar system (even exceeding the relief of the huge cliffs in Valles
Marineris on Mars and more than three times the relief of the Grand Canyon).
Vertical grooves (from shearing between fault blocks?) appear on the cliff
face. Such a huge cliff, remaining intact, is quite surprising on a small
icy body [emphasis added].
Also potentially significant is a seemingly pentagonal structure in the same
striated dusty ice, to the east of the main triangular figure. In this next
Voyager 2 image, we see multiple “nested” layers of straight lines on the
right side of the moon, just as we have seen in the main triangular area.
The angles between these lines seem to be perfectly pentagonal… the second
huge, unmistakably geometric “bite” into an otherwise smooth “cookie,” with
many visible layers of striations (Figure 40).
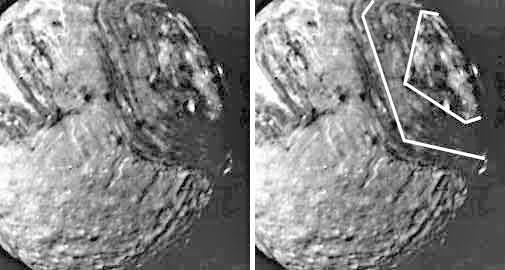
Figure 40 - “Nested” Pentagonal Feature on Uranian moon Miranda (NASA 1988,
Wilcock 2004)
Furthermore, if you look closely at the image on the left in Figure 40, you
will see an area in the center of the “pentagonal” striated feature where
there is a distinct change… a different geometry seems to slice through the
straight lines, as if it were superimposed on top of them! Inside this
geometric area, the striations stop, and the surface looks far more similar
to the rest of the moon’s surface. Upon close inspection, this
“superimposed” area also appears to be pentagonal, but on a slight
rotational offset from the other pentagon formation. Thus, the “triangles”
are not the only “ratcheting” geometry visible in the formation of Miranda.
For those who really do get excited by the details, the angle of offset
between these two main pentagonal formations appears very similar to the
main offset angle between the triangles in Figures 37 and 38. NASA’s “full
moon” composite image shown in Figures 37 and 38 seems to have distorted
some of the pentagonal details, as gray areas were arbitrarily filled in
where data was missing (at the top) … apparently assuming that the striated
structure did not continue past the point where Voyager’s imaging cuts off.
When we look to the west of the main triangular image, even more ribbed
straight-line structures appear… (!) … suggesting that there could be yet
additional geometry to discover, if the entire moon were properly
photographed -- since at present we have only seen the better part of one
side of it. In this case, it appears (Figure 41) that we are again seeing a
60-degree angle in the straight lines, suggesting similar equilateral
triangles as those appearing in the main “L” feature:
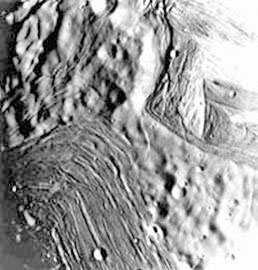
Figure 41 - Layered, Possibly Triangular Feature Due West of “Ratcheted
Triangle” Formation (NASA 1986)
All in all, the Uranian moon Miranda is second-to-none in showing us how
these geometric “resonance energies” emerge within a solid, planetary object
and can shape major portions of its surface -- even if that object is “only”
300 miles across. In these historic Voyager images, remarkable and
surprising additional support is thus provided to the Hyperdimensional
Model… which gives us the physical engine to drive these otherwise totally
inexplicable surface patterns on Miranda.
An important afterthought: why just on Miranda? Why not equally tell-tale,
equally geometric “Hyperdimensional surface features” on any of the other
~138 moons… currently known to orbit the major planets of this solar system?
Due to Miranda’s unique display of highly ordered surface features, coupled
with its unique position in the solar system, the other author of this
Report (Hoagland) has a slightly different explanation for the remarkable
geometries Voyager 2 discovered on Miranda .…
As most people who are interested in the solar system already know, Uranus
has a highly anomalous “obliquity” (tilt) to the plane of its
orbit around
the Sun (~98 degrees…), compared with any of the other planets. For this
reason, Hoagland theorizes that sometime in the past history of the solar
system, Uranus experienced a literal, radical, polar shift in space. Such a
“major polar reorientation” -- for such a massive, rapidly spinning object
-- would have created enormous hyperdimensional forces, not only inside
Uranus… but also in the space immediately surrounding the massive, rapidly
rotating planet -- forces that would have included the close-in orbit of…
Miranda.
Hoagland contends that such unimaginable forces would have literally “turned
Miranda inside out” -- re-melting the entire, previously icy moon in the
process!
As Miranda literally resolidified, the enormous hyperdimensional resonances
in the space surrounding it -- attempting to reshape the moon’s internal
structure to conform to these resonant geometries still present in the
aether from it’s massive, nearby primary -- were literally frozen into
portions of the surface of this refreezing icy moon, preserving … forever …
the otherwise invisible hyperdimensional fingerprints of the awesome
planetary catastrophe which had occurred.
The presence of extensive cratering in other regions of this satellite,
right alongside the highly geometric sections, Hoagland believes, testifies
to the true nature of the Event which caused this literally moon-wrenching
destruction and recreation: the explosion, 65 million years ago, of another
major planet -- Planet V -- orbiting closer to the inner solar system… where
now only the scattered debris of asteroids roam. [For a fuller examination
of this theory and its other far-reaching solar system implications, the
reader is referred to “The Mars Tidal Model’ at
http://www.enterprisemission.com/tides.htm].
Thus, in Hoagland’s Model, it is because of Miranda’s unique location -- as
the closest satellite to a major planet that one day literally tipped over,
creating enormous hyperdimensional stresses in the space (and any objects!)
immediately surrounding it -- that this tiny moon has now preserved upon its
surface a unique record of the literal process of hyperdimensional creation…
vital, additional clues to what is really going on all across the solar
system … even now.
Our next stop on this bold new tour of the solar system is Neptune… and if
you think that the data is going to tire out and get any less dramatic, as
we head into colder and colder regions of the outer solar system, where
solar energy must carry less and less of an effect … then you’re in for a
real surprise.
Neptune is a “textbook Hyperdimensional case” -- in every sense of the word.
The image of Neptune featured in Figure 42 is one of the single most
dramatic, full color images of undeniably obvious solar-system change now
have available. If you know someone who really has trouble believing any of
this, no matter how obviously you spell it out for to them, show them Figure
42 … and show it first.
The increasing brightness that we have just explored on Uranus is precisely
mirrored with an even greater increasing brightness on Neptune… plus a
myriad of other changes totally reinforcing our earlier discussions.
Neptune
By June 1994, Neptune’s “Great Dark Spot” -- a circular atmospheric feature
in the southern hemisphere, at our familiar 19.5-degree latitude, just like
the “Great Red Spot” on Jupiter -- had mysteriously disappeared.
For reference, Figure 42 shows us what this Great Dark Spot looked like to
Voyager 2… before it literally vanished.
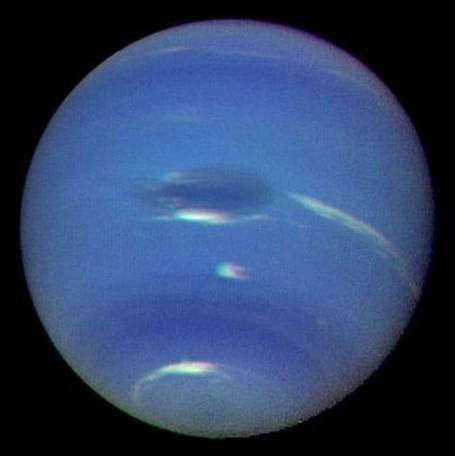
Figure 42 – Neptune, with Great Dark Spot in center, as seen by Voyager 2 in
1989. (NASA)
By April of 1995, Neptune’s Great Dark Spot had reappeared … but … in
Neptune’s northern hemisphere… accompanied by more bright, high-altitude
clouds! NASA itself noted that this new spot was a “near-mirror image of the
first spot previously imaged by Voyager 2.”[102] [emphasis added]
This surprising change also led NASA scientists to observe that “Neptune has
changed radically since 1989… New features indicate that with Neptune’s
extraordinary dynamics, the planet can look completely different in just a
few weeks.” And even more importantly, for the HD model,
NASA said: “Energy
from the Sun drives the Earth’s weather system. However, the mechanism on
Neptune must be very different because the planet radiates 2 times more
energy than it receives from the distant, dim Sun …”[103] [emphasis added].
Are you starting to see a pattern here?
Two years after these official descriptions, NASA wrote of “a looming
mystery”:
When the planetary probe
Voyager visited Neptune in 1989, it detected the
Great Dark Spot, a pulsating feature nearly the size of the Earth itself.
Two years ago, Hubble observations showed the spot had disappeared, and that
another smaller spot had emerged. But instead of growing to a large-scale
storm like the Great Dark Spot, the new spot appears to be trapped at a
fixed latitude and may be declining in intensity, said Sromovsky, a senior
scientist …[104] [emphasis added].
What, exactly, would “trap” the new spot at a fixed latitude, exactly the
same number of degrees above the equator as the previous spot was below the
equator!? This is easily explainable in the Hyperdimensional Model, as a
180-degree phase shift in the simplest resonant (tetrahedral)
pattern
underlying Neptune’s internal fluid dynamics… which forces the precise
positioning of “the Great Dark Spot” -- the vortex resonantly
shifting from
19.5 degrees south latitude… to 19.5 degrees north. [Refer back to
Figure 3,
in Part Two of this Report, for an explanatory diagram of this underlying
HD
geometry.]
If you’re thinking that this “HD phase shift” of Neptune is somehow
correlated with the shift of vortex activity away from Jupiter’s equatorial
regions, towards the polar regions… and the 58.6% slowdown of cloud
rotations at Saturn’s equatorial region… with the surprise emergence of
x-ray emissions along Saturn’s equator, rather than the poles as
NASA would
expect… and the disappearance of the so-called “spoke” formations in
Saturn’s rings… then congratulations, Neo…
…you have taken “the red pill” and begun using your new “eyes” for the first
time… seeing “the real world” beyond the limitations inherent in the
confined “box” of three dimensions… or what some might call the “Matrix.”
Well done. There is, indeed, no spoon…
It gets better. By 1996, less than a year after this “hyperdimensional
Neptunian pole shift,” Dr. Lawrence Sromovsky noticed an increase in
Neptune’s overall brightness, which continued dramatically surging upwards
through 2002 (Figure 43). Though the false-color photo speaks far louder
than the statistics, the fact is that in only six short years, blue light
became 3.2% brighter on Neptune, red light 5.6% brighter… and near-infrared
light intensified by a whopping 40%. Even more surprisingly, some areas of
latitude became fully 100 percent brighter!
In this case, we invite you to read this stunning discovery in NASA’s own
words, while also noticing how these unprecedented, planet-wide changes in
brightness are boringly “explained away” by a “simple seasonal variation
model” related to Neptune’s tilt angle to the Sun… (…yawn…)
April 22, 2002, Madison, WI—Hubble Space Telescope (HST) imaging
observations in August 2002 show that Neptune’s brightness has increased
significantly since 1996… and now appears to be consistent with a simple
seasonal variation model… Comparing August 2002 observations to similar
observations in 1996, the authors found that Neptune’s reflectivity averaged
across the planet’s face (disk-averaged) increased by 3.2% at 467 nm (blue),
5.6% at 673 nm (red), and 40% in the 850 nm–1000 nm band (near infrared).
These changes result from even larger brightness increases in restricted
latitude bands, reaching 100% in some cases. The reason for the increases
may be seasonal forcing, which is the seasonal variation in local solar
heating.”[105]
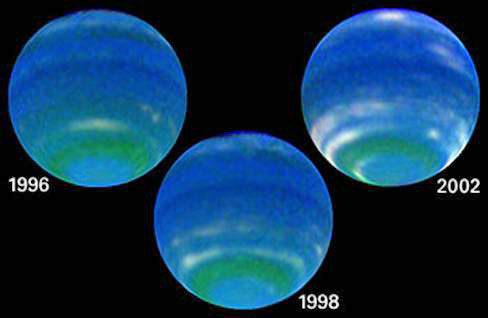
Figure 43 – Atmospheric brightness increases on Neptune, 1996-2002.
(Sromovsky et al. / NASA / HST)
Though this last NASA article makes it all seem good and simple, like “a
neat little light show brought on by very ordinary meteorology”… there are
other articles that speak far more candidly. The bottom line is that the
physics to explain such a change in brightness is just not there in the
conventional models, since Neptune “seems to run on almost no energy”. But
don’t take our word for it… read what the scientists themselves have had to
say:
…Some of the wildest, weirdest weather in the solar system… a planet whose
blustery weather -- monster storms and equatorial winds of 900 miles per
hour - bewilders scientists…
The weather on Neptune, the eighth planet from the sun, is an enigma to
begin with. The mechanism that drives its near-supersonic winds and giant
storms has yet to be discerned.
On Earth, weather is driven by energy from the sun as it heats the
atmosphere and oceans. On Neptune, the sun is 900 times dimmer and
scientists have yet to understand how Neptune’s weather-generating machinery
can be so efficient. "It’s an efficient weather machine compared to
Earth,"
said Sromovsky. "It seems to run on almost no energy."…
Sromovsky said that compared to the look provided by the
Voyager spacecraft,
Neptune is a different place: “The character of Neptune is different from
what it was at the time of Voyager. The planet seems stable, yet
different.”[106] [emphasis added]
If the planet itself is changing, then what about its satellites?
Look no further: Neptune’s major moon, Triton, also experienced great
changes… in this case, a “very large” 5% temperature increase between 1989
and 1998. According to MIT researchers, this is comparable to the Earth’s
atmosphere globally heating up by 22 degrees Fahrenheit… in only 9
years![107] It is believed that
Triton’s atmospheric pressure also has “at
least doubled… since the time of the Voyager [1989] encounter.”[108]
It is curious that each of these components we have discovered throughout
the solar system, like the warming trend on Triton, are so often discussed
as single events, or perhaps with “one or two others” included… in a few,
rare instances.
NASA does give us all the hard evidence we would ever need to make a case…
but they, or the media reporting on their discoveries, simply never put this
evidence together under one roof. Thus, the data continues to quietly slip
out into the open undetected, while the gaping silence of yawns from the
public perpetually haunts the prospects of any newly proposed space mission
ever getting off the ground.
If these changes were to break into the open media, it is quite natural to
assume that the public would become far more interested in tracking these
truly remarkable changes… especially because of how they might affect us…
and the funding would come rolling on in.
We know that the Earth is also undergoing major changes, as we will explore
in unprecedented detail in Part 4 of this Report.
In the meantime, the only unexplored territory still remaining is the
distant Pluto -- the icy planet on a long, elliptical orbit at the far outer
reaches of our solar system, recently downgraded to a “planetesimal”
status
in most planetologists’ eyes. If Pluto can be shown to have any changes at
all, then we most certainly are dealing with a solar-system-wide effect.
Case closed.
Pluto does not disappoint.
Pluto
Before we discuss the likelihood of any real changes going on with
Pluto, we
have to begin by taking note of something important. Most conventional
NASA
explanations for these changes, as we have seen, revolve around the notion
(pun intended!) that the planet or satellite’s angular tilt (obliquity)
relative to the Sun, is by far the most likely cause of any observable
changes. In the case of Pluto, the 248-year elliptical orbit it traces
around the Sun actually brings it closer to the Sun than
Neptune at certain
times… which, incidentally, just occurred between 1979 and 1999… and much
farther away from the Sun at other times.
Obviously, we would naturally assume that if a planet moves closer to the
Sun, it is exposed to more heat than if it moves farther away from the
Sun.
Simple, right? If you’re heating your house with a single fireplace, you’re
not going to hang out in the kitchen if the fire is in the living room. So,
where is Pluto now?
Below (Figure 44) is a Hubble Space Telescope image of Pluto, taken several
years ago. Because Pluto was slightly less than 3 billion miles from Earth
(and still, at the time, inside Neptune’s orbit) when the image was
acquired, even with Hubble’s superb resolution, the size of each “pixel” on
the surface of the tiny planet was more than 100 miles across!
At that enormous distance, the strength (and thus the heating effect) of
sunlight reaching Pluto’s surface was 800 times less than sunlight at
Earth’s distance … and getting smaller with each passing hour!
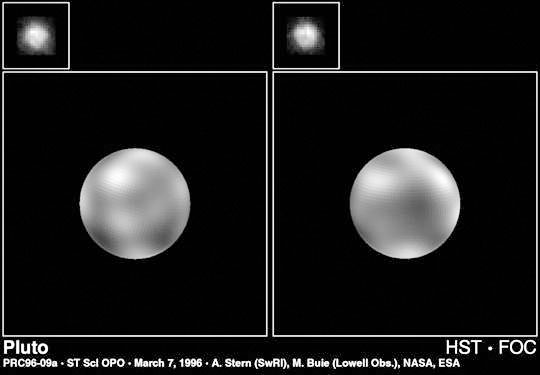
Figure 44 – Pluto as imaged by the Hubble Space Telescope (actual images,
upper right). The two larger images are computer-synthesized maps made from
the raw Hubble images (NASA/ST Sci)
This is because -- crucially -- since 1989,
Pluto has been moving away from
the Sun in its highly elliptical, 248-year orbit. As you probably already
guessed, 1989 was exactly halfway in the middle of the 1979-1999 period when
Pluto was inside Neptune’s orbit.
Despite this drifting into the nether regions, where we would logically
expect it to get colder and colder, something phenomenal is going on…
something that utterly, totally puts the capstone on our Hyperdimensional
Model.
Pluto’s temperature is increasing. Its atmospheric pressure is increasing.
And not just a little…
A lot.
No, scratch that… by a truly tremendous amount.
Yet, this is all occurring even as
Space.com admits, “Logic suggests the
planet might cool as it receives less sunlight each day.”[109] Indeed.
A groundbreaking Pluto study, recently led by Dr. James L. Elliot, took
advantage of a rare event, similar to the one we previously discussed with
Saturn’s satellite, Titan. Pluto passed in front of a star in 2002, and this
allowed Dr. Elliot and his associates to determine whether
Pluto’s structure
and composition had stayed the same, as previously observed in 1989, or if
it had changed in some way.
To their obvious surprise, they discovered that the atmospheric pressure of
Pluto has increased... by a full three hundred percent… (!) … between 1989
and 2002! This has also caused a noticeable rise in Pluto’s surface
temperatures. Again, this is attributed by mainstream planetologists to… you
guessed it… “seasonal change.”[110]
Remember just a bit earlier when we were discussing Neptune’s
moon, Triton…
how its global warming compares to the Earth becoming globally 22 degrees
Fahrenheit hotter -- in only nine years? According to Dr. Elliot, “The
changes observed in Pluto’s atmosphere are much more severe [than the
“global warming” seen on Triton]. The changes observed on
Triton were
subtle. Pluto’s changes are not subtle… We just don’t know what is causing
these effects.”[111]
Indeed, elsewhere Dr. Elliot says that the idea of “seasonal changes” being
responsible for such a “severe” increase is “counterintuitive,” because, by
orbiting farther from the Sun, it would be expected that
Pluto’s
temperatures would naturally fall… not rise![112]
Hence, Dr. Elliot and his other NASA team members acknowledge this
unexpected “global warming” of Pluto, but they also say that this warming
trend is “likely not connected with that of the Earth” since the “Sun’s
output is much too steady.”[113] Furthermore, “some longer term change,
analogous to long-term climatic changes on Earth” could be responsible.[114]
Without identifying precisely what this longer-term change could be, they
tread very closely to suggesting some single, unified cause… like what we
present here in our hyperdimensional model.
Furthermore, not only has Pluto’s atmospheric pressure increased, but it is
also showing signs of weather… for the first time, as was reported in a
Space.com article:
Meanwhile, the new studies reveal what appear to be the first signs of
weather on Pluto, small fluctuations of air density and temperature.
Sicardy’s team figures the changes, seen as spikes in the data, are caused
"either by strong winds between the lit and dark hemispheres of the planet,
or by convection near the surface of Pluto."
Scientists have long suspected that pressure difference in the tenuous
atmosphere, created by stark temperature differences from the day side to
the night side, would fuel brisk breezes.
The researchers did not attempt to estimate the strength of Pluto’s apparent
winds.
Pluto gives up its secrets slower than any planet.[115]
Given that even NASA seems to be vaguely aware that these distant, totally
unexplainable changes in Pluto’s environment are, somehow, analogous to
equally inexplicable “global warming” occurring here on Earth… by saying
that the “global warming” of the Earth and of Pluto are “likely not
connected”… in the closing section of this Report we shall therefore turn
our attention back towards the Earth, where all of these changes truly
matter most .…

For, it is in these Earthly shifts that we are shown most directly how our
own lives may be dramatically affected by the “cosmic” physical processes
and changes under discussion in this Report.
The Earth, in Part 4, will dramatically reveal a host of anomalies that are
literally identical to many of the others that we have investigated
elsewhere in the solar system. We will also explore “resonance interactions”
between the Earth, the Sun, the Moon, other planets --
even a nearby pulsar,
CP1133. Once the Earth data is complete, anyone who has read this paper with
an open mind is likely to laugh out loud at petroleum-funded scientists who
try to insist that “nothing much has changed” on the Earth… or in the
greater solar system.
Climate change is here. It is real. It is taking place simultaneously on all
our nearby worlds. It cannot be denied.
The question is this… could the knowledge of the Hyperdimensional Model
enable Humanity to team up and find a way out of the cataclysms that may
otherwise await us?
Is it worth it for scientists and political leaders to take this seriously,
knowing that if they continue to ignore this evidence, they may be turning
their backs on billions of lives that could be saved?
Think about it. Then act. Let others know what you may have learned for the
very first time here. Forward them the link to this full Report… or,
summarize the excerpts you think matter most and work up your own synopsis,
giving your readers the link to bring them back to the full Report, in case
they are interested…
If they live on Earth, they probably are.
The time to argue that “nothing is happening” is over.
These are seasonal changes occurring all around us… a “Hyperdimensional
Spring” that is blooming throughout our entire solar system. Will anyone be
brave enough, and care enough, to act… in time?
Will you?
[82] “Polar map projections of Voyager 1 and 2 images of Saturn’s northern
hemisphere revealed the existence of a feature with a remarkable hexagonal
shape surrounding the pole at planetographic latitude 78.5 deg N (see Fig.
1A) (Godfrey 1988). The hexagon was embedded within an eastward jet of 100 m
s-1 but was itself stationary with respect to Saturn’s internal rotation
period (Desch and Kaiser 1981). Related to it was a large oval (the North
Polar Spot (NPS))…
Both features (hexagon and NPS) were reobserved 10-15 years later in the
1990s from the ground (Sanchez-Lavega et al. 1993) and from the Hubble Space
Telescope (Caldwell et al. 1993), suggesting that they are long-lived
features apparently insensitive to the strong seasonal forcing in Saturn’s
polar regions Fig 1B. Because of its slow drift, the hexagon was conjectured
to be deeply rooted in Saturn’s interior (Gierasch 1989, Godfrey 1990).”
Sanchez-Lavega, A. and Perez-Hoyos, S, et al. NOTE: No Hexagonal Wave around
Saturn’s Southern Pole. Icarus 160, 216-219 (2002). URL:
http://www.ajax.ehu.es/grupo/2002b.pdf
[83]
“At present, most of our knowledge of the Saturnian system can be
traced to the pioneering observations of Saturn’s plasma population,
energetic particle population, magnetic fields, plasma waves and remote
sensing observations from the Pioneer II and Voyager 1 and 2 encounters…
Johnson et al. (1989) constructed from all these observations a model of a
neutral cloud torus that surrounds Saturn…
This work was followed by the discovery using HST of a relatively large
toroidal cloud of OH that was surrounding Saturn with densities as high as
500 cm-3 near the L shell of [the moon] Enceladus (Shemansky et al., 1993;
Hall et al. 1996; and Richardson et al. 1998). This density was more than an
order of magnitude larger [1000% larger] than that predicted by Johnson et
al. (1989) [based on the original Pioneer and Voyager data]…”
Sittler, Ed et al. Pickup Ions at Dione and Enceladus: Cassini Plasma
Spectrometer Simulations. NASA/Goddard Space Flight Center et al. URL:
http://caps.space.swri.edu/caps/CAPS_Publications/Sittler.pdf
[84] “The Hubble telescope has taken the first picture of bright aurorae at
Saturn’s northern and southern poles [top picture]…
Hubble’s far-ultraviolet-light image resolves a luminous, circular band
centered on the north pole, where an enormous curtain of light rises as far
as 1,200 miles (2,000 kilometers) above the cloud tops. This curtain changed
rapidly in brightness and extent over the two-hour period of observations.”
Trauger, J.T. et al. Hubble Provides the First Images of Saturn’s Aurorae.
HubbleSite NewsCenter, 1995, no. 39. URL:
http://hubblesite.org/newscenter/newsdesk/archive/releases/1995/39/ - see
also
http://hubblesite.org/newscenter/newsdesk/archive/releases/1998/05/
[85] Hill, Mary Ann. Saturn’s Equatorial Winds Decreasing: Spanish-American
Team’s Findings Raise Question About Planet’s Atmosphere. NASA / Wellesley
College News Release, June 4, 2003. URL:
http://www.wellesley.edu/PublicAffairs/Releases/2003/060403.html
[86] “The first clear detection of X-rays from the giant, gaseous planet
Saturn has been made with NASA’s Chandra X-ray Observatory. Chandra’s image
shows that the X-rays are concentrated near Saturn’s equator — a surprising
result since Jupiter’s X-ray emission is mainly concentrated near the poles.
Existing theories cannot easily explain the intensity or distribution of
Saturn’s X-rays…Jan-Uwe Ness, of the University of Hamburg in Germany and
lead author of a paper discussing the Saturn results in an upcoming issue of
Astronomy & Astrophysics… [said,] "It’s a puzzle, since the intensity of
Saturn’s X-rays requires that Saturn reflects X-rays fifty times more
efficiently than the Moon.”
Roy, Steve and Watzke, Megan. X-rays from Saturn pose puzzles. NASA/Marshall
Space Flight Center News Release #04-031, March 8, 2004. URL:
http://www1.msfc.nasa.gov/NEWSROOM/news/releases/2004/04-031.html
[87] “In the early 1980s, NASA’s two Voyager spacecraft revealed that
Saturn’s rings are made mostly of water ice, and they found “braided” rings,
ringlets, and “spokes” – dark features in the rings that seem to circle the
planet at a different rate from that of the surrounding ring material.”
NASA Solar System Exploration. Overview: Saturn. NASA SSE website. URL:
http://solarsystem.nasa.gov/planets/profile.cfm?Object=Saturn&Display=OverviewLong
[88] “Dr. Carolyn Porco, a planetary ring specialist and leader of the
Imaging Science team, said, “For someone who was involved in the Voyager
exploration of Saturn twenty-three years ago, this is turning out to be a
very sentimental journey. I’m reminded of what it felt like to see Saturn’s
rings for the first time with Voyager, and how rich and surprising they
were. The spokes in the B ring, the twisted F ring and its shepherding
moons, the sheer number and diversity of ring features… we’ll be on the
lookout for all these things and more over the next few months”.” (emphasis
added)
Finn, Heidi. Saturn Details Become Visible to Cassini Spacecraft. Cassini
Imaging Central Laboratory for Opertaions (CICLOPS,) News Release, Dec. 5,
2003. URL:
http://ciclops.lpl.arizona.edu/PR/2003L05/NR2003L05A.html
[89]
“Cassini’s approach to Saturn has begun… new details in the atmosphere
and rings are becoming visible, and scientists are already puzzling over the
noticeable absence of the ghostly spoke-like dark markings in the rings
first seen by Voyager on its approach to the planet 23 years ago. One thing
is manifestly clear: there will be many more puzzles in store for us as the
mission progresses.”
Porco, Carolyn. Cassini Imaging Central Laboratory for Observations
(CICLOPS), Latest Release, Feb. 27, 2004. URL:
http://ciclops.lpl.arizona.edu
[90]
Harvard-Smithsonian Center for Astrophysics. Titan Casts Revealing
Shadow. Chandra X-Ray Observatory Photo Album website of NASA / SAO. April
05, 2004. URL:
http://chandra.harvard.edu/photo/2004/titan/
[91] “A dense, hazy atmosphere at least 400 kilometers (250 miles) thick
obscures the surface [of Titan.]”
Woodfill, Jerry. The Satellites of Saturn: Titan. NASA JSC Space Educator’s
Handbook, Last Updated Feb. 11, 2000. URL:
http://vesuvius.jsc.nasa.gov/er/seh/satsaturn.html
[92] Brown, Michael E. et al. Direct detection of variable tropospheric
clouds near Titan’s south pole. Nature, vol. 20, 19/26 Dec. 2002. URL:
http://www.gps.caltech.edu/~antonin/spclouds/article.pdf
[93] “Recent observations by HST have shown the presence of ozone at both
Dione and Rhea, which also implies the presence of molecular oxygen at these
bodies…”
Sittler, Ed et al. Pickup Ions at Dione and Enceladus: Cassini Plasma
Spectrometer Simulations. NASA/Goddard Space Flight Center et al. URL:
http://caps.space.swri.edu/caps/CAPS_Publications/Sittler.pdf ; see also Noll
KS, Roush TL, Cruikshank DP, Johnson RE, Pendleton YJ. 1997, Detection of
ozone on Saturn’s satellites Rhea and Dione, Nature, July 3; 388(6637):
45-7.
[94] “Using the Hubble telescope’s visible-light camera, astronomers for the
first time this century have detected clouds in the Northern Hemisphere of
Uranus. The snapshots show banded structure and multiple clouds…The clouds
can be seen along the planet’s right edge [the bright dots]. Another cloud
[faint white dot] is barely visible near the bottom of the blue band. The
clouds are almost as large as continents on Earth, such as Europe.”
NASA / Karkoschka, Erich et al. Huge Spring Storms Rouse Uranus from Winter
Hibernation. HubbleSite NewsCenter, Mar. 29, 1999, no. 11. URL:
http://hubblesite.org/newscenter/newsdesk/archive/releases/1999/11/text
[95] “Hubble recently found about 20 clouds — nearly as many clouds on
Uranus as the previous total in the history of modern observations. The
orange-colored clouds near the prominent bright band circle the planet at
more than 300 mph (500 km/h). One of the clouds on the right-hand side is
brighter than any other cloud ever seen on Uranus.”
Karkoschka, Erich et al. Hubble Finds Many Bright Clouds on Uranus.
HubbleSite NewsCenter, Oct. 14, 1998, no. 35. URL:
http://hubblesite.org/newscenter/newsdesk/archive/releases/1998/35/
[96] NASA. “Huge Storms Hit the Planet Uranus.” Science@NASA website, Mar.
29, 1999. URL:
http://science.nasa.gov/newhome/headlines/ast29mar99_1.htm
[97] “If springtime on Earth were anything like it will be on Uranus, we
would be experiencing waves of massive storms, each one covering the country
from Kansas to New York, with temperatures of 300 degrees below zero.
A dramatic new time-lapse movie by the Hubble telescope shows for the first
time seasonal changes on the planet. Once considered one of the
blander-looking planets, Uranus is now revealed as a dynamic world with the
brightest clouds in the outer solar system…The Northern Hemisphere of Uranus
is just now coming out of the grip of its decades-long winter. As the
sunlight reaches some latitudes, it warms the atmosphere. This appears to be
causing the atmosphere to come out of a frigid hibernation and stir back to
life.“…when NASA’s Voyager 2 flew by in 1986, Uranus appeared as featureless
as a cue ball.”
NASA / Karkoschka, Erich et al. Huge Spring Storms Rouse Uranus from Winter
Hibernation. HubbleSite NewsCenter, Mar. 29, 1999, no. 11. URL:
http://hubblesite.org/newscenter/newsdesk/archive/releases/1999/11/text
[98] “The only other detailed photos of Uranus were taken in 1986 when
Voyager 2 passed by on its way to the outer limits of the solar system. At
that time, the northern hemisphere was shrouded in darkness…
One major difference [in the new Hubble images] is a system of giant
jet-streams pushing through Uranus’ cloud layers at hundreds of miles an
hour. Another is several isolated, bright clouds - measuring about 600-1200
miles across - relatively small by Uranus’ standards…"Compared to what we
have seen on Voyager, these are really big, big changes," said Karkoschka, a
senior research associate at the Lunar and Planetary Laboratory.”
McLachlan, Sean. UA scientists look closely at Uranus. University of Arizona
Daily Wildcat, March 30, 1999. URL:
http://wildcat.arizona.edu/papers/92/123/01_3_m.html
[99]
“Uranus is rapidly approaching equinox in 2007, with another 4 degrees
of latitude in the Northern Hemisphere becoming visible every year. Recent HST images during this unique epoch have revealed: {i} strongly
wavelength-dependent latitudinal structure, {ii} the presence of numerous
visible-wavelength cloud features in the northern hemisphere, and, {iii} in
the near-IR, discrete features northward of 25degrees N that have the
highest contrast ever seen for a Uranian cloud.
Long-term ground-based observations show seasonal brightness changes whose
origins are not well understood.”Hubble Space Telescope Daily Report #2719.
1.29 Completed WF/PC-2 8634 (Atmospheric Variability on Uranus and Neptune).
Period Covered: 09/29/00-10/02/00. URL:
http://www.stsci.edu/ftp/observing/status_reports/old_reports_00/hst_status_10_02_00
[100] “A team from Paris Observatory, led by Therese Encrenaz (LESIA), has
just detected for the first time the molecule of carbon monoxide (CO) in the
atmosphere of Uranus. The origin of this molecule is probably external to
the planet, for example due to micrometeorites.
In spite of their common status of “icy giants” in the outer solar system,
the two giant planets Uranus and Neptune, with comparable sizes and
densities, show significant differences. In particular, the CO and HCN
molecules have been detected in large amounts in Neptune’s stratosphere,
from millimeter spectroscopy, while this technique was unsuccessful in the
case of Uranus…New measurements made in the infrared range have now allowed
the detection of CO in the atmosphere of Uranus. This measurement has been
made possible by the very high sensitivity of the infrared spectrometer
ISAAC…This result, if confirmed, seems to imply an external origin for [the]
CO, which would come, like the water vapor detected in the giant planets’
stratospheres, from an interplanetary flux of micrometeorites trapped in the
planets’ gravity field.”
Encrenaz, T. et al. First detection of CO in Uranus. Observatoire de Paris
Press Release, SpaceRef.com, Wed. Dec. 17, 2003. URL:
http://www.spaceref.com/news/viewpr.html?pid=13226
[101] Short, Nicholas M. Sr., and Blair, Robert W. Jr. Geomorphology From
Space – A Global Overview of Regional Landforms. Plate P-15: The Satellites
of Uranus. NASA/GSFC/DAAC, 1986. URL:
http://daac.gsfc.nasa.gov/DAAC_DOCS/geomorphology/GEO_10/GEO_PLATE_P-15.HTML
[102] Savage, Don et al. Hubble Discovers New Dark Spot on Neptune. HubbleSite NewsCenter, April 19, 1995. URL:
http://hubblesite.org/newscenter/newsdesk/archive/releases/1995/21/text/
[103]
“The distant, blue-green planet Neptune has again surprised
astronomers with the emergence of a new great dark spot in the cloudy
planet’s northern hemisphere. The feature was discovered by NASA’s Hubble
Space Telescope.
Only last June (of 1994,) Hubble images revealed that a great dark spot in
the southern hemisphere [of Neptune] – discovered by the Voyager 2
spacecraft during its 1989 flyby – had mysteriously disappeared. The new
dark spot is a near mirror-image of the previous feature first mapped by
Voyager 2. The northern dark spot discovered by Hubble is accompanied by
bright, high-altitude clouds… “Hubble is showing us that Neptune has changed
radically since 1989,” said Heidi Hammel of the Massachusetts Institute of
Technology. “New features like this indicate that with Neptune’s
extraordinary dynamics, the planet can look completely different in just a
few weeks.” Energy from the Sun drives Earth’s weather system. However, the
mechanism must be very different on Neptune because the planet radiates 2
times more energy than it receives from the distant, dim Sun…”
Savage, Don et al. Hubble Discovers New Dark Spot on Neptune. HubbleSite
NewsCenter, April 19, 1995. URL:
http://hubblesite.org/newscenter/newsdesk/archive/releases/1995/21/text/
[104] Sromovsky, Lawrence et al., University of Wisconsin, Madison. Hubble
Provides a Moving Look at Neptune’s Stormy Disposition. Science Daily
Magazine, Oct. 15, 1998. URL:
http://www.sciencedaily.com/releases/1998/10/981014075103.htm
[105] Sromovsky, Lawrence A. et al. Neptune’s Increased Brightness Provides
Evidence for Seasons. Wisconsin-Madison University Space Science and
Engineering Center (SSEC), April 22, 2002. URL:
http://www.ssec.wisc.edu/media/Neptune2003.htm
[106] Sromovsky, Lawrence et al., University of Wisconsin, Madison. Hubble
Provides a Moving Look at Neptune’s Stormy Disposition. Science Daily
Magazine, Oct. 15, 1998. URL:
http://www.sciencedaily.com/releases/1998/10/981014075103.htm
[107] “We’re not the only ones experiencing global warming… Neptune’s
largest moon, Triton, seems to have heated up significantly since the
Voyager space probe visited it in 1989…
“At least since 1989, Triton has been undergoing a period of global warming.
Percentage-wise, it’s a very large increase,” said James L. Elliot, (MIT)
professor of Earth, Atmospheric and Planetary Sciences and director of the
Wallace Astrophysical Observatory. The 5 percent increase on the absolute
temperature scale from about minus-392 degrees Fahrenheit to about minus-389
degrees Fahrenheit would be like the Earth experiencing a jump of about 22
degrees Fahrenheit.”
Halber, Deborah. MIT researcher finds evidence of global warming on
Neptune’s largest moon. MIT News, June 24, 1998. URL:
http://web.mit.edu/newsoffice/nr/1998/triton.html
[108] “Elliot and his colleagues explain that Triton’s warming trend may be
driven by seasonal changes in its polar ice caps… The scientists are basing
a rise in Triton’s surface temperature on the Hubble telescope’s detection
of an increase in the moon’s atmospheric pressure, which has at least
doubled in bulk since the time of the Voyager encounter… Elliot says
scientists can infer a temperature rise of two Kelvin (three degrees
Fahrenheit) over nine years.”
Savage, Don, Weaver, Donna and Halber, Deborah. Hubble Space Telescope Helps
Find Evidence that Neptune’s Largest Moon Is Warming Up. HubbleSite
NewsCenter, June 24, 1998, no. 23. URL:
http://hubblesite.org/newscenter/newsdesk/archive/releases/1998/23/text/
[109] Britt, Robert Roy. Puzzling Seasons and Signs of Wind Found on Pluto. Space.com, 2003:
http://www.space.com/scienceastronomy/pluto_seasons_030709.html
[110] “Seasonal change on Pluto is causing the planet to warm up even as it
moves away from the Sun…”
Britt, Robert Roy. Puzzling Seasons and Signs of Wind Found on Pluto.
Space.com, 2003:
http://www.space.com/scienceastronomy/pluto_seasons_030709.html
[111] “BIRMINGHAM, Ala.—Pluto is undergoing global warming, as evidenced by
a three-fold [300%] increase in the planet’s
atmospheric pressure during the
past 14 years…
A 1997 occultation of a star by [Neptune’s moon] Triton revealed that its
surface had warmed since the Voyager spacecraft first explored it in 1989…
Elliot said… “the changes observed in Pluto’s atmosphere are much more
severe [than on Triton]. The change observed on Triton was subtle. Pluto’s
changes are not subtle…“This is a very complex process, and we just don’t
know what is causing these effects” on Pluto’s surface, Elliot said. “That’s
why you need to send a mission.””
Halber, Deborah. Pluto is undergoing global warming, researchers find. MIT
News, Oct. 9. 2002. URL:
http://web.mit.edu/newsoffice/nr/2002/pluto.html
[112] “Elliot said the new results seem counterintuitive, because observers
assumed Pluto’s atmosphere would begin to collapse as it cooled. In fact,
the temperature of Pluto’s mostly nitrogen atmosphere has increased around 1
degree Celsius since it was closest to the sun in 1989.”
Halber, Deborah. Pluto’s Atmopshere is Expanding, Researchers Say.
Massachusetts Institute of Technology Spaceflight Now News Release, July 9,
2003. URL:
http://www.spaceflightnow.com/news/n0307/09pluto/
[113] “Jay Pasachoff, an astronomy professor at Williams College, said that
Pluto’s global warming was “likely not connected with that of the Earth. The
major way they could be connected is if the warming was caused by a large
increase in sunlight. But the solar constant—the amount of sunlight received
each second—is carefully monitored by spacecraft, and we know the sun’s
output is much too steady to be changing the temperature of Pluto."
Halber, Deborah. Pluto is undergoing global warming, researchers find. MIT
News, Oct. 9. 2002. URL:
http://web.mit.edu/newsoffice/nr/2002/pluto.html
[114]
"Seasonal change is a possible but not proven explanation," Elliot
told SPACE.com. "Another possibility would be some longer term change,
analogous to long-term climatic changes on Earth."
Britt, Robert Roy. Puzzling Seasons and Signs of Wind Found on Pluto.
Space.com, 2003:
http://www.space.com/scienceastronomy/pluto_seasons_030709.html
[115] Britt, Robert Roy. Puzzling Seasons and Signs of Wind Found on Pluto. Space.com, 2003:
http://www.space.com/scienceastronomy/pluto_seasons_030709.html
.
|