
from
Transparency Website
-
The Corruption Perceptions Index
(CPI)
table shows a country's ranking and score, the number of surveys
used to determine the score, and the confidence range of the
scoring.
-
The rank shows how one country compares
to others included in the index. The CPI score indicates the
perceived level of public-sector corruption in a country/territory.
-
The CPI is based on 13 independent
surveys. However, not all surveys include all countries. The surveys
used column indicates how many surveys were relied upon to determine
the score for that country.
-
The confidence range indicates the
reliability of the CPI scores and tells us that allowing for a
margin of error, we can be 90% confident that the true score for
this country lies within this range.
|
Rank
|
Country/Territory
|
CPI 2009 Score
|
Surveys Used
|
Confidence Range
|
|
1 |
New Zealand |
9.4 |
6 |
9.1 - 9.5 |
|
2 |
Denmark |
9.3 |
6 |
9.1 - 9.5 |
|
3 |
Singapore |
9.2 |
9 |
9.0 - 9.4 |
|
3 |
Sweden |
9.2 |
6 |
9.0 - 9.3 |
|
5 |
Switzerland |
9.0 |
6 |
8.9 - 9.1 |
|
6 |
Finland |
8.9 |
6 |
8.4 - 9.4 |
|
6 |
Netherlands |
8.9 |
6 |
8.7 - 9.0 |
|
8 |
Australia |
8.7 |
8 |
8.3 - 9.0 |
|
8 |
Canada |
8.7 |
6 |
8.5 - 9.0 |
|
8 |
Iceland |
8.7 |
4 |
7.5 - 9.4 |
|
11 |
Norway |
8.6 |
6 |
8.2 - 9.1 |
|
12 |
Hong Kong |
8.2 |
8 |
7.9 - 8.5 |
|
12 |
Luxembourg |
8.2 |
6 |
7.6 - 8.8 |
|
14 |
Germany |
8.0 |
6 |
7.7 - 8.3 |
|
14 |
Ireland |
8.0 |
6 |
7.8 - 8.4 |
|
16 |
Austria |
7.9 |
6 |
7.4 - 8.3 |
|
17 |
Japan |
7.7 |
8 |
7.4 - 8.0 |
|
17 |
United Kingdom |
7.7 |
6 |
7.3 - 8.2 |
|
19 |
United States |
7.5 |
8 |
6.9 - 8.0 |
|
20 |
Barbados |
7.4 |
4 |
6.6 - 8.2 |
|
21 |
Belgium |
7.1 |
6 |
6.9 - 7.3 |
|
22 |
Qatar |
7.0 |
6 |
5.8 - 8.1 |
|
22 |
Saint Lucia |
7.0 |
3 |
6.7 - 7.5 |
|
24 |
France |
6.9 |
6 |
6.5 - 7.3 |
|
25 |
Chile |
6.7 |
7 |
6.5 - 6.9 |
|
25 |
Uruguay |
6.7 |
5 |
6.4 - 7.1 |
|
27 |
Cyprus |
6.6 |
4 |
6.1 - 7.1 |
|
27 |
Estonia |
6.6 |
8 |
6.1 - 6.9 |
|
27 |
Slovenia |
6.6 |
8 |
6.3 - 6.9 |
|
30 |
United Arab Emirates
|
6.5 |
5 |
5.5 - 7.5 |
|
31 |
Saint Vincent and the Grenadines
|
6.4 |
3 |
4.9 - 7.5 |
|
32 |
Israel |
6.1 |
6 |
5.4 - 6.7 |
|
32 |
Spain |
6.1 |
6 |
5.5 - 6.6 |
|
34 |
Dominica |
5.9 |
3 |
4.9 - 6.7 |
|
35 |
Portugal |
5.8 |
6 |
5.5 - 6.2 |
|
35 |
Puerto Rico |
5.8 |
4 |
5.2 - 6.3 |
|
37 |
Botswana |
5.6 |
6 |
5.1 - 6.3 |
|
37 |
Taiwan |
5.6 |
9 |
5.4 - 5.9 |
|
39 |
Brunei Darussalam |
5.5 |
4 |
4.7 - 6.4 |
|
39 |
Oman |
5.5 |
5 |
4.4 - 6.5 |
|
39 |
Korea (South) |
5.5 |
9 |
5.3 - 5.7 |
|
42 |
Mauritius |
5.4 |
6 |
5.0 - 5.9 |
|
43 |
Costa Rica |
5.3 |
5 |
4.7 - 5.9 |
|
43 |
Macau |
5.3 |
3 |
3.3 - 6.9 |
|
45 |
Malta |
5.2 |
4 |
4.0 - 6.2 |
|
46 |
Bahrain |
5.1 |
5 |
4.2 - 5.8 |
|
46 |
Cape Verde |
5.1 |
3 |
3.3 - 7.0 |
|
46 |
Hungary |
5.1 |
8 |
4.6 - 5.7 |
|
49 |
Bhutan |
5.0 |
4 |
4.3 - 5.6 |
|
49 |
Jordan |
5.0 |
7 |
3.9 - 6.1 |
|
49 |
Poland |
5.0 |
8 |
4.5 - 5.5 |
|
52 |
Czech Republic |
4.9 |
8 |
4.3 - 5.6 |
|
52 |
Lithuania |
4.9 |
8 |
4.4 - 5.4 |
|
54 |
Seychelles |
4.8 |
3 |
3.0 - 6.7 |
|
55 |
South Africa |
4.7 |
8 |
4.3 - 4.9 |
|
56 |
Latvia |
4.5 |
6 |
4.1 - 4.9 |
|
56 |
Malaysia |
4.5 |
9 |
4.0 - 5.1 |
|
56 |
Namibia |
4.5 |
6 |
3.9 - 5.1 |
|
56 |
Samoa |
4.5 |
3 |
3.3 - 5.3 |
|
56 |
Slovakia |
4.5 |
8 |
4.1 - 4.9 |
|
61 |
Cuba |
4.4 |
3 |
3.5 - 5.1 |
|
61 |
Turkey |
4.4 |
7 |
3.9 - 4.9 |
|
63 |
Italy |
4.3 |
6 |
3.8 - 4.9 |
|
63 |
Saudi Arabia |
4.3 |
5 |
3.1 - 5.3 |
|
65 |
Tunisia |
4.2 |
6 |
3.0 - 5.5 |
|
66 |
Croatia |
4.1 |
8 |
3.7 - 4.5 |
|
66 |
Georgia |
4.1 |
7 |
3.4 - 4.7 |
|
66 |
Kuwait |
4.1 |
5 |
3.2 - 5.1 |
|
69 |
Ghana |
3.9 |
7 |
3.2 - 4.6 |
|
69 |
Montenegro |
3.9 |
5 |
3.5 - 4.4 |
|
71 |
Bulgaria |
3.8 |
8 |
3.2 - 4.5 |
|
71 |
FYR Macedonia |
3.8 |
6 |
3.4 - 4.2 |
|
71 |
Greece |
3.8 |
6 |
3.2 - 4.3 |
|
71 |
Romania |
3.8 |
8 |
3.2 - 4.3 |
|
75 |
Brazil |
3.7 |
7 |
3.3 - 4.3 |
|
75 |
Colombia |
3.7 |
7 |
3.1 - 4.3 |
|
75 |
Peru |
3.7 |
7 |
3.4 - 4.1 |
|
75 |
Suriname |
3.7 |
3 |
3.0 - 4.7 |
|
79 |
Burkina Faso |
3.6 |
7 |
2.8 - 4.4 |
|
79 |
China |
3.6 |
9 |
3.0 - 4.2 |
|
79 |
Swaziland |
3.6 |
3 |
3.0 - 4.7 |
|
79 |
Trinidad and Tobago |
3.6 |
4 |
3.0 - 4.3 |
|
83 |
Serbia |
3.5 |
6 |
3.3 - 3.9 |
|
84 |
El Salvador |
3.4 |
5 |
3.0 - 3.8 |
|
84 |
Guatemala |
3.4 |
5 |
3.0 - 3.9 |
|
84 |
India |
3.4 |
10 |
3.2 - 3.6 |
|
84 |
Panama |
3.4 |
5 |
3.1 - 3.7 |
|
84 |
Thailand |
3.4 |
9 |
3.0 - 3.8 |
|
89 |
Lesotho |
3.3 |
6 |
2.8 - 3.8 |
|
89 |
Malawi |
3.3 |
7 |
2.7 - 3.9 |
|
89 |
Mexico |
3.3 |
7 |
3.2 - 3.5 |
|
89 |
Moldova |
3.3 |
6 |
2.7 - 4.0 |
|
89 |
Morocco |
3.3 |
6 |
2.8 - 3.9 |
|
89 |
Rwanda |
3.3 |
4 |
2.9 - 3.7 |
|
95 |
Albania |
3.2 |
6 |
3.0 - 3.3 |
|
95 |
Vanuatu |
3.2 |
3 |
2.3 - 4.7 |
|
97 |
Liberia |
3.1 |
3 |
1.9 - 3.8 |
|
97 |
Sri Lanka |
3.1 |
7 |
2.8 - 3.4 |
|
99 |
Bosnia and Herzegovina
|
3.0 |
7 |
2.6 - 3.4 |
|
99 |
Dominican Republic |
3.0 |
5 |
2.9 - 3.2 |
|
99 |
Jamaica |
3.0 |
5 |
2.8 - 3.3 |
|
99 |
Madagascar |
3.0 |
7 |
2.8 - 3.2 |
|
99 |
Senegal |
3.0 |
7 |
2.5 - 3.6 |
|
99 |
Tonga |
3.0 |
3 |
2.6 - 3.3 |
|
99 |
Zambia |
3.0 |
7 |
2.8 - 3.2 |
|
106 |
Argentina |
2.9 |
7 |
2.6 - 3.1 |
|
106 |
Benin |
2.9 |
6 |
2.3 - 3.4 |
|
106 |
Gabon |
2.9 |
3 |
2.6 - 3.1 |
|
106 |
Gambia |
2.9 |
5 |
1.6 - 4.0 |
|
106 |
Niger |
2.9 |
5 |
2.7 - 3.0 |
|
111 |
Algeria |
2.8 |
6 |
2.5 - 3.1 |
|
111 |
Djibouti |
2.8 |
4 |
2.3 - 3.2 |
|
111 |
Egypt |
2.8 |
6 |
2.6 - 3.1 |
|
111 |
Indonesia |
2.8 |
9 |
2.4 - 3.2 |
|
111 |
Kiribati |
2.8 |
3 |
2.3 - 3.3 |
|
111 |
Mali |
2.8 |
6 |
2.4 - 3.2 |
|
111 |
Sao Tome and Principe
|
2.8 |
3 |
2.4 - 3.3 |
|
111 |
Solomon Islands |
2.8 |
3 |
2.3 - 3.3 |
|
111 |
Togo |
2.8 |
5 |
1.9 - 3.9 |
|
120 |
Armenia |
2.7 |
7 |
2.6 - 2.8 |
|
120 |
Bolivia |
2.7 |
6 |
2.4 - 3.1 |
|
120 |
Ethiopia |
2.7 |
7 |
2.4 - 2.9 |
|
120 |
Kazakhstan |
2.7 |
7 |
2.1 - 3.3 |
|
120 |
Mongolia |
2.7 |
7 |
2.4 - 3.0 |
|
120 |
Vietnam |
2.7 |
9 |
2.4 - 3.1 |
|
126 |
Eritrea |
2.6 |
4 |
1.6 - 3.8 |
|
126 |
Guyana |
2.6 |
4 |
2.5 - 2.7 |
|
126 |
Syria |
2.6 |
5 |
2.2 - 2.9 |
|
126 |
Tanzania |
2.6 |
7 |
2.4 - 2.9 |
|
130 |
Honduras |
2.5 |
6 |
2.2 - 2.8 |
|
130 |
Lebanon |
2.5 |
3 |
1.9 - 3.1 |
|
130 |
Libya |
2.5 |
6 |
2.2 - 2.8 |
|
130 |
Maldives |
2.5 |
4 |
1.8 - 3.2 |
|
130 |
Mauritania |
2.5 |
7 |
2.0 - 3.3 |
|
130 |
Mozambique |
2.5 |
7 |
2.3 - 2.8 |
|
130 |
Nicaragua |
2.5 |
6 |
2.3 - 2.7 |
|
130 |
Nigeria |
2.5 |
7 |
2.2 - 2.7 |
|
130 |
Uganda |
2.5 |
7 |
2.1 - 2.8 |
|
139 |
Bangladesh |
2.4 |
7 |
2.0 - 2.8 |
|
139 |
Belarus |
2.4 |
4 |
2.0 - 2.8 |
|
139 |
Pakistan |
2.4 |
7 |
2.1 - 2.7 |
|
139 |
Philippines |
2.4 |
9 |
2.1 - 2.7 |
|
143 |
Azerbaijan |
2.3 |
7 |
2.0 - 2.6 |
|
143 |
Comoros |
2.3 |
3 |
1.6 - 3.3 |
|
143 |
Nepal |
2.3 |
6 |
2.0 - 2.6 |
|
146 |
Cameroon |
2.2 |
7 |
1.9 - 2.6 |
|
146 |
Ecuador |
2.2 |
5 |
2.0 - 2.5 |
|
146 |
Kenya |
2.2 |
7 |
1.9 - 2.5 |
|
146 |
Russia |
2.2 |
8 |
1.9 - 2.4 |
|
146 |
Sierra Leone |
2.2 |
5 |
1.9 - 2.4 |
|
146 |
Timor-Leste |
2.2 |
5 |
1.8 - 2.6 |
|
146 |
Ukraine |
2.2 |
8 |
2.0 - 2.6 |
|
146 |
Zimbabwe |
2.2 |
7 |
1.7 - 2.8 |
|
154 |
Côte d´Ivoire |
2.1 |
7 |
1.8 - 2.4 |
|
154 |
Papua New Guinea |
2.1 |
5 |
1.7 - 2.5 |
|
154 |
Paraguay |
2.1 |
5 |
1.7 - 2.5 |
|
154 |
Yemen |
2.1 |
4 |
1.6 - 2.5 |
|
158 |
Cambodia |
2.0 |
8 |
1.8 - 2.2 |
|
158 |
Central African Republic
|
2.0 |
4 |
1.9 - 2.2 |
|
158 |
Laos |
2.0 |
4 |
1.6 - 2.6 |
|
158 |
Tajikistan |
2.0 |
8 |
1.6 - 2.5 |
|
162 |
Angola |
1.9 |
5 |
1.8 - 1.9 |
|
162 |
Congo Brazzaville |
1.9 |
5 |
1.6 - 2.1 |
|
162 |
Democratic Republic of Congo
|
1.9 |
5 |
1.7 - 2.1 |
|
162 |
Guinea-Bissau |
1.9 |
3 |
1.8 - 2.0 |
|
162 |
Kyrgyzstan |
1.9 |
7 |
1.8 - 2.1 |
|
162 |
Venezuela |
1.9 |
7 |
1.8 - 2.0 |
|
168 |
Burundi |
1.8 |
6 |
1.6 - 2.0 |
|
168 |
Equatorial Guinea |
1.8 |
3 |
1.6 - 1.9 |
|
168 |
Guinea |
1.8 |
5 |
1.7 - 1.8 |
|
168 |
Haiti |
1.8 |
3 |
1.4 - 2.3 |
|
168 |
Iran |
1.8 |
3 |
1.7 - 1.9 |
|
168 |
Turkmenistan |
1.8 |
4 |
1.7 - 1.9 |
|
174 |
Uzbekistan |
1.7 |
6 |
1.5 - 1.8 |
|
175 |
Chad |
1.6 |
6 |
1.5 - 1.7 |
|
176 |
Iraq |
1.5 |
3 |
1.2 - 1.8 |
|
176 |
Sudan |
1.5 |
5 |
1.4 - 1.7 |
|
178 |
Myanmar |
1.4 |
3 |
0.9 - 1.8 |
|
179 |
Afghanistan |
1.3 |
4 |
1.0 - 1.5 |
|
180 |
Somalia |
1.1 |
3 |
0.9 - 1.4 |
|
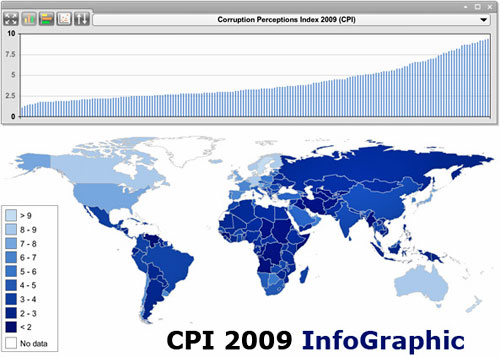
Interactive World Map
The Corruption Perceptions Index (CPI)
published by
Transparency International measures the
perceived levels of public-sector corruption in a given country.
It is a composite index drawing on different
expert and business surveys. The scale is from zero (perceived to be highly
corrupt) to ten (perceived to be highly clean). Click on the interactive map
below to launch it in a full-screen window, showing individual country
scores as well as confidence intervals.
The darker the blue, the
higher the perceived level of public sector corruption.
Source:
Transparency International
Designations used:
The depiction and use of
boundaries and geographic names on this website are not warranted to
be error free nor do they necessarily imply official endorsement or
acceptance by the
United Nations.