by nef
The New Economics Foundation
25 January 2010
from
NewEconomics Website
|
NEF is an independent
think-and-do tank that inspires and demonstrates real economic
well-being.
We aim to improve quality of life by promoting innovative solutions
that challenge mainstream thinking on economic, environmental and
social issues. We work in partnership and put people and the planet
first.
NEF (the new economics foundation) is a registered charity founded
in 1986 by the leaders of The Other Economic Summit (TOES), which
forced issues such as international debt onto the agenda of the G8
summit meetings. It has taken a lead in helping establish new
coalitions and organizations such as the Jubilee 2000 debt campaign;
the Ethical Trading Initiative; the UK Social Investment Forum; and
new ways to measure social and economic well-being.
Schumacher College is the UK’s international green college. We are
delighted to be partnering with NEF in publishing Growth isn't
possible: Why we need a new economic direction. As with NEF,
Schumacher College owes its inspiration to the work of the radical
economist and development educator Fritz Schumacher. For twenty
years we have been running a wide range of short courses attracting
the world's leading thinkers on new economics.
Over the past two
years we have hosted two think tanks around sustainable economics
and intelligent growth, leading to a declaration on sustainable
economics, the 'E4 Declaration' and our strong support for the Green
New Deal. This year we took the decision to develop with help from NEF colleagues a post-graduate MSc course in New, or 'Transition'
Economics, the first in the country.
We will also be opening a
second campus in 2011 focusing upon the 'great re-skilling', with
the provision of a range of courses on sustainable food and farming,
renewal energy, eco design and sustainable business development,
together with launching an E Learning program.
For further
information on the courses available at Schumacher College please
see our website
www.schumachercollege.org.uk.
Schumacher College is an
initiative of The Dartington Hall Trust. |
Contents
-
Greenhouse gas emissions and current climate change
-
Scenarios of
growth and emission reductions
-
Peak Oil, Gas and Coal?
-
Carbon capture and storage
- The nuclear fusion of the
2010s?
-
The limits to nuclear
-
The hydrogen economy
-
Biofuels
-
Geoengineering
- Technological saviour or damaging distraction?
-
How much can
energy efficiency really improve?
-
Equity considerations
-
If not the
economics of global growth, then what?
- Getting an economy the
right size for the planet
Foreword
If you spend your time thinking that the most important objective of public
policy is to get growth up from 1.9 per cent to 2 per cent and even better
2.1 per cent we’re pursuing a sort of false god there. We’re pursuing it
first of all because if we accept that, we will do things to the climate
that will be harmful, but also because all the evidence shows that beyond
the sort of standard of living which Britain has now achieved, extra growth
does not automatically translate into human welfare and happiness.
Lord Adair Turner1 Chair of the UK Financial Services Authority
Anyone who believes exponential growth can go on forever in a finite world
is either a madman or an economist.
Kenneth E. Boulding Economist and co-founder of General Systems Theory
In January 2006, nef (the new economics foundation) published the report
Growth isn’t working.2 It highlighted a flaw at the heart of the general
economic strategy that relies upon global economic growth to reduce poverty.
The distribution of costs and benefits from economic growth, it
demonstrated, are highly unbalanced. The share of benefits reaching those on
the lowest incomes was shrinking. In this system, paradoxically, in order to
generate ever smaller benefits for the poorest, it requires those who are
already rich and ‘over-consuming’ to consume ever more.
The unavoidable result under business as usual in the global economy is
that, long before any general and meaningful reduction in poverty has been
won, the very life-support systems that we all rely on are almost certain to
have been fundamentally compromised.
Four years on from Growth isn’t working, this new publication, Growth isn’t
possible goes one step further and tests that thesis in detail in the
context of climate change and energy. It argues that indefinite global
economic growth is unsustainable. Just as the laws of thermodynamics
constrain the maximum efficiency of a heat engine, economic growth is
constrained by the finite nature of our planet’s natural resources (biocapacity).
As economist Herman Daly once commented, he would accept the possibility of
infinite growth in the economy on the day that one of his economist
colleagues could demonstrate that Earth itself could grow at a commensurate
rate.3
Whether or not the stumbling international negotiations on climate change
improve, our findings make clear that much more will be needed than simply
more ambitious reductions in greenhouse gas emissions.
This report concludes
that a new macro economic model is needed, one that allows the human
population as a whole to thrive without having to relying on ultimately
impossible, endless increases in consumption.
Andrew Simms
Victoria Johnson
January 2010
Back to Contents
Introduction
We really have to come up with new metrics and new measures by which we look
at economic welfare in a much larger context than just measuring GDP, which
I think is proving to be an extremely harmful way of measuring economic
progress.
R K Pachauri Ph.D,4
Chairman, Intergovernmental Panel on Climate Change
Director-General, The Energy and Resources Institute, Director, Yale Climate
and Energy Institute
Towards what ultimate point is society tending by its industrial progress?
When the progress ceases, in what condition are we to expect that it will
leave mankind?
John Stuart Mill (1848) 5
From birth to puberty a hamster doubles its weight each week. If, then,
instead of levelling-off in maturity as animals do, the hamster continued to
double its weight each week, on its first birthday we would be facing a nine
billion tonne hamster. If it kept eating at the same ratio of food to body
weight, by then its daily intake would be greater than the total, annual
amount of maize produced worldwide.6
There is a reason that in nature things
do not grow indefinitely.
The American economist Herman Daly argues that growth’s first, literal
dictionary definition is,
‘…to spring up and develop to maturity. Thus the
very notion of growth includes some concept of maturity or sufficiency,
beyond which point physical accumulation gives way to physical
maintenance’.7
In other words, development continues but growth gives way to
a state of dynamic equilibrium - the rate of inputs are equal to the rate of
outputs so the composition of the system is unchanging in time.8
For
example, a bath would be in dynamic equilibrium if water flowing in from the
tap escapes down the plughole at the same rate. This means the total amount
of water in the bath does not change, despite being in a constant state of
flux.
In January 2006, nef (the new economics foundation) published the report
Growth isn’t working.9
It highlighted a flaw at the heart of the economic
strategy that relies overwhelmingly upon economic growth to reduce poverty.
The distribution of costs and benefits from global economic growth, it
demonstrated, are highly unbalanced. The share of benefits reaching those on
the lowest incomes was shrinking. In this system, paradoxically, in order to
generate ever smaller benefits for the poorest, it requires those who are
already rich and ‘over-consuming’ to consume ever more.
The unavoidable result, the report points out, is that, with business as
usual in the global economy, long before any general and meaningful
reduction in poverty has been won, the very life-support systems we all rely
on are likely to have been fundamentally compromised.
Four years on from Growth isn’t working, Growth isn’t possible goes one step
further and tests that thesis in detail in the context of climate change and
energy. It argues that indefinite global economic growth is unsustainable.
Just as the laws of thermodynamics constrain the maximum efficiency of a
heat engine, economic growth is constrained by the finite nature of our
planet’s natural resources (biocapacity).
As Daly once commented, he would
accept the possibility of infinite growth in the economy on the day that one
of his economist colleagues could demonstrate that Earth itself could grow
at a commensurate rate.10
The most recent data on human use of biocapacity sends a number of
unfortunate signals for believers in the possibility of unrestrained growth.
Our global ecological footprint is growing, further overshooting what the
biosphere can provide and absorb, and in the process, like two trains
heading in opposite directions, we appear to be actually shrinking the
available biocapacity on which we depend.
Globally we are consuming nature’s services - using resources and creating
carbon emissions - 44 per cent faster than nature can regenerate and
reabsorb what we consume and the waste we produce. In other words, it takes
the Earth almost 18 months to produce the ecological services that humanity
uses in one year.
The UK’s footprint has grown such that if the whole world
wished to consume at the same rate it would require 3.4 planets like
Earth.11
Growth forever, as conventionally defined (see Box 1), within fixed, though
flexible, limits isn’t possible. Sooner or later we will hit the biosphere’s
buffers. This happens for one of two reasons. Either a natural resource
becomes over-exploited to the point of exhaustion, or because more waste is
dumped into an ecosystem than can be safely absorbed, leading to dysfunction
or collapse. Science now seems to be telling us that both are happening, and
sooner, rather than later.
Yet, for decades, it has been a heresy punishable by career suicide for
economists (or politicians) to question orthodox economic growth.
As the
British MP Colin Challen quipped in 2006,
‘We are imprisoned by our
political Hippocratic oath: we will deliver unto the electorate more goodies
than anyone else.’12
|
Box 1: What is growth?
The question is deceptive,
because the word has many applications. They range from the
description of biological processes to more abstract notions of
personal development. But, when used to describe the economy, growth
has a very specific meaning. This often causes confusion.
Growth tends to be used synonymously with all things that are good.
Plants grow, children grow, how could that be bad? But, of course,
even in nature, growth can be malign, as in the case of cancer
cells.
In economics ‘growth’, or the lack of it, describes the trajectory
of Gross Domestic Product and Gross National Product, two slightly
different measures of national income (they differ, basically, only
in that one includes earnings from overseas assets). The value of
imports is deducted and the value of exports added.
Hence, an economy is said to be growing if the financial value of
all the exchanges of goods and services within it goes up. The
absence of growth gets described, pejoratively, as recession.
Prolonged recessions are called depressions.
Yet, it is not that simple. An economy may grow, for example,
because money is being spent on clearing up after disasters,
pollution, to control rising crime or widespread disease. You may
also have ‘jobless growth,’ in which the headline figure for GDP
rises but new employment is not generated, or environmentally
destructive growth in which a kind of false monetary value is
created by liquidating irreplaceable natural assets on which
livelihoods depend.
The fact that an economy is growing tells you nothing about the
‘quality’ of economic activity that is happening within it.
Conversely, history shows that in times of recession, life
expectancy can rise, even as livelihoods are apparently harmed. This
happens in rich countries probably due to force of circumstances, as
people become healthier by consuming less and exercising more, using
cheaper, more active forms of transport such as walking and cycling.
It is possible, in other words, to have both ‘economic’ and
‘uneconomic’ growth and we should not assume that growth per se is a
good thing, to be held on to at all costs. |
The growth debate: historical context
There is a kind of reverse political correctness that prevents growth being
debated properly.
Yet this has not always been true. Historically, there
have been vigorous debates on the optimal scale for the economy, which we
survey briefly towards the end of this report (also summarized in Box 2
below).
More familiarly, the 1960s and early 1970s saw a vigorous debate on the
environmental implications of growth. But this was sometimes hampered by
insufficient data. Scientists at the Massachusetts Institute of Technology
(MIT) were commissioned by the
Club of Rome to research and publish the
controversial Limits to growth, which came out in 1972. Since then, the
original report has been successively revised and republished.
Matthew Simmons, founder of the world’s largest energy investment banking
firm, commented on publication of the 2004 update that its message was more
relevant than ever and that we, ‘wasted 30 valuable years of action by
misreading the message of the first book’.13
Originally dismissed and
criticized for ‘crying wolf’, the report has, in fact, stood the test of
time. A study in 2008 by physicist Graham Turner from CSIRO (Commonwealth
Scientific and Industrial Research Organization), Australia’s leading
scientific research institute, compared its original projections with 30
years of subsequent observed trends and data.14 His research showed that
they ‘compared favorably’.
Less well known is that in this fairly recent period, there was also a
significant debate on the desirability of economic growth from the point of
view of social and individual, human well-being.15,16,17 It is disciplines
other than economics that have seemed able to view the issue of growth less
dogmatically, asking difficult questions and making inconvenient
observations, their views apparently less constrained by hardened doctrine.
For example, the implications of ‘doubling’, graphically represented by our
voracious hamster, were addressed in May 2007 by Roderick Smith, Royal
Academy of Engineering Research Professor at Imperial College, London. The
physical view of the economy, he said, ‘is governed by the laws of
thermodynamics and continuity’, and so, ‘the question of how much natural
resource we have to fuel the economy, and how much energy we have to
extract, process and manufacture is central to our existence.’18
Engineers must deal every day with the stuff, the material, the ‘thingyness’
of the world around them, the stresses and strains that make things stand
up, fall down, last or wear out. Because of this, they are perhaps more in
tune with the real world of resources than the economist working with
abstract mathematical simplifications of life.
Hence Smith honed in on one of the economy’s most important characteristics
- its ‘doubling period’, by which its bulk multiplies in proportion to its
current size. Even low growth rates of around 3 per cent, he points out,
lead to ‘surprisingly short doubling times’. Hence, ‘a 3 per cent growth
rate, which is typical of the rate of a developed economy, leads to a
doubling time of just over 23 years. The 10 per cent rates of rapidly
developing economies double the size of the economy in just under 7 years.’
But then, if you are concerned about humanity’s ecological debt, comes what
Smith quaintly calls the ‘real surprise’. Because, according to Smith, ‘each
successive doubling period consumes as much resource as all the previous
doubling periods combined’, just as 8 exceeds the sum of 1, 2 and 4.
Adding,
almost redundantly, as jaws in the room fall open,
‘this little appreciated
fact lies at the heart of why our current economic model is unsustainable.’
Why do economies grow?
We should ask the simple question, why do
economies grow? And, why do people worry that it will be a disaster if they
stop? The answers can be put reasonably simply.
For most countries in much of human history, having more stuff has given
human beings more comfortable lives. Also, as populations have grown, so
have the economies that housed, fed, clothed and kept them.
Yet, there has long been an understanding in the quiet corners of economics,
as well as louder protests in other disciplines, that growth cannot and need
not continue indefinitely.
As John Stuart Mill put it in 1848,
‘the increase
of wealth is not boundless: that at the end of what they term the
progressive state lies the stationary state.’19
The reasons for growth not being ‘boundless’ too, have been long known.
Even
if the modern reader has to make allowances for the time in which Mill
wrote, his meaning remains clear:
‘It is only in the backward countries of the
world that increased production is still an important object: in those
most advanced, what is economically needed is a better distribution.’20
|
Box 2. No-growth economics: a select
chronology of books and papers
In contemplating any
progressive movement, not in its nature unlimited, the mind is not
satisfied with merely tracing the laws of the movement; it cannot
but ask the further question, to what goal? Towards what ultimate
point is society tending by its industrial progress? When the
progress ceases, in what condition are we to expect that it will
leave mankind?
It must always have been seen, more or less distinctly, by political
economists, that the increase of wealth is not boundless: that at
the end of what they term the progressive state lies the stationary
state, that all progress in wealth is but a postponement of this,
and that each step in advance is an approach to it.21
John Stewart Mill, 1848
1821 On the principles of
political economy and taxation (3rd edition) by David Ricardo
(on the ‘Stationary State’)
1848 Principles of political economy by John Stuart Mill (on the
‘Stationary State’, in Book IV, Chapter VI)
1883 Human labour and the unit of energy by Sergei Podolinsky
1922 Cartesian economics by Frederick Soddy
1967 The costs of economic growth by E J Mishan
1971 The entropy law and the economic process by Nicholas
Georgescu-Roegen
1972 Limits to growth: A report for the Club of Rome’s project
on the predicament of mankind by Donella Meadows
1973 Small is beautiful: A study of economics as if people
mattered by E F Schumacher Toward a steady state economy by
Herman E Daly (ed)
1977 The economic growth debate: An assessment by E J Mishan
Social limits to growth by Fred Hirsch
1978 The economic growth debate: Are there limits to growth? By
Lawrence Pringle
1982 Overshoot by William R Catton
1987 Our common future by the World Commission on Environment
and Development
1989 Beyond the limits to growth: A report to the Club of Rome
by Eduard Pestel
1992 The growth illusion: How economic growth has enriched the
few, impoverished the many, and endangered the planet by Richard
Douthwaite and Edward Goldsmith
1995 Our ecological footprint: Reducing human impact on the
Earth by William Rees and Mathis Wackernagel
1996 Beyond growth by Herman E Daly
1997 Sustainable development: Prosperity without growth by
Michael J Kinsley
2004 Limits to growth: The 30 year update by Donella Meadows,
Jorgen Randers and Dennis Meadows Growth fetish by Clive
Hamilton
2005 Ecological debt: The health of the planet and the wealth of
nations by Andrew Simms
2006 Growth isn’t working: The unbalanced distribution of
benefits and costs from economic growth by David Woodward and
Andrew Simms
2008 Managing without growth by Peter Victor
2009 Prosperity without growth by Tim Jackson
2010 Growth isn’t possible by Andrew Simms, Victoria Johnson and
Peter Chowla.
|
So why is it, that over 160 years after Mill wrote those words, rich nations
are more obsessed than ever with economic growth?
Countries like the UK are decades past the point where increases in national
income, measured by GNP and GDP lead to similar increases in human
well-being and life expectancy.22 Yet no mainstream politician argues
against the need for economic growth.
The reasons are partly to do with policy habits, partly political posturing,
and partly because we have set our economic system up in such a way that it
has become addicted to growth.
Growth-based national accounting became popular in the 1930s as a guide to
quantify the value of government interventions to rescue economies from the
depression, and also later as a tool to aid increased production as part of
the war planning effort. But the new measurement came with a very big health
warning attached.
One of the indicator’s key architects, the economist Simon Kuznets, was
explicit about its limitations. Growth did not measure quality of life, he
made clear, and it excluded vast and important parts of the economy where
exchanges were not monetary. By this he meant, family, care and community
work - the so-called ‘core economy’ which makes society function and
civilization possible.23
So, for example, if the money economy grows at the
expense of, and by cannibalizing the services of the core economy - such as
in the way that profit driven supermarkets grow at the expense of
communities - it is a kind of false growth. Similarly if the money economy
grows simply by liquidating natural assets that are treated as ‘free income’
this, too, is a kind of ‘uneconomic growth’.
Also, it was repeatedly observed that growth in aggregate national income
couldn’t tell you anything about the nature of the economy, whether activity
was good or bad. Spending on prisons, pollution and disasters pushed up GDP
just as surely as spending on schools, hospitals and parks. But growth
nevertheless became the eclipsing indicator of an economy’s virility and
success.
Even though, in 1968, Robert Kennedy pointed out that growth
measured everything apart from ‘that which makes life worthwhile’.24
The problem with our economic system is now threefold. First, governments
plan their expenditure assuming that the economy will keep growing. If it
then didn’t grow, there would be shortfalls in government income with
repercussions for public spending. The same is true for all of us; for
example, when we plan for old age by putting our savings into pensions.
Today, though, many economies like the UK are facing this problem in any
case. Ironically, however, it comes as a direct consequence of the economic
damage caused by the behavior of weakly regulated banks, which were busy
chasing maximum rates of growth through financial speculation.
Secondly, neo-liberal economies typically put legal obligations on publicly
listed companies to grow. They make the maximization of returns to
shareholders the highest priority for management.
As major investors are
generally footloose, they are free to take their money wherever the highest
rates of return and growth are found.
|
Box 3. Climate change is not the only
limit
This report focuses mainly on
how the need to preserve a climate system that is conducive to human
society puts a limit on orthodox economic growth. But climate change
is not the only natural parameter. Other limits of our biocapacity
also need respecting if we are to maintain humanity’s environmental
life support system. Two important areas of research, described
below, provide examples of attempts to define some of those limits
and raise questions for economists and policy makers.
The Ecological Footprint 25
From a methodology first developed by the Canadian geographer
William Rees in the early 1980s, the ecological footprint is now a
well-established technique being constantly refined as available
data and understanding of ecosystems improves. It compares the
biocapacity available to provide, for example, farmland, fisheries
and forestry, as well as to absorb waste from human economic
activity, with the rate at which humanity consumes those resources
and produces waste, for example in the form of greenhouse gas
emissions.
The 2009 set of Global Footprint Accounts reveal that the human
population is demanding nature’s services, using resources and
generating CO2 emissions, at a rate that is 44 per cent faster than
what nature can replace and reabsorb. That means it takes the Earth
just under 18 months to produce the ecological services humanity
needs in one year. Very conservatively, for the whole world to
consume and produce waste at the level of an average person in the
United Kingdom, we would need the equivalent of at least 3.4 planets
like earth. Most worryingly there are signs that available
biocapacity is actually reducing, being worn out, by current levels
of overuse, setting up a negative spiral of over-consumption and
weakening capacity to provide.
Planetary boundaries
A much more recent approach, published in science journal Nature in
September 2009, uses the notion of ‘planetary boundaries.’26 The
work, co-authored by 29 leading international scientists, identifies
nine processes in the biosphere for which the researchers considered
it necessary to ‘define planetary boundaries’.
They are:
-
climate change
-
rate of biodiversity loss
(terrestrial and marine)
-
interference with the
nitrogen and phosphorus cycles
-
stratospheric ozone
depletion
-
ocean acidification
-
global freshwater use
-
change in land use
-
chemical pollution
-
atmospheric aerosol loading
Of these nine, the authors
found that three boundaries had already been transgressed: climate
change, interference with the nitrogen cycle, and biodiversity loss
(see Table 1).
Setting boundaries is complex. Earth systems change and react in
often non-linear ways. The erosion or overburdening of one system
can affect the behavior and resilience of another. As the research
points out, ‘If one boundary is transgressed, then other boundaries
are also under serious risk. For instance, significant land-use
changes in the Amazon could influence water resources as far away as
Tibet.’
Nevertheless, and even though with caveats, the authors identify
boundaries for seven of the nine processes leaving the safe
thresholds for atmospheric aerosol loading and chemical pollution
still ‘to be identified.’
The work on planetary boundaries complements (although unusually
doesn’t reference) the ecological footprint method. The latter, due
to a lack of previous research on safe rates of harvest and waste
dumping, merely produces a best assessment of full available
biocapacity and compares it to human rates of consumption and waste
generation. This conservatively, or rather generously, creates the
impression that all biocapacity might be available for human use.
The attempt to define more nuanced planetary boundaries concerning
different earth systems, is set to produce more realistic, and
almost inevitably smaller assessments of the share of the earth’s
resources and services available for safe human economic use.
Table 1.
Identifying planetary
boundaries that should not be crossed.
Limits for earth processes in
grey have already been transgressed.
 |
Thirdly, in the modern world, money is lent into existence by banks with
interest rates attached.
Because for every pound, dollar, yen or Euro
borrowed, more must be paid back, economies that function largely on
interest-bearing money have a built-in growth dynamic.
The problem extends beyond the economy. Our increasingly consumerist society
demands ever higher consumption to demonstrate social status - conspicuous
consumption.27
To see how advanced, industrialized nations might escape from
a locked-in growth dynamic, see the conclusion to this report.
First principles - the laws of thermodynamics
The first law says you can’t win, the
second law says you can’t even break even
C.P. Snow
The physicist and novelist C.P. Snow became
famous for trying to bridge the gap between the ‘two cultures’, science and
the arts. When he described the alleged division, he made reference to the
failure of those in the humanities to understand the Second Law of
Thermodynamics.
While delivering The Rede Lecture in 1959, Snow observed,
‘Once or twice I have been provoked and have asked the company how many of
them could describe the Second Law of Thermodynamics. The response was cold:
it was also negative. Yet I was asking something which is about the
scientific equivalent of: “Have you read a work of Shakespeare’s?” ’ 28
Yet, 50 years after delivering his lecture, while scientists are still
thought to be illiterate if they haven’t read Shakespeare, how many experts
in the arts would be able to explain the laws of thermodynamics?
This is not
simple point-scoring between disciplines. Politicians and civil servants
tend to be drawn from the fields of economics, politics, history and the
arts.29 This could go some way to explain why, on one level, the mainstream
political and economic establishment have little comprehension about the
finiteness of the planet’s resources and the limits to efficiency.
One representative from a conservative economic think tank was questioned on
where the resources to fuel infinite economic growth would come from. It was
at a public debate in the Dana Centre, part of the Science Museum in London.
After thinking for a moment, his answer was
confidently asserted,
‘We could mine asteroids,’ he said.
The First Law
The First Law of Thermodynamics,
formalized by nineteenth-century German physicist, Rudolf Clausius, is a
generalization of the universal law of energy conservation.30 The First
Law states that within a closed system, energy can neither be created
nor destroyed.
For example, energy within the Universe is constant, or
the amount of energy lost in a steady-state process cannot be greater
than the amount of energy gained. Thus, a measure of heat transferred
into a system will result in an increase in temperature and in the
system’s ability to do work.
The Second Law
The Second Law of Thermodynamics applies a direction to the conservation
of energy described by the First Law. It says that not all heat input
into a system can be converted into useful work.
Put simply,
transferring heat into work with 100 per cent efficiency is impossible.
Some heat will always escape into the surrounding environment as wasted
energy. Ultimately, therefore, all energy tends to heat or disorder
(entropy) and no transaction of energy from one type to another is
completely reversible.
Because the laws of thermodynamics imply that entropy will always
increase, Clausius imagined that sometime in the distant future - the
universe would eventually fall fate to a ‘heat death’. Entropy will have
increased to its maximum level and no more work could be done.
As entropy increases - ‘free energy’ or exergy decreases. This describes
the maximum useful work obtainable from an energy system at a given
state in a specified environment.
In other words, it represents the
thermodynamic ‘quality’ of an energy carrier based on the Second Law.
For example, electricity has a high degree of exergy and is widely
regarded as an efficient carrier of energy. Low-temperature hot water,
however, has low exergy and whilst it is also a carrier of energy, can
generally only be used for heating purposes.
According to the second law of thermodynamics, order (sometimes called
negative-entropy, neg-entropy) can be increased only at the expense of
generating more disorder (entropy) elsewhere.31 This means importantly
that human-created order - the emergence of structured civilization and
latterly that of advanced industrialized society - will also result in
large quantities of entropy in/on the surrounding environment.32
From this, the potential for environmental damage from economic activity
becomes clear. Industrial activities cannot continue without energy, nor
can they be generated without some environmental impact.
This observation was the basis of Herman Daly’s ‘steady-state economy’
which, building on the work of economist Nicholas Georgescu-Roegen,
challenges humanity’s failure to notice the entropic nature of the
economic process (although, it is more fairly, a specific a failure of
mainstream economics).33, 34
While the Second Law means that energy efficiency in any process can
never in reality be 100 per cent, the practical limits of energy
efficiency approached in the real world is much lower.
This is discussed
in more detail later on in the report.
Why the ‘unthinkable’ must be debated
The meaning of sustainability has been blurred since the flurry of activity
that led up to the United Nation’s 1992 Earth Summit in Brazil. Today it is
applied as much to merely sustaining economic growth as it is to preserving
a livable planet for future generations.
This mainstream view of sustainable development is quite different from
definitions of so-called ‘strong sustainability’ (Box 4 below). The ‘mainstream’
view tends to emphasize decoupling economic growth from environmental
degradation (including climate change). And, to drive that dynamic it relies
heavily on market-based initiatives - the ‘ecological modernization’ of the
economy, defined by German sociologist Joseph Huber as a twin process of
‘ecologising the economy’ and ‘economising ecology’.35
Ecological modernization assumes that already existing political, economic
and social institutions can adequately deal with environmental problems - focusing, almost exclusively on industrialism, with much less consideration
(if any at all) being given to the accumulative process of capitalism,
military power or the nation-sate system, even though all contribute in
different ways to environmental degradation by being instrumental to growth
and international competitiveness.36
Policies of environmental or ecological modernization include: the ‘polluter
pays’ principle, eco-taxes, government purchasing initiatives, consumer
education campaigns and instituting voluntary eco-labeling schemes. Such a
strategy relies on small acts of individual consumer sovereignty
(sustainable consumption) to change the market.37
The growing emphasis on
the individual to practice sustainable consumption as a cure-all, however,
is awkwardly juxtaposed against the systemic nature of the problems. There
is now a growing view and body of evidence that ecological modernization has
not been effective in reducing carbon emissions. In fact, some would argue
it has acted in the opposite direction, driving emissions upwards.
Environmental debates, therefore, seem caught between paralyzing catastrophe
scenarios, and ill-thought-out technological optimism. We are told that
either the planet would like to see the back of us, or that we can have the
planet and eat it. The truth, as ever, is more complex and interesting.
The point of this report, Growth isn’t possible, is to remove an obstacle to
exploring the possibilities in that more nuanced reality.
Mainstream
economics is frozen in its one-eyed obsession with growth. Across the
political spectrum of governments, pursuing international competitiveness
and a rising GDP is still seen as panacea for social, economic and
environmental problems. Unfortunately, a combination of the science of
climate change, natural resource accounting, economic realities and the laws
of physics tell us that this assertion has become quite detached from
reality.
Our earlier report, Growth isn’t working, showed that global
economic growth is a very inefficient way to reduce poverty, and is becoming
even less so.
Why growth isn’t working
Between 1990 and 2001, for every $100
worth of growth in the world’s income per person, just $0.60, down from
$2.20 the previous decade, found its target and contributed to reducing
poverty below the $1-a-day line.38
A single dollar of poverty reduction took
$166 of additional global production and consumption, with all its
associated environmental impacts. It created the paradox that ever smaller
amounts of poverty reduction amongst the poorest people of the world
required ever larger amounts of conspicuous consumption by the rich.
Growth wasn’t (and still isn’t) working.39 Yet, so deeply engrained is the
commitment to growth, that to question it is treated as a challenge to the
whole exercise of economics. Nothing could be further from the truth. This
report is a companion volume to nef’s earlier and ongoing research. It is
written in the hope that we can begin to look at the fascinating
opportunities for economics that lie beyond the doctrine - it could be
called dogma - of growth.
One of the few modern economists to have imagined such possibilities in any
depth is Herman Daly.40
The kind of approach called for in a world
constrained by fuzzy but fundamental limits to its biocapacity is one,
according to Daly, that is:
‘…a subtle and complex economics of
maintenance, qualitative improvements, sharing frugality, and adaptation
to natural limits. It is an economics of better, not bigger’.41
|
Box 4. Sustainable development?
Civil servant and environmental
economist, Michael Jacobs described six core ideals and themes
within sustainable development.
These include:42
-
The integration of the
economy and environment: economic decisions to have regard to
their environmental consequences
-
Intergenerational
obligation: current decisions and practices to take account of
their effect on future generations
-
Social justice: all people
have the equal right to an environment in which they can
flourish (or have their basic human needs met)
-
Environmental protection:
conservation of resources and protection of the non-human world
-
Quality of life: a wider
definition of human well-being beyond narrowly defined economic
prosperity
-
Participation: institutions
to be restructured to allow all voices to be heard in
decision-making (procedural justice)
The core ideals cover three
fields - the environment, economy and society - the three pillars of
sustainability. A view of sustainable development that encompasses
all three dimensions can be defined as ‘strong sustainability’.
According to Andrew Dobson, Professor of Politics at Keele
University, ‘strong sustainability’ will require, ‘radical changes
in our relation with the non-human natural world, and in our mode of
social and political life’.43 |
Relying on the wished-for trickle-down of income from global growth as the
main economic strategy to meet human needs, maximize well-being and achieve
poverty reduction appears ineffective, frequently counter-productive and is
in all practical senses, impossible.
Given current, highly unequal patterns of the distribution of benefits from
growth, to get everyone in the world onto an income of at least $3 per day - the level around which income stops having an extreme effect on life
expectancy - implies, bizarrely, the need for 15 planets’ worth of resources
to sustain the requisite growth. Even then, environmental costs would fall
disproportionately, and counter-productively, on the poorest - the very
people the growth is meant to benefit.44
So, globally, including in relatively rich countries, there is a danger of
locking in a self-defeating spiral of over-consumption by those who are
already wealthy, justified against achieving marginal increases in wealth
amongst the poorest members of society.
Another assault on the doctrine of growth stems from the large but still
emerging field of studying life-satisfaction and human well-being. It
presents a critique of how, in industrialized countries, patterns of work
and rising consumption are promoted and pursued that repeatedly fail to
deliver the expected gains in life satisfaction. At the same time, these
patterns of (over)work potentially erode current well-being by undermining
family relationships and the time needed for personal development.45
The assumption that by increasing efficiency, whether it is energy
efficiency or resource efficiency, will allow us to continue along the same,
ever expanding consumption path is wrong. It does, however, allow us to
skirt around the bigger issue relating to work-and-spend lifestyles that
developed nations have become so accustomed to, and which are
unquestioningly assumed to be the correct and best development models for
developing nations.
In fact, a growing body of literature shows that once people have enough to
meet their basic needs and are able to survive with reasonable comfort,
higher levels of consumption do not tend to translate into higher levels of
life satisfaction, or well-being.46
Instead, people tend to adapt relatively
quickly to improvements in their material standard of living, and soon
return to their prior level of life satisfaction. This is known as becoming
trapped on the ‘hedonic treadmill’, whereby ever higher levels of
consumption are sought in the belief that they will lead to a better life,
whilst simultaneously changing expectations leave people in effect having to
‘run faster’, consuming more, merely to stand still.
National trends in subjective life satisfaction (an important predictor of
other hard, quantitative indicators such as health) stay stubbornly flat
once a fairly low level of GDP per capita is reached.47 And, importantly,
only around 10 per cent of the variation in subjective happiness observed in
western populations is attributable to differences in actual material
circumstances, such as income and possessions.48
Figure 1 shows the results of an online survey of life satisfaction and
consumption in Europe, gathered by nef. The web-based survey contained
questions about lifestyle - consumption patterns, diet, health, family
history - as well as subjective life satisfaction. Using this data,
estimates of footprint and life expectancy could be calculated.
Over 35,000
people in Europe completed the survey.
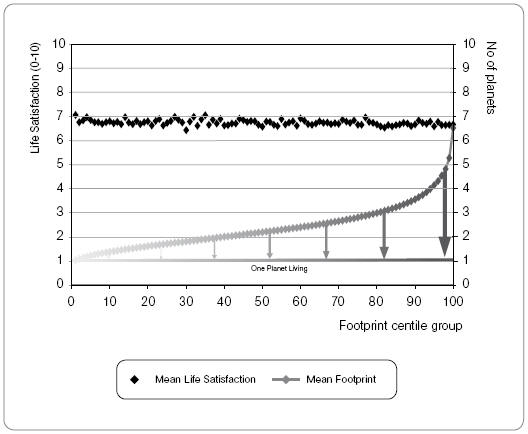
Figure 1:
Life satisfaction
compared to levels of material consumption in Europe.49
The blue line represents the distribution of
ecological footprints across the total sample, expressed in terms of the
number of planets’ worth of resources that would be required if everyone on
the planet were to live the same way.
To the right end of the distribution
are those people with high consumption lifestyles, approaching ‘seven planet
living’. To the left are those whose lifestyles have the least environmental
impact, approaching the planetary fair share ‘one planet living’.
The arrows
depict the nature of the transition that is required both to level and lower
the consumption playing field towards equitable and sustainable use of the
Earth’s resources.
This data represents both a challenge and an opportunity. It is challenging
because it shows starkly the extent of European over-use of planetary
resources. Not only is the distribution of footprint extremely unequal in
this sample, it is also far too high in absolute terms.
But, Figure 1 also
suggests that well-being has little to do with consumption; which, in turn,
allows for the possibility that our collective footprint could be reduced
significantly without leading to widespread loss in well-being.
As one
analyst put it, an initial reduction in energy use of around one-quarter
‘would call for nothing more than a return to levels that prevailed just a
decade or no more than a generation ago’, adding rhetorically:
‘How could
one even use the term sacrifice in this connection? Did we live so
unbearably 10 or 30 years ago that the return to those consumption levels
cannot be even publicly contemplated by serious policymakers?’58
|
Box 5. Life rage
Economic growth is indeed
triumphant, but to no point. For material prosperity does not
make humans happier: the ‘triumph of economic growth’ is not a
triumph of humanity over material wants; rather it is the
triumph of material wants over humanity.50
Professor Richard
Layard, London School of Economics
Studies over the past decade,
using both qualitative and quantitative methods, reveal levels of
anger and moral anxiety about changes in society that were not
apparent 30 years ago.51 Whilst these studies mainly focused on the
UK, the USA and Australia, the findings are, to varying degrees,
applicable to other high-consuming industrialized nations. In other
words, our levels of well-being are being eroded. But why?
Research shows that the strong relationship between life expectancy
and income levels-off at a remarkably low level. The influence of
rising income on life satisfaction levels-off at higher levels, but
not much higher.52,53 Life expectancy continues to rise in most
countries and this is only partly due to greater wealth; happiness
has not increased in recent decades in rich nations, despite on
average, people have become much wealthier.54
Social epidemiologist, Professor Richard Wilkinson argues in his
book Impact of inequality: how to make sick societies healthier that
poorer nations with lower wealth inequality tend to have higher
levels of well-being (physical and mental) than more wealthy but
more unequal nations.55
For example, life expectancy in rich nations
shows a strong correlation with relative equality. His more recent
work with co-author Professor Kate Pickett, The Spirit Level, makes
an even stronger case.56 Here they demonstrate that more equal
societies almost always do better against a wide range of social and
environmental indicators.
In Impact of inequality Wilkinson compared various social indicators
in Greece to those in the USA. He found that while Greece has almost
half the per capita GDP, citizens have a longer life expectancy than
the USA. While globally, the USA is the wealthiest nation, it has
one of the highest levels inequality and lowest life expectancy in
the global North.
Furthermore, Wilkinson demonstrates that crime
rates are most strongly correlated to a nation’s level of
inequality, rather than its aggregated wealth. Given this, Wilkinson
concludes that the most equal countries tend to have the highest
levels of trust and social capital.
As Nicholas Georgescu-Roegen, one of the fathers of ecological
economics argues, as we have become caught up in our obsession with
consumption and material throughput, we have failed to recognise the
‘immaterial flux of the enjoyment of life’.57 |
Despite this, high-consuming lifestyles seem ‘locked-in’ by our economic,
technological and cultural context, which fails to address equality and
instead drives relative poverty.
As the gap between the ‘haves’ and
‘have-nots’ widens, there tends to be a concomitant loss of life
satisfaction, sense of community and, ultimately, a rise in social
disequilibrium.
For example, in an update to the infamous Whitehall Study led by Professor
Michael Marmot at the Department of Epidemiology and Public Health at
University College London, researchers found that subjective socio-economic
status was a better predictor of health status and decline in health status
over time than more objective measures.59,60
This work implies the health impacts of relative poverty are more likely to
be determined by an individual’s perception of his or her socio-economic
status than, beyond a certain level of sufficient consumption, their actual
socio-economic circumstances.
Therefore perceived socio-economic barriers
can act as a barrier to progressive improvements in overall well-being, as
the physical and mental well-being of those in the lowest strata is
undermined, creating domino effects throughout society.
There are questions to be asked of growth, of its science-based limits, and
more generally of its effectiveness today in meeting human needs and
maximizing well-being. This report suggests that we are reaching the point
at which the doctrine of global economic growth as a central policy
objective and primary strategy for meeting society’s various needs is
becoming redundant.
Later in this report we will argue that focusing only on improvements in
carbon and energy intensity of the economy, as a strategy to combat climate
change, means only that we are buying time, and even then very little. In a
best-case scenario, delaying arrival at critical concentrations of
greenhouse gases by 10-20 years, and in a worst-case scenario, not delaying
at all.
So let us first address the question, what is, and what should be
accepted as ‘safe’ levels of greenhouse gases in the atmosphere?
Back to Contents
Greenhouse gas
emissions and current climate change
The Earth’s climate system is currently changing at greater rates and in
patterns that are beyond the characteristics of natural variation.
The
concentration of carbon dioxide (CO2) in the atmosphere today, the most
prevalent anthropogenic greenhouse gas, far exceeds the natural range of
180-300 ppm. The present concentration is the highest during the last
800,000 years and probably during the last 20 million years.61,62,63
In the space of just 250 years, as a result of the Industrial Revolution and
changes to land use, such as the growth of cities and the felling of
forests, we have released cumulatively more than 1800 gigatonnes (Gt) of CO2
into the atmosphere.64 Global atmospheric concentrations of CO2 are now a
record 390 ppm, almost 40 per cent higher than they were at the beginning of
the Industrial Revolution.65, 66
The primary source of the increased concentration of CO2 is unequivocally
due to the burning of fossil fuels such as coal, oil, and natural gas.67
Annual fossil fuel CO2 emissions have increased year on year from an average
of 23.4 Gt CO2 per year in the 1990s to 30 Gt CO2 per year today.
To put this
in perspective, the increase in annual emissions over the past 20 years is
almost double the total emissions produced by EU27 nations each year.68
Changes in land use have also contributed significantly to increasing rates
of CO2 emissions, contributing around 5.5 Gt CO2 per year to the atmosphere.
We now release just over 1000 tonnes of CO2 into the Earth’s atmosphere
every second.
In 2007, the Intergovernmental Panel on Climate Change (IPCC) Fourth
Assessment Report - a synthesis of peer-reviewed research on climate change,
its causes and effects (including socio-economic consequences) involving
over 2500 scientists worldwide - stated that if fossil fuels continued to be
burnt at the current rate, global average surface temperatures could rise by
4°C by the end of the century, with an uncertainty range of 2.4-6.4°C.69
A more recent study published in the American science journal Proceedings of
the National Academy of Sciences found that the ‘committed’ level of warming
by the end of the century is 2.4°C (1.4-4.3°C) - if atmospheric
concentrations of greenhouse gases are held at 2005 levels. This value is
based on past emissions and includes the warming already observed of 0.76°C
plus 1.6°C of additional warming which is yet to occur due to the thermal
inertia of the climate system and the ‘masking’ by cooling aerosols.70
Although 2008 may have been the coolest year of the current decade, it was
still the tenth warmest year since instrumental records began in 1850.71
While observations actually suggest that global temperature rise has slowed
during the last decade, analyses of observations and modeling studies show
that this is due to internal climate variability and that the warming trend
will resume in the next few years.72,73
One of the studies by atmospheric scientists Professors Kyle Swanson and
Anastasios Tsonis ends with the following cautionary note:
‘…there is no
comfort to be gained by having a climate with a significant degree of
internal variability, even if it results in a near-term cessation of global
warming…If the role of internal variability in the climate system is as
large as this analysis would suggest, warming over the 21st century may well
be larger than that predicted by the current generation of models’.74
Indeed, over the course of 2008 and 2009 numerous scientific papers were
published revealing that climate change was far more serious even than
reported in the most recent review of the science by the IPCC.75,76
The
long-term warming trend has had a large impact on mountain glaciers and snow
cover worldwide, and also changes in rainfall patterns and intensity, ocean
salinity, wind patterns and aspects of extreme weather including droughts,
heavy precipitation, heat waves and the intensity of tropical cyclones. Such
changes to the biophysical world are already having harmful impacts on
society, which will worsen with time.
As Professor Stefan Rahmstorf of the Potsdam Institute for Climate Impact
Research reflected in 2007:
‘As climatologists, we’re often under fire
because of our pessimistic message, and we’re accused of overestimating the
problem… But I think the evidence points to the opposite - we may have been
underestimating it.’77
Two years on, at International Scientific Congress on
Climate Change in March 2009, Rahmstorf confirmed this view.
‘What we are
seeing now is that some aspects are worse than expected’, he said speaking
at a plenary session of the Congress. He continued: ‘I’m frustrated, as are
many of my colleagues, that 30 years after the US National Academies of
Science issued a strong warning on CO2 warming, the full urgency of this
problem hasn’t dawned on politicians and the general public.’78
Dangerous climate change
Science on its own cannot give us the answer to the question of how much
climate change is too much.
Margaret Beckett speaking at the Avoiding Dangerous Climate Change
Conference (February 2005)
Margaret Beckett’s comments highlight the ethical and political dilemma of
what constitutes a tolerable degree of climate change. Science can tell us
what may happen as the temperature rises, but only we can decide what is
tolerable and how far climate change should be allowed to go.
The United Nations Framework Convention on Climate Change (UNFCCC) was
signed by over 160 countries at the United Nations Conference on Environment
and Development held in Rio de Janeiro in June 1992, and came into force in
1994. The objective of the Convention was to slow and stabilize climate
change by establishing an overall framework for intergovernmental efforts to
respond to climate change.
It recognizes the significance of climate change
and the uncertainties associated with future projections. But it also states
that despite uncertainties, mitigating action should be taken - namely a ‘no
regrets’ approach. Furthermore, it recognizes the responsibility of
developed nations to take the lead due to their historical emissions, and
therefore responsibility.
The long-term objective of the Convention, outlined in Article 2, is to
achieve:
…stabilization of greenhouse gas concentrations in the atmosphere at a level
that would prevent dangerous anthropogenic interference with the climate
system. Such a level should be achieved within a time frame sufficient to
allow ecosystems to adapt naturally to climate change, to ensure that food
production is not threatened and to enable economic development to proceed
in a sustainable manner.79
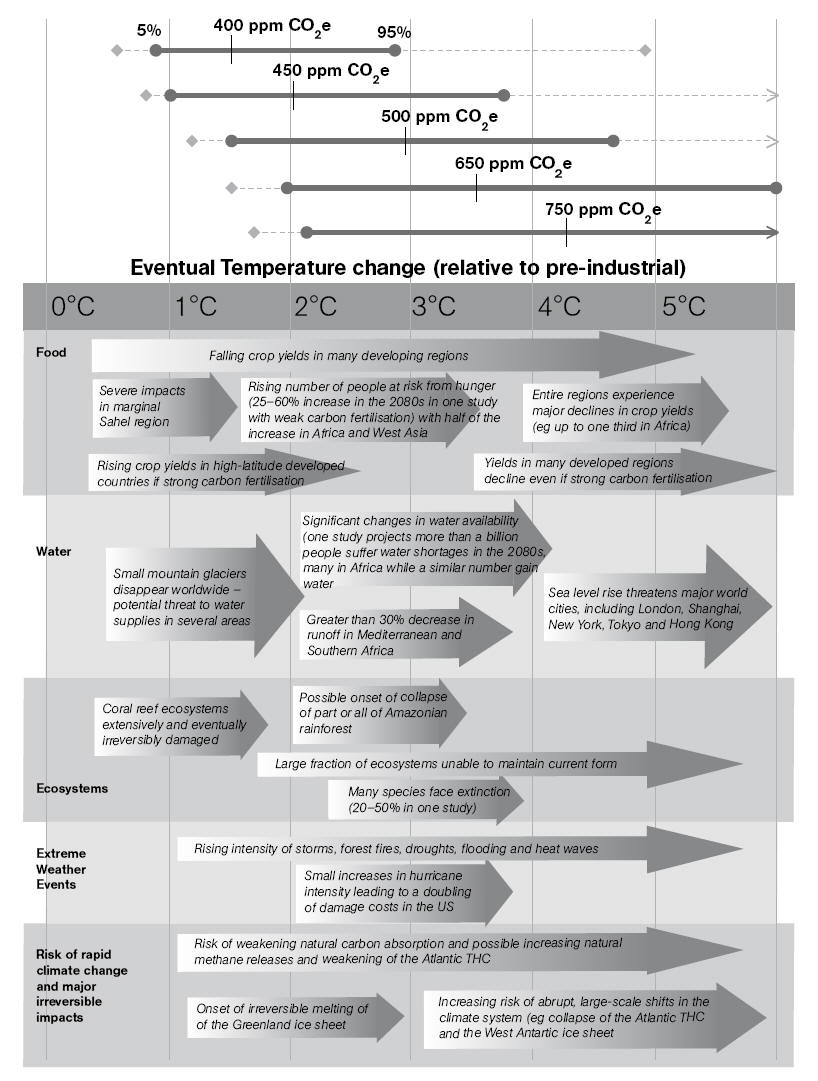
The burning embers diagram
An important part of the international climate change debate relates to the
interpretation of dangerous climate change. This is of growing importance
and of particular relevance to post-Kyoto negotiations.
In order to codify what ‘dangerous anthropogenic interference’ might mean,
authors of the Third Assessment Report of the IPCC identified ‘five reasons
for concern’.
These are listed below:80
-
Risks to unique and threatened systems - e.g., coral reefs, tropical glaciers, endangered species, unique
ecosystems, biodiversity hotspots, small island states and
indigenous communities.
-
Risk of extreme weather events - e.g.,
the frequency and intensity, or consequences of heat waves, floods,
droughts, wildfires, or tropical cyclones.
-
Distribution of impacts - some regions,
countries and populations are more at risk from climate change than
others.
-
Aggregate impacts - e.g., the
aggregation of impacts into a single metric such as monetary
damages, lives affected or lost.
-
Risks of large scale discontinuities - e.g., tipping points within the climate system such as partial or
complete collapse of the West Antarctic or Greenland ice sheet, or
collapse/reduction in the North Atlantic Overturning Circulation.
Figure 2, also known as the ‘burning embers
diagram’ is an illustration of the IPCC’s five reasons for concern.
It shows that the most potentially serious
climate change impacts (arrow heads) - expected to be experienced due to a
range of equilibrium warming temperatures projected from stabilization
levels between 400 ppm and 750 ppm of carbon dioxide equivalent (CO2e)
- typically occur after only a few degrees of warming.81
In April 2009, a team of researchers, many of whom were lead authors of the
most recent IPCC report, revised the burning embers diagram. While the
diagram was rejected from the IPCC’s Forth Assessment Report because the
artwork was also thought to be too unnerving, it was later published it in
the peer-reviewed journal Proceedings of the National Academy of Sciences.
The updated diagram showed that an even smaller
increase in global average surface temperature could lead to significant
consequences for all five elements in the ‘reasons for concern’ framework.82
Figure 2:
Burning embers diagram
83
The solid horizontal lines indicate the 5-95 per cent range based on climate
sensitivity
estimates from the IPCC 2001
and a study by one of the UK’s leading climate research unit, Hadley Centre
study.84
The vertical line indicates
the mean of the 50th per centile point.
The dashed lines show the
5-95 per cent range based on 11 recent studies.85
The bottom panel illustrates
the range of impacts expected at different levels of warming.
|
Box 6: Sea-level rise
Rising sea levels will be one
of the most significant impacts of climate change over the next
century. This is because coastal zones are home to a significant
proportion of humanity. These regions often have average population
densities three times the global mean density.86
Tidal gauge and satellite data shows a global average sea-level rise
of 1.8mm per year between 1961 and 2003.87 In recent years, however,
this rate has increased to around 3.3 ± 0.4mm per year over the
period 1993 to 2006.88 This observation is 40 per cent above the IPCC projected best-estimate rise of less than 2mm per year.
The main contribution to rising sea levels has been through thermal
expansion of the oceans, but also a contribution from melting
land-based ice (e.g. glaciers, and the Greenland and Antarctic ice
sheets).
Due to a number of uncertainties about the way that ice-sheets
behave, an accurate picture of future sea level rise is difficult to
predict. Nevertheless, melt-water from Antarctica, Greenland and
small ice caps could lead to a global sea level rise (the mean value
of local sea level taken across the ocean) of between 0.75-2 m by
the end of the century.89,90,91
However, recent research published by NASA’s James Hansen and a team
of researchers warned that destabilization of the Greenland ice
sheet is possible before global surface temperatures reach 2°C.92,93
This could lead to a sea-level rise of seven meters or more. While
this rise may occur over a number of centuries, a mechanism of
‘albedo-flip’ could result in a much more rapid sea-level rise.94
The albedo-flip is a key feedback mechanism on large ice sheets, and
occurs when snow and ice begin to melt. While snow cover has a high
albedo (i.e. reflects back to space most of the sunlight striking
it), melting ‘wet’ ice is darker and absorbs much more sunlight. A
proportion of the melt water burrows through the ice sheet and
lubricates its base, accelerating the release of icebergs to the
ocean.
Such an extreme rise in sea level would have catastrophic
implications for humanity. For example one study estimates that
currently roughly 410 million people (or about 8 per cent of global
population) live within five meters of present high tide.95
Allowing
for population growth, this figure could well double over the course
of the twenty-first century. Densely-populated Nile and Asian
‘mega-deltas’ may disappear in addition to large areas around the
southern North Sea. |
Aiming for 2°C
Historically, an increase in equilibrium temperature of Earth’s atmosphere
by 2°C has been considered a ‘safe’ level of warming.
James Hansen’s warning
that global temperatures should not be allowed to exceed 1.7°C, however,
strongly suggests that a warming of 2°C cannot be described as ‘safe’.
As
Professor Rahmstorf says:
‘If we look at all of the impacts, we’ll probably
decide that two degrees is a compromise number, but it’s probably the best
we can hope for’.
In 2007, NASA’s James Hansen argued in 2007 that temperatures should not go
beyond 1.7°C (or 1°C above 2000 temperatures) if we are to avoid aiming to
avoid practically irreversible ice sheet and species loss.96
For example,
collapse of the Greenland ice sheet is more than likely to be triggered by a
local warming of 2.7°C, which could correspond to a global mean temperature
increase of 2°C or less.97, 98 The disintegration of the Greenland ice sheet
could correspond to a sea-level rise by up to 7m in the next 1000 years, not
to mention the positive climate feedback effects due to changes in
land-surface reflective properties (see Box 6).
This would act to increase
the warming as darker surfaces absorb more heat. Coral reef, alpine and
Arctic ecosystems will also potentially face irreversible damage below a
global average surface temperature rise of 2°C.99
In terms of the social impacts of climate change, what is manageable for
some is actually catastrophic for others. For example, at the climate change
conference in Copenhagen in late 2009, the Alliance of Small Island States - a grouping of 43 of the smallest and most vulnerable countries
- rejected
the 2°C target. They argued that 1.5°C is a better target, as many of their
islands will disappear with warming beyond this point.100
Climate policy, therefore, needs to redefine what is described as a ‘safe’
level of warming or redefine its definitions from an acceptable level of
warming decided by those who bear the least impact. Additionally, recent
research (see Box 10) shows that real temperature outcomes are unlikely to
be related to concentrations of greenhouse gases but rather a cumulative
carbon budget.101,102
In other words, not only is 2°C unsafe, it is
unhelpful when defining targets for climate policy.
But, given that a 2°C target is now firmly established within the policy
context, it is worth examining what it will mean should this temperature be
exceeded.
The inter-agency report Two degrees, one chance published by Tearfund, Oxfam, Practical Action, Christian Aid states:
Once temperature increase rises above 2°C up to 4 billion people could be
experiencing growing water shortages. Agriculture will cease to be viable in
parts of the world and millions will be at risk of hunger. The rise in
temperature could see 40-60 million more people exposed to malaria in
Africa. The threshold for the melting of the Greenland ice-sheet is likely to
have been passed and sea-level rise will accelerate.
Above 2°C lies the
greater danger of ‘tipping points’ for soil carbon release and the collapse
of the Amazon rainforest.103
Abrupt climate change: tipping points in the climate system
The Earth’s geological history is full of examples of abrupt climate change,
when the climate system has undergone upheaval, shifting from one relatively
stable state to another.
Transition to a new state is triggered when a
critical threshold is crossed. When this happens, the rate of change becomes
determined by the climate system itself, occurring at faster rate than the
original forcing. For example, until 6000 years ago the Sahara Desert was a
covered by vegetation and wetlands.
While the transition was driven by
subtle and smooth changes in incoming solar radiation, at a critical point
there was a regime shift in the rainfall patterns causing the landscape to
switch from lush vegetation to desert, at a rate far greater than the
original solar forcing.104
In 2008, Tim Lenton, Professor of Earth System Science and a team of
researchers at the University of East Anglia, concluded that because of
these critical thresholds in the climate system ‘society may have been
lulled into a false sense of security’ by the projections of apparently
‘smooth’ climate change.105
The research suggested that that a variety of
tipping elements of the climate system, such as the melting of ice sheets or
permafrost could reach their critical point (tipping point) within this
century under current emission trajectories. Tipping elements describe
subsystems of the Earth’s system that are at least sub-continental in scale
and can be switched - under certain circumstances - into a qualitatively
different state by small perturbations. The tipping point is the
corresponding critical point.
Tipping elements identified by the study include: collapse of the Greenland
ice sheet; drying of the Amazon rainforest; collapse of the West Antarctic
ice sheet; dieback of Boreal forests; greening of the Sahara/Sahel due to a
shift in the West African monsoon regime; collapse of the North Atlantic
ocean circulation; and changes to the El Niño-Southern Oscillation
amplitude.
Whether or not these highly unpredictable factors are made part of
decision-making is a political choice. But, given the existence of tipping
points in the climate system, it is hard to reconcile the assumption that we
may be able to stabilize the climate or even CO2 concentrations once a
certain level of threshold of temperature or concentration of CO2 is
reached.
But, the authors of the assessment identified a significant gap in
research into the potential of tipping elements in human socio-economic
systems, especially into whether and how a rapid societal transition towards
sustainability could be triggered.106
If the impacts of climate change are non-linear then our response both in
mitigating against and adapting to climate change also has to be non-linear.
|
Box 7. Time is running out
107
In August 2008 nef calculated
that 100 months from 1 August 2008, atmospheric concentrations of
greenhouse gases will begin to exceed a point whereby it is no
longer likely we will be able to avert potentially irreversible
climate change. ‘Likely’ in this context refers to the definition of
risk used by the IPCC to mean that, at that particular level of
greenhouse gas concentration, there is only a 66-90 per cent chance
of global average surface temperatures stabilizing at 2°C above
pre-industrial levels.
In December 2007, the likely CO2e concentration is estimated to be
just under 377ppm, based on a CO2 concentration of 383 ppm. This
seemingly counter-intuitive measure is explained by the proper
inclusion in the CO2e figure of all emissions effecting radiative
forcing - in other words, both those with cooling and warming
effects.
If stabilization occurs at 400 ppm, there is a 10-34 per cent chance
of overshooting a 2°C warming. Beyond this point, the probability of
stabilizing global surface temperatures at less than 2°C decreases.
It would seem that if policy-makers are at all serious about
avoiding dangerous climate change at a threshold of 2°C or less,
emissions need to be reduced significantly. |
What is the risk of overshooting 2°C under various
stabilization scenarios?
We wouldn’t fly in a plane that had more
than a 1 per cent chance of crashing. We should be at least as
careful with the planet. Current climate policies provide us with
far less than a 99 per cent chance of avoiding catastrophic climate
change.108
Paul Sutton, Carbon Equity
When the Kyoto Protocol was established in 1997,
the best scientific understanding implied that a 50 per cent reduction in
emissions below 1990 levels by 2050 would be sufficient to avoid dangerous
climate change.
Thirteen years on, the understanding of what constitutes
safe climate change has improved significantly. Now, there is a growing
consensus that at least an 80 per cent reduction in CO2 emissions below 1990
levels will be required by 2050 globally if we are to have a greater than 60
per cent chance of not exceeding 2°C.109
A recent analysis by the Tyndall
Centre for Climate Change Research demonstrated what this means for the UK.
Incorporating all sectors of the economy, the UK is required to reduce its
carbon dioxide emissions by some 70 per cent by 2030, and around 90 per cent
by 2050.110
Not only is the safe level of temperature rise misleading as described
earlier, a number of assessments exploring the probability of exceeding
various temperature thresholds have been published. These studies
demonstrate that the stabilization of atmospheric concentrations of
greenhouse gases at anything above 400 ppm is too high to avoid a
temperature rise of 2°C.111,112
Research led by Malte Meinhausen, a climate modeler based at the Potsdam
Institute for Climate Impact Research in Germany, has shown that
stabilization of greenhouse gas concentrations (defined as CO2e) at 550 ppm
is accompanied by the risk of overshooting 2°C warming by 68-99 per cent.113
According to the IPCC, this is defined as ‘likely’ to ‘very likely’.114
Meinhausen’s work also suggests that only by stabilising emissions at 400
ppm is it ‘likely’ that the climate will stabilise at 2°C.
In early 2009, however, James Hansen and colleagues at Columbia University
contended that current atmospheric concentrations of CO2 need to be reduced
to 350 ppm.115 Hansen’s analysis for the first time used a climate
sensitivity parameter (temperature change due to an instant doubling of CO2)
that included slower surface albedo feedbacks.
Traditionally, the climate sensitivity parameter only includes
fast-feedbacks (i.e. changes to water vapor, clouds and sea-ice) whilst
keeping slow changing planetary surface conditions constant (i.e., forests
and ice sheets). In addition, long-lived non-CO2 forcings (other gases and
aerosols) are also kept constant over time. It is worth noting, to avoid any
confusion, that Hansen and his team were specifically referring to CO2 only
- not CO2e which also includes non-CO2 forcings.
The paper concluded with the harrowing warning:
‘If humanity wishes to
preserve a planet similar to that on which civilization developed and to
which life on Earth is adapted, paleoclimate evidence and ongoing climate
change suggest that CO2 will need to be reduced from its current 385 ppm to
at most 350 ppm, but likely less than that.’116
Questioning climate policy assumptions
Certain assumptions underlie scenarios for the future stabilization of
greenhouse gas emissions and of their accumulation in the atmosphere.
These
include that historical rates for both energy efficiency improvements and
declining energy intensity will continue and accelerate into the future. In
turn, it is assumed that these will result in an absolute decrease in energy
consumption.
Yet, these assumptions are hugely dependent on
three questions that are not so much unanswered, as barely even asked:
-
Is the stabilization of greenhouse gases through long-term targets the
most effective response to climate change?
-
What are the theoretical and practical limits to energy efficiency of the
economy?
-
Do increases in energy efficiency actually result in decreases in the
demand for energy services?
Under this questioning, current climate change policies appear seriously
flawed, worsening the prognosis for future climate change and our ability to
deal with it.
For example, there are theoretical limits to efficiency governed by the laws
of thermodynamics. There are practical limits to efficiency, relating to
economic, social and political barriers, and the speed at which we can
replace current energy systems.
Observations in the real world suggest that increases in energy efficiency
can have perverse consequences, resulting in rises in the demand for energy
services - the so called ‘rebound effect’ (see Box 8).
Technological optimists believe that technical innovations will reduce the
demand for energy.117 But, in fact, technological improvements have tended
to push demand for high levels of ‘service use’ and greater consumption. The
history of fuel efficiency in cars is one such example (see Box 8).118,119
Before these questions are addressed, it is necessary to be clear about what
is meant by energy efficiency, energy intensity and ‘carbon intensity’.
All
three terms are described in more detail below, but fundamentally, they all
represent ratios. This means they place more emphasis on outputs, rather
than inputs. And, as long as the growth rate in consumption of the input
increases at a greater rate than efficiency (intensity) increases
(decreases) any improvements to the system are effectively ‘eaten up’. In
other words, no absolute reduction to energy consumption or carbon (in the
case of carbon intensity) would be observed.
For example, at the global level, even if technological energy efficiency
and the uptake of new, more efficient devices increased by 50 per cent over
the next 20-30 years with GDP rising at a conservative 2.5 per cent, within
25 years, we’d be back where we are now.120,121,122
|
Box. 8: The rebound effect
It is a confusion of ideas
to suppose that the economical use of fuel is equivalent to
diminished consumption. The very contrary is the truth.
William Stanley
Jevons (1865)123
There is no evidence that using energy more efficiently reduces
the demand for it.
Brookes (1990)124
Despite the recognition that
consumption levels need to decline in developed nations, governments
and businesses are reluctant to address the restriction of
consumption. Yet, without limits to consumption, improvements in
efficiency are often offset by the ‘rebound effect’.125
For example, a recent report published by the European Commission’s
Joint Research Centre (JRC) showed an increase in energy use across
all sectors - residential, service and industry - in recent years,
despite improvement in energy efficiency.126
For example,
in the domestic sector while new measures have led to some
improvements, particularly in the case of ‘white goods’ (e.g.
refrigerators, washing machines, dishwashers), the increasing use of
these products and other household appliances, such as tumble
driers, air conditioning and personal computers, has more than
offset savings.
The ‘rebound effect’ was an observation made by William Stanley
Jevons in his book The Coal Question, published in 1865.127
Here, Jevons contended that although technological advancement
improves the overall efficiency (E) with which a resource is used,
efficiency gains rebound or even backfire, causing higher production
and consumption rather than stabilization or reduction. Since
improvements generally reduce the cost of energy per unit, economic
theory predicts that this has the effect of triggering an overall
increase in consumption.
If a car, for instance, can drive more kilometers on a liter of
petrol, the fuel costs per kilometer fall, and so will the total
costs per kilometer. The price signal acts to increase consumption
and, thus, part of the efficiency gains is lost.
One area where the rebound effect is prominent is domestic energy
consumption. An analysis of energy consumption before and after
installation of energy savings measures found that only half of the
efficiency gains translate into actual reductions in carbon
emissions.128 This is supported by more recent analysis of the
effectiveness of England’s Home Energy Efficiency Scheme (Warm
Front).
While there are appreciable benefits in terms of use of
living space, comfort, quality of life, physical and mental
well-being, the analysis found that there was little evidence of
lower heating bills.129 This has also been observed in Northern
Ireland.130 In other words, improvements in energy
efficiency are offset by increased levels of thermal comfort.
An more in-depth economy-wide assessment of the rebound effect
carried out on behalf of the UK Energy Research Council in 2007
found that rebound effects are not exclusive to domestic energy
consumption.131 They can be both direct (e.g., driving
further in a fuel-efficient car) and indirect (e.g., spending the
money saved on heating on an overseas holiday).
Findings from the
research suggest that while direct rebound effects may be small - less than 30 per cent for households for example, much less is known
about indirect effects. Additionally, the study suggests that in
some cases, particularly where energy efficiency significantly
decreases the cost of production of energy intensive goods, rebounds
may be larger.
A further rebound effect is caused by ‘time-saving devices’.132 With
the current work-and-spend-lifestyle implicit to industrialized
societies, there is an increase in the demand for time-saving
products. Although these devices save time, they also tend to
require more energy, for example, faster modes of transport.
How large is the rebound effect?
How much energy savings are eaten up by the rebound effect is
surrounded by lively debate. Estimates range from almost nothing in
the energy services 133 to being of sufficient strength to completely
offset any energy efficient savings.134,135 There are a
number of empirical analyses, however, that suggest that the rebound
effect may be real and significant (Table 2).136
The majority of work investigating the rebound effect has focused on
a few goods and services.137 However, the few studies
that explore the macroeconomic impact of the rebound effect, find it
to be significant. For example, using a general equilibrium model,
one study by environmental economist Toyoaki Washida assessed the
Japanese Economy.139
On testing a variety of levels of CO2
tax, the rebound effect was found to be significant (between 35-70
per cent of the efficiency savings).
Table 2.
Summary of empirical evidence
for rebound effects138
Policy implications
The policy implications of the rebound effect are that energy/carbon
needs to be priced so the price remains relatively constant while
efficiencies improve. Surprisingly, however, rebound effects have
often been neglected by both experts and policymakers.
For example,
they do not feature in the recent Stern and IPCC reports or in the
UK Government’s Energy White Paper.140
According to Steve
Sorrell, a senior fellow at the Science and Policy Research Unit at
the University of Sussex:
‘This is a mistake. If we do not make
sufficient allowance for rebound effects, we will overestimate the
contribution that energy efficiency can make to reducing carbon
emissions. This is especially important given that the Climate
Change Bill (now Act) proposes legally binding commitments to meet
carbon emissions reduction targets.’141
|
|
Box 9. The history of fuel efficiency in
cars
Technological improvements in
fuel efficiency have largely been offset by traffic growth and low
occupancy rates. The increase in traffic has affected the ability of
drivers to utilize the maximum vehicle efficiency speed, but the
increase in traffic also means that demand for safer vehicles has
significantly increased the weight of vehicles.
This phenomenon is
termed ‘cocooning’, and is due to the fact that we now spend so much
time in cars. Vehicles now have more and more gadgets to provide
greater levels of comfort as people spend more and more time sitting
in traffic jams or traveling further distances. This has had the
effect of increasing the weight of the vehicle and also the energy
required to power the gadgets in them.
Table 3 compares the fuel consumption of the Volkswagen Golf (a
reference case for all compact family cars) over the period
1975-2003. Since 1975, fuel consumption has improved by a measly 5
per cent. When compared with the weight of the vehicle, it is clear
that the reason for the modest improvements in fuel consumption is
due to a greater than 50 per cent increase in the weight of the
vehicle.142
Table 3.
Fuel consumption of the
Volkswagen Golf 1975-2003.
 |
Are long-term stabilization targets the correct policy
response?
Recent modeling studies suggest that stabilization of greenhouse gas
emissions is far from the most effective policy response to climate change.
For example, using a coupled climate
carbon-cycle model, one study found that from a suite of nine IPCC
stabilization scenarios, eight showed that temperatures did not appear to
stabilize over the next several centuries, but rather continued to increase
well beyond the point of CO2 stabilization at around 2400.143
The continuation of temperature increase beyond atmospheric CO2
stabilization is due to the long thermal memory (i.e., long-term changes in
planetary albedo, due to loss of ice caps, changes in cloud cover, etc.) and
equilibration time of the climate system.144
Given this, many are now calling for a policy response of a ‘peak and
decline’, not just in carbon emissions but also atmospheric concentrations
of CO2. The faster and further that greenhouse gas concentrations can be
lowered below their peak, the lower the maximum temperature reached will be.
|
Box 10. The trillionth tonne
Due to uncertainties in the
carbon-cycle (see Box 11), the final equilibrium temperature change
associated with a given stabilization concentration of greenhouse
gases is poorly understood. In order to address this uncertainty, a
number of studies have begun to quantify cumulative greenhouse gas
emissions that would limit warming to below 2°C.145
Meinshausen, also the lead author of one of the studies, found that
in order to stand a 75 per cent chance of keeping temperatures below
2°C, the world has to limit the cumulative emissions of all
greenhouse gases to approximately 1.5 trillion tonnes of CO2e. To
reduce the risk by another 5 per cent, this means capping total
emissions to just over 1 trillion tonnes of CO2e. 146
Myles Allen, Head of the Climate Dynamics group at University of
Oxford’s Atmospheric, Oceanic and Planetary Physics Department and
lead author of another study comes to similar a conclusion. Allen
and his colleagues argue that if humans can limit cumulative
emissions of carbon to one trillion tonnes of carbon, there is a
good chance not exceeding the 2°C. They estimate that we could
follow our current emissions pathway for another 40 years, and then
would have stop emitting carbon in to the atmosphere altogether.147
But, this doesn’t mean we’ve got 40 years; far from it. Meinshausen
argues that if emissions are still 25 per cent above 2000 levels in
2020, the risk of exceeding 2°C shifts to more likely than not.148
That’s a reduction in global emissions by 2.5 per cent year on year,
starting now. Given that emissions are currently growing at
approximately 3.5 per cent per year - this represents a phenomenal
challenge, and requires unprecedented action. |
|
Box 11. Global carbon-cycle feedbacks
Less than half of fossil fuel
carbon emitted remains in the atmosphere. For the period 2000-2005,
the fraction of total anthropogenic CO2 emissions
remaining in the atmosphere has been around 0.48.
This is because
over half has been sequestered by the global carbon cycle.149 This
fraction, however, has increased slowly with time, implying that
there is a weakening of the carbon sinks relative to emissions.150
A very real and immediate concern is what effect both increasing
concentrations of CO2 in the atmosphere and the
subsequent temperature affect will have on the global carbon cycle.
Figure 3:
Global flows of
Carbon 151
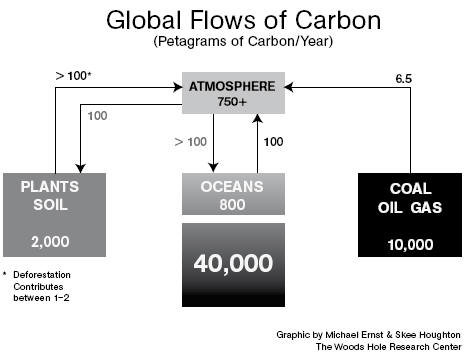
Weakening of terrestrial and
oceanic sinks could accelerate climate change and result in a
greater warming. This will therefore mean even lower levels of
anthropogenic greenhouse gas emissions than currently imagined may
be necessary to achieve a given stabilization target.
Positive terrestrial carbon-cycle feedbacks result from a
combination of increased soil respiration and decreased vegetation
production due to climate change. Positive oceanic carbon-cycle
feedbacks, however, result from decreased CO2 solubility
with increasing ocean temperature, as well as changes in ocean
buffering capacity, ocean circulation and the solubility pump (the
mechanism that draws atmospheric CO2 into the ocean’s
interior). The net effect is to amplify the growth of atmospheric CO2.
Observations suggest that the carbon sinks may already be weakening.
For example a paper published in the journal Science in 2007 found
evidence to suggest that the Southern Ocean sink of CO2
had weakened over the period 1981-2004.152 This is
significant because the Southern Ocean is one of the largest carbon
sinks, absorbing 15 per cent of all carbon emissions. The study
found that the proportion of CO2 absorbed by the Southern
Ocean had remained the same for 24 years, even though emissions have
increased by around 40 per cent during the same period.
The Southern Ocean is now absorbing 5-30 per cent less CO2
than previously thought. It is believed that a strengthening of
Southern Ocean winds caused by man-made climate change has reduced
the efficiency of transportation of CO2 to the deep
ocean. Rather than CO2 finding its way into the deep
ocean, where it stays, it is being released by the increase in ocean
mixing caused by strengthening winds. Worryingly, climate models did
not predict this would happen for another 40 years.153
Whilst carbon-cycle feedbacks have been recognized for a number of
years, it is only recently, with the aid of coupled carbon-cycle
climate models, that these CO2 feedbacks have been
quantified. A recent study that compared a number of different
carbon-cycle climate models suggested that by the end of the
century, the additional concentration of CO2 in the
atmosphere due to carbon-cycle feedbacks could be between 20 and 200
ppm, with the majority of the models lying between 50 and 100 ppm.154
Recent real time observations suggest an already increased rate of
atmospheric CO2 growth and reduced efficiency of ocean
sinks, leads us to fear that the additional CO2 input
into the atmosphere is more likely to reside near the upper-most
figure. |
The latest IPCC report also acknowledges that anthropogenic warming and
sea-level rise could continue for up to 1000 years after stabilization of
atmospheric greenhouse gas concentrations.155
This, of course,
makes the very notion of stabilization of the climate untenable due to the
complex push-pull relationship between temperature and CO2 concentration.
The relationship between economics, growth and carbon emissions
There was a time when the relationship between carbon emissions and economic
growth seemed so simple.
Until recently, it was often argued that the
relationship between income and CO2 emissions followed the Environmental
Kuznets Curve (EKC) model. The EKC evolved from Simon Kuznets’s original
thesis on economic growth and income inequality.156 Kuznets postulated that
with economic growth, income inequality first increases over time, and then
at a certain point begins to reverse. In theory, then, the relationship
between economic growth and income inequality placed on a graph takes on the
shape of an inverted-U.
In environmental economics, the EKC proposes a relationship between
environmental pollution and economic activity.157 The theory again suggests
an early rise in pollution that later reverses its relationship with growth.
Several attempts have been made to determine whether the EKC paradigm can be
applied to per capita emissions of CO2 in the form of a Carbon Kuznets
Curve.158
Some early literature on the subject does suggest that there is a
relationship between per capita income in a country and the per capita or
gross emissions in the country.159,160 There is now unequivocal evidence,
however, that in the case of carbon emissions, the EKC simply represents
idiosyncratic correlations and holds no predictive power.161
For example a recent study published in the journal Proceedings of the
National Academy of Sciences found that income was the biggest driver of
ever increasing emissions.162 Of nine regions, which included developed
regions such as the USA, Europe, Japan, and developing regions such as
China, India, all showed a strong correlation of increasing emissions and
income.
The problems of directly applying the EKC paradigm to greenhouse gases are
twofold.
First, key greenhouse gases have a long atmospheric lifetime 163 compared to
other environmental pollutants, such as particulates. Their long atmospheric
lifetime means that their environmental impact is transboundary, i.e., their
effect on the climate is not restricted to the region within which they are
produced.
Given the asymmetries of the stages of economic development
between nations, in principle the EKC model for global climate change cannot
work, and the connection between control of domestic emissions in
higher-income countries and the benefits to their citizens is very weak.
Calculations based on direct national emissions are also misleading because
they fail to account for the ‘embedded’ carbon of goods manufacture abroad
and consumed domestically.
For example, the effect of much of Britain’s
heavy industry and manufacturing having been ‘outsourced’ to less wealthy
countries creates the impression that Britain pollutes less, now that it is
richer. In fact, the pollution has largely been outsourced too. It still
exists, but not on Britain’s official inventory of emissions (see Box 12).
Second, we are constrained by the arrow of time. There is clear evidence to
suggest that both developed and developing economies would begin the decline
on the inverted-U curve well beyond concentrations of greenhouse gases that
are classed as safe.164
In other words, by the time we got to the less
polluting slope of the curve, we would already have gone over the cliff of
irreversible global warming; it would be too late to be green.
|
Box 12. Carbon laundering:
the real driver of falling carbon and
energy intensity in developed nations
As economies develop,
historically there is a move away from heavy industry towards
service-driven economies that are less energy intensive, so-called
‘post-industrialism’. The crude method of national reporting of
carbon emissions, and therefore carbon intensity, further reinforces
the impression of declining environmental impact.
Yet, in fact, nothing could be further from the truth. In a global
economy, it’s not just about how the majority of a nation’s
population earn their living, it’s also about how they consume. High
incomes have conventionally led to high consumption. So rather than
declining carbon emissions, high end-service economies actually
increase global energy and material throughput, outsourcing
production to other nations rather than decarbonizing and
dematerializing the economy.
In 2001, over five billion tonnes of CO2 were embodied in
the international trade of goods and services, most of which flowed
from developing nations (non-Annex 1 nations of the UNFCCC) to
developed nations (Annex 1 nations of the UNFCCC) - i.e., five
billion tonnes excluded from developed nations emissions
inventories.165 This is greater than total annual CO2
emissions from all EU25 nations combined.166 This means,
in effect, the economies of countries like the UK and the USA are
‘laundering carbon’ to offshore carbon inventories.
This was illustrated by the report from City firm, Henderson Global
Investors, The Carbon 100.167 It suggested that the UK
may be responsible for more than the ‘official’ 2.13 per cent
responsibility often claimed by politicians.
The Carbon 100 suggested that the UK was actually responsible for
between six to eight times more than this (around 12-15 per cent).
Tracing the worldwide activities of the UK’s leading companies
listed on the UK stock exchange paints a more accurate picture of
the UK’s real emissions responsibility.
While establishing the ‘embodied emissions’ of trade is notoriously
difficult, a recent study published by researchers from Lancaster
University’s Environment Centre explored the carbon embodied within
trade flows between the UK and China.168 The study showed that
imports from China to the UK were embodied with 555 million tonnes
of CO2 in 2004.
Put another way - the carbon
embodied in trade reduces the apparent CO2 emissions of
UK consumers by 11 per cent, but increases the real carbon footprint
of UK consumers by 19 per cent and global emissions by 0.4 per cent.
This is due to the carbon inefficiencies of Chinese industrial
processes compared to those in the UK. Furthermore, the study
estimated that the shipping of goods from China to the UK in 2004
resulted in the emission of perhaps a further 10 Mt CO2.
This estimate falls towards the high end of earlier estimates for
embodied carbon for all of the UK’s trade partners. It also means
that the UK’s progress towards its Kyoto emission targets of 12.5
per cent below 1990 levels vanishes into the global economic
atmosphere.
This suggests that carbon or energy intensity is an indicator that
is grossly misleading at the national level. As a country moves
towards post-industrialism, the goods demanded by the
high-consumption society are simply produced elsewhere, resulting in
a displacement of emissions.
A more accurate indicator of changes in
domestic emissions would be on a per capita basis based on the
average individual ecological/carbon footprint. See for example nef’s report Chinadependence: The second UK Interdependence Day
report.169 |
Energy efficiency, energy intensity and carbon intensity
There are two types of energy efficiency improvements. The first relates to
the development or exploration of more sustainable conversion technologies
ranging from renewable technology, to improved efficiency of electricity
generation. This will be referred to as supply-side efficiency or εss.
The second relates to the improvement in energy efficiency of demand-side
applications or end-use efficiency -εeu. For example, εeu can be improved by
increasing the efficiency of light bulbs, fridges, televisions, and so on.
The overall efficiency (Ε) of converting primary energy into GDP can
therefore be defined as the product of εss and end-use efficiency εeu.
Energy intensity (energy use per unit of GDP) is the inverse of Ε, this is
shown in Equation 1.
Equation 1

= (useful energy/primary energy) × (GDP/useful energy)
= (GDP/primary energy)
= 1 / Energy intensity of the economy
|
Box 13. The Kaya Identity
The Kaya Identity, developed by
the Japanese energy economist Yoichi Kaya plays a core role in the
development of future emissions scenarios in the IPCC Special Report
on Emissions Scenarios (SRES).170,171
It shows that total
(anthropogenic) emission levels depend on the product of four
variables: population, Gross Domestic Product (GDP) per capita,
energy use per unit of GDP (energy intensity) and emissions per unit
of energy consumed (carbon intensity of energy).
The Kaya Identity
is shown in Equation 2. It has, been adapted to take into account
natural carbon sinks.172
Equation 2
Where:
Net F is the magnitude of
net carbon emissions to the atmosphere
F is global CO2 emissions from human sources
P is global population
G is world GDP and g = is global per-capita GDP,
E is global primary energy consumption and e = is the energy
intensity of world GDP,
and f = is the carbon intensity of energy,
S is the natural (or induced) carbon sink.
Climate policy so far has dealt
with the second half of the equation - energy intensity of the
economy and carbon intensity of energy. For the former, the ratio is
expected to decline over time through improvements in efficiency of
both supply and demand. Carbon intensity (f) of energy relates to
improvements in efficiency of carbon-based energy supply and decarbonisation of the energy supply through diffusion of renewable
energy technology (wind, hydro, solar, geothermal and biomass)
nuclear fission.
In terms of population growth, it is noteworthy that fertility rates
in the developed world have fallen dramatically in recent
decades.173
In terms of both social justice and effectiveness, the
education of women is the only viable option for the long-term
stabilization of population growth. This, in turn, is dependent on
the progress of human development. Nevertheless, by 2050, the global
population is expected to reach nine billion.174 Economic
growth, however, defined by changes in g remains, by and large and
as discussed earlier in this report; unchallenged.
Recent evidence suggests that the surge in emissions growth is
primarily due to increases in economic activity. The growth rate of
CO2 emissions includes carbon-cycle feedbacks (see Box 11) as well
as direct anthropogenic emissions.
Of the 3.3 per cent average
annual growth rate of emissions between 2000 and 2006, 18 ± 15 per
cent of the annual growth rate is due to carbon-cycle feedbacks,
while 17 ± 6 per cent is due to the increasing carbon intensity of
the global economy (ratio of carbon per unit of economic
activity).175
The remaining 65 ± 16 per cent is due to the increase
in the global economic activity.
While it is often argued that technological innovation could in
theory improve resource and energy efficiency and lead to
decarbonisation of the economy, recent evidence challenges this
view. This is discussed later on in this report. |
Energy intensity, the amount of primary energy required to generate economic
activity (GDP), is a standard for energy use per unit of productivity. While
carbon intensity refers to the carbon produced for each unit of productivity
(see Box 13 on the Kaya Identity). Since carbon emissions and energy
consumption are currently so strongly coupled, at present the two terms can
effectively be viewed as roughly analogous.176
Logically, therefore, energy intensity improvements will only reduce
emissions if improvements are made at a greater rate than increases in GDP.
For example, the International Energy Agency’s (IEA) World Energy Outlook
2009 projects increases in global average economic growth by 3.1 per cent
per annum between 2007 and 2030. In order to observe absolute reductions in
carbon emissions of 1 per cent per year, the carbon intensity of the economy
would need to improve by 4.1 per cent per year assuming energy intensity
remains the same.177
Historically, global carbon intensity of energy has declined at a average
rate of around 1.3 per cent per year since the mid-1800s.178 However,
disaggregating these data over the past 40 years gives a more much more
detailed picture (see Table 4).
Since 1971 global carbon intensity of the energy has fallen, on average
fallen by just 0.15 per cent each year, with a maximum annual decline of
0.41 per cent between 1980 and 2000. However, in recent years the carbon
intensity of energy has increased at a rate of 0.33 per cent between
2000-2007. This increase in carbon intensity of energy is due to the
increased use of coal in recent years.
While coal use grew less rapidly than
all other sources of energy between 1971-2002 over the past four years this
trend has been reversed.
Coal use is now growing by 6.1 per cent each year,
more than double the rate of all other energy sources.179 This rise in
carbon intensity of energy has more than offset the small improvements in
energy intensity of the economy - bringing improvements to carbon intensity
of the economy to a standstill and causing total carbon emissions to soar.
Even in developed nations, carbon intensity of the economy and energy have
never managed to reach the levels required to stop total carbon emissions
rising year on year. Table 5 shows changes in carbon intensity in the United
States. Since the 1950s, carbon intensity in the USA declined at an average
rate of around 1.6 per cent per year, with a maximum annual decline in
carbon intensity of 2.7 per cent between 1980 and 1990.
Current rates of
carbon intensity fall are now around 1.6 per cent annually.
At a time where never before has there been so much financial and
intellectual capital directed towards innovation to improve the carbon and
energy intensity of the economic system, this slowdown of improvements
implies that we may be reaching the practical limits of efficiency.
Table 4:
Change in global carbon
intensity180
|
Box 14: The UK: Leading by
example?
The UK ‘dash for gas’ was
largely responsible for the relative ease with which the UK reached
its Kyoto Protocol targets.
For example, the Royal Commission for
Environmental Pollution (RCEP) states that the UK’s emission
reductions are ‘largely fortuitous’.181 The ‘dash for gas’ was due
to the rapid shift in electricity generation from coal to gas in the
early 1990s.182 This was an unintended consequence of the
Conservative government’s liberalization of the energy market.
Although this has been supplemented by changes to industrial
processes, waste management and the outsourcing of production to
developing nations such as China and India (see Box 12).183
A Defra (Department for the Environment, Food and Rural Affairs)
spokeswoman said the UK had already beaten its 2012 emissions target
of 12.5 per cent under the Kyoto protocol and that the figures for
2005 showed a reduction of 15.3 per cent on 1990 levels. ‘The action
we have taken to cut our greenhouse gas emissions at the same time
as maintaining economic growth makes us an exemplar,’ she said.184
In reality, the majority of the UK’s emissions reductions have
simply been achieved through this fuel switch (and outsourcing of
production).
For example, simply by displacing 1400GW of base load coal-fired
power stations with 1400GW of energy efficient combined cycle gas
turbine (CCGT) power stations could save approximately 1 billion
tonnes of carbon (3.67 billion tonnes of CO2) per year.185 Indeed,
this has been proposed as one such method of reducing global
emissions.
But, as we shall see later, like its fuel-cousin oil,
natural gas too is facing production limits.
The UK Climate Change Program (2006) suggests that 25 per cent of
emissions reductions in the UK were due to fuel switching in 1990s
from coal to gas.
A further 35 per cent of reductions were thought
to be due to energy efficiency (but could equally be due to
outsourcing of production), and a further 30 per cent of reductions
were due to the reduction of non-CO2 greenhouse gases (comparatively
less reduction compared to CO2 due to the higher global warming
potential of, for example, methane, nitrous oxide and fluorinated
gases). |
Table 5:
Change in carbon intensity in
the United States186
Globally, stabilization of CO2 to a safe level would require an 80-90 per
cent reduction in current anthropogenic CO2 emissions.
Worldwide, they are
actually growing by 3.4 per cent a year (average over 2000-2008 period).187
At the same time, carbon intensity of energy is increasing by on average
0.33 per cent per annum. This trend is unlikely to change at least for the
remaining 3-year term of the Kyoto protocol.
So is growth really possible?
Back to Contents
Scenarios of growth and emission
reductions
If humanity wishes to preserve a planet similar to that on which
civilization developed and to which life on Earth is adapted… CO2 will need
to be reduced from its current 385 ppm to at most 350 ppm CO2, but likely
much less than that… If the present overshoot of this target CO2 is not
brief, there is a possibility of seeding irreversible catastrophic
effects.188
James Hansen NASA/Goddard Institute for Space Studies
Since changes to both carbon intensity of energy and the economy are assumed
to play such a major role in mitigating strategies, we ask - what declines
in carbon intensity are necessary to meet a number of emissions scenarios
ranging from the high risk, to what current science implies is necessary?
To address this question, we performed a number of analyses that examine the
relationship between growth, carbon intensity of the economy, energy
intensity of the economy (efficiency), carbon intensity of energy and
emissions reductions. Focusing specifically on CO2 rather than other
greenhouse gas emissions, we modeled future consumption of fossil fuels.
Since CO2 produced by burning fossil fuels is approximately 70 per cent of
all anthropogenically produced greenhouse gases, has a long atmospheric
lifetime and is the best studied and modeled of the greenhouse gases, just
focusing on CO2 is a good starting point.
Unless otherwise stated, conversion and emissions factors and historical
data on carbon emissions have been taken from the Carbon Dioxide Information
and Analysis Centre, a section of the US Department of Energy.189,190
Data
from the World Resources Institute Climate Analysis Indicators Tool were
also used.191
The scenarios
Although the IPCC has produced a suite of scenarios that describe possible
future emissions pathways, they are non-mitigating (i.e., they do not
consider climate-related policy), so will not include the impacts of current
climate policies.192
They also incorporate a wide range of possible
technical, social, and economic factors that are difficult to break down
into their component parts.
Figure 4.
Comparison of the RS and AP
scenarios presented in the World Energy Outlook, 2006
to the updated World Energy
Outlook, 2008 RS and AP scenarios.
Given this, more recent scenarios constructed by the IEA form the basis of
our analysis, particularly as they do include mitigation policies.
In this
report, we explore the implications of the World Energy Outlook - 2006
Reference (RS) and Alternative Policy (AP) scenarios. These scenarios are
primarily driven by four parameters: economic growth, demographics,
international fossil fuel prices and technological developments.
At the time of publication, the IEA had produced a further three World
Energy Outlook reports since 2006, each containing a revision of these
scenarios. However, on comparing the emission pathways for the 2007 and 2008
editions (shown in Figure 4) we find little divergence over the 50-year
timeframe - the period that is the focus of our analysis.
The 2008 RS and AP-550 scenario are not dissimilar to the 2006 RS and AP
scenarios. While there is a large difference between the AP-550 and AP-450,
assumptions made about the latter scenario are arguably questionable and
unrealistic (see Box 15). Given that the RS and AP-550 scenarios are both
similar to the World Energy Outlook 2006 RS and AP scenarios, we base our
analysis on the 2006 scenarios.
In the 2009 edition (not shown), again there
is minimal divergence from the RS. However, the only AP analyzed is AP-450,
which follows a similar trajectory to the World Energy Outlook 2008 AP-450
scenario.
|
Box 15. WEO - 2008 Scenarios
Reference scenario
The reference scenario (RS) includes the effect of government
policies up until mid-2008, but not new ones. For the RS, CO2 is
expected to have doubled by 2100, reaching 700 ppm (CO2 only) and
1000 ppm (CO2e). World primary energy demand increases at a slower
rate than in previous RSs, due to the recent economic slowdown and
implementation of new climate policies. This translates into annual
carbon emissions that are just 1GtC less than the WEO 2007 RS. The
RS also assumes decrease in CO2 intensity by 1.7 per cent per annum
(pa.)
Alternative scenarios
The alternative scenarios (APs) assume negotiations for the next
phase of the Kyoto Protocol agree stabilization targets of either
550 ppm CO2e or 450 ppm CO2e, which are achieved by 2200. These are
both peak and decline scenarios. In other words, the target
atmospheric concentration of CO2e is overshot, and subsequently
reduced.
Given this, in the AP-450 scenario, atmospheric
concentrations of CO2 peak between 2075 and 2085, and then begin a
long-term decline to 2200. For the AP-550 scenario, atmospheric
concentrations of CO2 peak in the middle of the next century and
slowly decline to 550 ppm CO2e by 2200. Scenarios are met through
three key climate policy mechanisms - cap-and-trade, sectoral
agreements, and national policies and measures.
In order to meet these targets, the scenarios assume significant
growth in low-carbon energy such as: hydroelectric power, nuclear,
biomass, other renewables and carbon capture and storage.
AP-550-AS
AP-550 assumes that
while world primary energy demand increases by 32 per cent over the
period 2006-2030 (0.4 per cent slowdown in growth rate compared to
the RS), emissions would rise by no more than 32,900 MtCO2 in 2030
and decline thereafter. This requires a $4.1 trillion investment
into low carbon energy related infrastructure or 0.2 per cent of
annual GDP.
The change in energy mix results in a decline in CO2 intensity by
2.6 per cent pa. This is due to both the increase in low carbon
energy and the decrease in the average quantity of CO2 emitted per
tonne of fossil fuel energy. By 2030, low carbon energy would
account for 26 per cent of the primary energy mix compared to 19 per
cent in 2006.
This level of decarbonisation of the power sector is
equivalent to seven coal-fired plants and three gas-fired plants
with carbon capture and storage (CCS), 11 nuclear plants, 12,000
wind turbines each year and the equivalent of three, Three Gorges
Dams every two years. In addition, emissions from fossil fuel energy
fall from 2.94 tonnes/toe in 2006 to 2.83 tonnes/toe in 2030. This
is due to a falling share of coal in the primary energy mix.
AP-450-AS
AP-450 requires that CO2e emissions fall dramatically in 2020
from 35,000 MtCO2e to 27,500 MtCO2e by 2030 and 14,000 MtCO2e by
2050. Energy efficient improvements at both production and end-use
levels result in a low growth rate in energy demand (0.8 per cent
pa). By 2030, low carbon energy will account for 36 per cent of the
global primary energy mix (including CCS), costing $9.3 trillion or
0.6 per cent of annual world GDP.
Fossil fuels still account for 67
per cent of the primary energy demand in 2030; however, there is an
assumption that CCS technologies will be more widespread in the
power generation sector and will also be introduced into industry.
Additionally, it is assumed 13 nuclear power stations need to be
built each year and biofuels are more widespread the transport
sector.
Beyond 2030, the power sector becomes ‘virtually decarbonised’ with a strong emphasis on CCS in the power and
industrial sectors and electric, hybrid and biofuels in the
transport sectors (private and goods vehicles, shipping and
aviation).
Between 2006 and 2030, there is:
-
a tenfold increase in wind,
solar and other renewablesan increase in modern biomass (modern
bioenergy plants that use organic waste or cultivated feedstocks)
by almost 80 per cent
-
a near doubling of nuclear
energy
There are three fundamental
critiques of these scenarios, however. First, it is noteworthy that
recent research by Lowe et al. has stated that in order to have less
than a 50 per cent change of not exceeding 2°C, emissions need to
peak by 2015 and fall by 3 per cent each year thereafter.
Neither
the RS nor the AP scenarios achieve such an early and dramatic peak
and decline scenario. Lowe et al. also note that even if emissions
peak in 2015, there is still a one-in-three chance that near-surface
temperatures will rise by more than 2°C in 100 years’ time.193
The IEA, however, dismisses a scenario that does not achieve overshoot
stating:
‘A 450 stabilization trajectory without overshoot would
need to achieve substantially lower emissions in the period up to
2020 and, realistically, this could be done only by scrapping very
substantial amounts of existing capital across all energy-related
industries. In any case, given the scale of new investment required,
it is unlikely that the necessary new equipment and infrastructure
could be built and deployed quickly enough to meet demand.’194
Wigley et al. also note that a policy that allows emissions to
follow an overshoot pathway means that in order to recover to lower
temperatures within a century timescale, we may, for a period,
require negative global emissions of CO2.195
Second, the assumptions about growth in capacity of CCS are also
overly optimistic. The consensus view is that CCS may be
commercially viable by 2020; however, a number of analysts believe
even this is an optimistic scenario suggesting that 2030 may be more
realistic.
Third, given the optimism attached to CCS as a viable technology in
the near future, the assumption that CO2 intensity can feasibly
decline by 2.6 per cent per year can also be viewed as over
optimistic. Figure 5 produced by Pielke et al. compares predicted (IPCC
scenarios) and observed changes in energy intensity the economy
carbon intensity of energy.
Observations (2000-2005) imply both an
increase in energy intensity of the economy and carbon intensity of
energy by approximately 0.25 and 0.3 per cent pa respectively.
Figure 5.
Assumed decarbonisation in the
35 IPCC scenarios for 2000-2010
compared to observations
between 2000 and 2005.196
 |
World Energy Outlook 2006 Scenarios
As already discussed, The World Energy Outlook 2006 provides two scenarios:
RS and AP.197 The RS (business-as-usual case) provides a baseline projection
of energy usage, or carbon emissions, in the absence of further policy
changes from mid-2006.
As such, by 2030, the RS projects global primary
energy demand increases of 53 per cent, with over 70 per cent of this coming
from developing nations, led by China and India.
Conversely, the AP scenario estimates the impact of implementing all
currently proposed policy changes on energy use/carbon emissions, such as
speeding up efficiency improvements or shifting to renewable energy sources.
By 2030, global energy demand is reduced by 10 per cent, mainly due to the
improved efficiency of energy use. Twenty-nine per cent of the decrease in
emissions is expected to be achieved by electricity end-use efficiency and
36 per cent by fossil fuel end-use efficiency.
These scenarios are both based on average GDP growth of 3.4 per cent between
2004 and 2030 as well as average population growth of 1 per cent. We assume
that beyond 2030 to 2050, GDP would grow at the rate of 2.9 per cent a year,
the 2030 growth rate.
In analyzing the data, we separate two important components of the carbon
intensity of an economy: efficiency in usage of energy (energy intensity of
the economy - see Equation 1) and the carbon intensity of energy. The
interaction of these elements is described in Equation 3.198
Equation 3
Where F is global CO2 emissions from human activity (in tCO2), E is total
primary energy supply (in tonnes of oil equivalent) and G is world GDP (in
‘000s $US).
Using the two WEO scenarios of total consumption of energy, including
electricity supply, we calculated energy intensity of the economy and carbon
intensity of energy.
It is noteworthy that the emissions calculations made here only used primary
energy supply projections (coal, oil, and natural gas). Other forms of
energy usage, such as biomass, nuclear and hydroelectric power were assumed
to have no carbon emissions.199 This assumption was made for ease of
calculation, as sufficiently detailed projections for the type of biomass in
use were not available to allow emissions projections.
Additionally,
land-use changes from hydroelectric power projects were not included. Given
this, we expect all our calculations to be conservative.
In extending the scenario to 2050, we have projected the energy supply
growth for each fuel type using the annual growth rates estimated for
2015-2030, employing the same method to project total final consumption (TFC).
In describing the RS, the IEA states that the energy intensity of the
economy will decline by 1.4 per cent on average until 2030.200 Again we have
used this figure to project forward until 2050. No specific growth rate is
suggested for the AP scenario, but it does imply a faster rate of
improvements in energy intensity of the economy.
Based on historical
precedents we assume an ambitious 2.0 per cent decline in energy intensity
between 2004 and 2015, 2.2 per cent between 2015 and 2030 and 2.6 per cent
between 2030 and 2050.
Model assumptions
We used a globally aggregated Earth system model - the Integrated Science
Model (ISAM) global carbon model to predict the effect of emissions on
atmospheric concentrations of CO2.
The ISAM model is available online and
has been used widely in the IPCC assessment reports and climate policy
analyses related to greenhouse gas emissions.201 The carbon-cycle component
is representative of current carbon-cycle models.202 Model iterations were
run with the IPCC B scenario for carbon emissions from land-use changes.203
Emissions of other greenhouse gases besides CO2 were also assumed to follow
the IPCC B scenario.
Even though the model provides a projection of median temperature increases,
these have not been reported due to the uncertainty in projecting
temperature changes with increasing greenhouse gas concentrations.204 We
have, therefore, confined ourselves to demonstrating the necessary
improvements in carbon intensity to meet various CO2 emissions targets.
To test whether the projections correspond to a sustainable economy, we
examine the potential for overshooting of CO2 emission targets, with a given
level of energy intensity of the economy improvements, energy demand and GDP
growth.
We have used the SIMCAP modeling platform developed by
Malte
Meinshausen to generate potential target emissions pathways.205 The model
uses an Equal Quantile Walk (EQW) method to create more plausible scenarios
for emissions paths out of the infinite combinations of yearly emissions
that might achieve the targets.206
We have reported the results for target peaks of atmospheric CO2
concentrations of 350 ppm, 400 ppm, 450 ppm, 500 ppm and 550 ppm CO2. Note
that we have confined our analysis in this section to actual CO2 emissions,
ignoring the effect of other greenhouse gases. This was necessary because of
the limits of the model in converting other emissions into CO2e emissions.
Thus, the actual warming effect is greater than that created by the CO2
emissions. Based on current proportions, CO2e (Kyoto gases only) would be
around 50 ppm greater; for example, 385 ppm CO2 is around 435 ppm CO2e.
The EQW method was used to create the emission scenarios required to meet
the target, with emissions reductions starting in 2007 for the OECD and 2010
for other regions of the world. Using this scenario and the previously
defined rates of GDP growth, we have calculated what the necessary energy
intensity and/or carbon intensity improvements would have to be to remain
below the CO2 targets.
The EQW method was also used to create the post-2050
emissions pathways that would be necessary under the RS and AP scenarios to
meet the targets.
Recent evidence and modeling has brought further clarity to the debate over
feedback considerations. In the carbon-cycle, faster rates of emissions
growth and accumulation of CO2 in the atmosphere will weaken the rate at
which it can be absorbed into the oceans or terrestrial carbon sinks (see
Box 11).
While we have excluded such feedbacks from the main analysis, we
have provided estimates using these data separately.
Peak Oil
Although increasingly warning of production capacity constraints, the IEA
makes no detailed mention of the possible physical limits to continuing
exploitation of fossil fuels to drive the global economy.
That is, with the
single exception in one media interview, when Fatih Birol, the IEA’s chief
economist, said,
‘In terms of the global picture, assuming that OPEC will
invest in a timely manner, global conventional oil can still continue, but
we still expect that it will come around 2020 to a plateau.’207
In other
words, a peak and long-term decline in the global production of oil.
Evidence is presented later in this report on the likely onset of Peak Oil.
Projections for oil and gas production were obtained from Colin Campbell and
the Association for the Study of Peak Oil (ASPO).208 Given the constraints
in building and developing alternative sources of energy, such as nuclear or
hydroelectric power stations, we have assumed that the energy requirements
left unfilled because of the shortage of oil and gas will be filled by
replacing those fuels with coal - a phenomenon that appears to be occurring
already.209
This has significant effects on the carbon intensity of energy.
While the rate of supply side efficiency improvements to the energy
intensity of the economy are also dependent on the fuel mix, this
substitution serves as a first order estimate of the effects of Peak Oil on
anthropogenic greenhouse gas emissions.
As CCS is still an immature technology, yet to be proven at scale, we do not
assume that it plays a role in reducing the carbon intensity of the
economy.210 The future role of CCS is discussed in more detail later in this
report.
We have also erred on the side of caution by not factoring in the declining
net energy gains from fossil fuel extraction as more marginal stocks of oil,
gas and coal are exploited. Increasing amounts of energy must be used to
exploit heavy oils and tar sands which would have deleterious effects on the
energy intensity of the economy.211
But without a very comprehensive and
detailed global energy model, predicting such effects would be difficult.
Additionally, using coal that is higher in moisture or otherwise less
efficient for electricity production would have similar negative effects on
the energy intensity of the economy.
We have not modeled this here for lack
of data.
Results
As shown in Figure 6, the scenarios developed by the IEA would lead to
extremely high concentrations of atmospheric CO2, with the RS breaching the
upper limit of our most generous target range in 2047.
Even the optimistic
AP scenario, would lead to atmospheric concentrations of CO2 of 487 ppm by
2050.
A possible emissions scenario that would seek to stabilize atmospheric CO2
concentration at 500 ppm after 2050 is shown in Figure 7. Given the pre-2050
emissions pathway of the alternative policy scenario, it is impossible to
prevent an overshoot of the target. The changes in emissions levels needed
to even bring about stabilization after an overshoot are quite dramatic.
As
Figure 7 shows, if the alternative policy scenario is followed until 2050,
immediately thereafter carbon emissions would still have to be curtailed by
roughly 1.1 per cent annually to even stabilize atmospheric CO2 below 550
ppm.
This does not account for the impact of carbon-cycle feedbacks,
however.
Figure 6.
IEA scenario emissions and
resulting atmospheric CO2 concentrations
Figure 7.
Possible post-2050 emissions
scenarios
Figure 8.
The impact of carbon cycle
feedbacks on atmospheric concentration of CO2
Figure 9.
Effect of declining oil
production on emissions
If we take into account the effects of
carbon-cycle feedback mechanisms, the
atmospheric concentrations of CO2 corresponding to a given level of
emissions increases over time.
As climate models disagree about the
magnitude of the feedback effect, we have demonstrated the range of possible
CO2 concentrations in Figure 8. Data on the potential carbon-cycle feedbacks
were take from the C4MIP Model Intercomparison.212 In the worst-case
scenario, the atmospheric concentration of CO2 is about 10 per cent larger
than previously modeled.
The situation becomes much worse when the Peak Oil projections are combined
with the possible efficiency improvements described in the IEA scenarios
(see Figure 9).
In the AP scenario, resulting emissions from the projected
change in the fuel mix would be nearly 17 per cent higher than the IEA
projections. This would bring projected atmospheric CO2 concentration to 501
ppm in 2050 (note, concentrations are not shown on the graph).
Peak Oil,
therefore implies that proceeding with every proposed improvement to energy
intensity and adoption of cleaner fuels will not be sufficient to prevent a
breach of even the most generous target and thus potentially disastrous
climate change.
Emissions scenarios with target CO2 concentrations
The second phase of our analysis compared possible emissions scenarios with
target pathways that would generate specified levels of atmospheric CO2
concentrations.
Using the EQW method, emissions scenarios were created to
match the targets of 350 ppm, 400 ppm, 450 ppm, 500 ppm and 550 ppm.
Figure
10 shows the emissions pathways as compared to the IEA pathways.
Figure 10.
Possible emissions scenarios
to meet various atmospheric CO2 concentration targets.
Figure 11.
The growing gap in the carbon
intensity of energy.
We then examined the gap that would have to be plugged by changes in carbon
intensity of energy to meet the targets.
Maintaining the assumptions in the
alternative policy scenario about the improvements to the energy intensity
of the global economy and using the stylized emissions pathway that would
meet the target atmospheric concentrations of CO2, we can find a typical
pathway of improvement in the fuel mix that would enable growth at the rate
specified in the IEA scenarios.
As shown in Figure 11, the aggressive
advancement of renewable energy in the AP scenario does not meet the needs
of an emissions pathway that could mitigate climate change.
Figure 12.
Improvements needed to meet
the target emissions pathway at different levels of growth.
The projection for a decline in oil production and substitution by dirtier
coal energy sources counterbalances the other improvements in the fuel mix.
Despite the scenario assuming about 25 per cent greater use of nuclear power
and non-hydroelectric renewable energy sources than in the RS, which already
includes almost 10 per cent per annum average increases in renewables, the
effects of declining oil production mean that the carbon intensity of energy
remains about the same over time.
This demonstrates that without radical
changes in lifestyle in terms of energy usage or even faster moves towards
non-fossil-fuel energy sources, it will not be possible to have economic
growth at the rate indicated.
Looking at the overall carbon intensity of the economy, meaning that we
allow variable improvements in both the carbon intensity of energy and
energy intensity of the economy, Figure 12 shows that kind of improvement
that would be needed to meet the target emissions pathway at different
levels of growth.
Even at 1.5 per cent growth, the global economy would need to reduce its
carbon intensity by 71 per cent between 2006 and 2050, equivalent to a 1.3
per cent average annual decline. But, this assumes a steady improvement,
since following a different trajectory - for example, with delayed measures
to improve the carbon intensity - would cause cumulative emissions to
increase, and an overshoot of the target.
Any delay in improvements would have to be paid for with even greater
improvements in the future to ensure that atmospheric carbon concentrations
do not peak above the maximum of the target range, namely 500 ppm CO2.
The
question remains as to whether such improvements could be made.
|
Box 16. Historical precedents for
rapid changes in carbon intensity
An absolute annual reduction in
CO2 emissions greater than 3 per cent is rarely considered to be a
viable option.213 Worse still, where mitigation policies are more
developed, emissions from international aviation and shipping are
not included. For example, Anderson et al. note that the UK’s CO2
emissions are, on average, 10 per cent greater than official records
for this reason.214
In the Stern Review, historical precedents of reductions in carbon
emissions were examined. Their analysis found that annual reductions
of greater than 1 per cent have ‘been associated only with economic
recession or upheaval’.215 Stern points to the collapse
of the former Soviet Union’s economy, which brought about annual
emission reductions of over 5 per cent for a decade. While France’s
40-fold increase in nuclear capacity in just 25 years and the UK’s
‘dash for gas’ in the 1990s both corresponded, respectively, with
annual CO2 and greenhouse gas emission reductions of only 1 per
cent.
In 1990, the Dutch government proposed to increase the rate of
energy efficiency from 1 per cent per year to 2 per cent per year.
The pledge was considered a ‘real test of strength’, by the Ministry
of Economic Affairs. This was against the backdrop for what was
actually achieved generally during the last century of 1.2 per cent
per year. However, the target up to 2010 was later revised to
1.3-1.4 per cent per year.216 |
Would the global economy manage to lower its carbon intensity by 2.7 per
cent per year on average (the necessary improvement to meet the 500 ppm
target with 3 per cent growth levels) while maintaining growth?
Historical
indicators are not positive, with the average annual declines of carbon
intensity between 1965 and 2002 being just 1.2 per cent. Worse still,
between 2000 and 2007, improvements in energy intensity of the economy
slowed to an average of just 0.4% each year. Over the same period, carbon
intensity of the economy increased by on average 0.37% per year.
Figure 13 again highlights the gaps between the AP scenario and the targets,
much as Figure 12. The scenarios are clearly way above even the riskiest
target level.
Figure 13.
The gap between scenarios and
targets.
Figure 14.
Target carbon intensities
with no economic growth.
Even if growth were to cease, implying a decline in global per capita
incomes because of population growth, we could not be complacent on the
technology and energy front, as shown in Figure 14.
Maintaining a low risk
profile and keeping ambient CO2 concentrations below 400 ppm would require
similar levels of investment in energy efficiency and emissions reductions
as described in the AP scenario, all without any increase in overall
economic activity.
As a final analysis, we looked at the effect of carbon-cycle feedbacks on
the need for carbon intensity improvements and emissions reductions. To meet
the same 450 ppm target for atmospheric CO2 concentrations in a coupled
carbon-cycle model, the actual emissions pathway must correspond to a
concentration of between 410 ppm and 445 ppm in an uncoupled carbon-cycle
model.
The results are shown in Figure 15, and demonstrate that the effect
of carbon-cycle feedbacks can be significant.
Figure 15.
Potential effects of carbon
cycle feedbacks.
The following sections explore some of the factors that may modify these
scenarios. They seek to indicate the relative likelihoods of the range of
different possible outcomes - better or worse - are more probable.
Since our main work was completed, Professor Kevin Anderson of the Tyndall
Centre for Climate Change Research at Manchester University also looked at a
range of scenarios for growth, greenhouse gas concentration levels and
global warming.217
Assuming that growth continued, he looked at the rate of emissions
reductions that would be needed to achieve greenhouse gas concentration
levels commensurate with a 2, 3 or 4°C temperature rise. Most, of course,
agree that temperature rise above two degrees represents unacceptable,
dangerous warming.
Anderson’s conclusion was stark:
‘Economic growth in the
OECD cannot be reconciled with a 2, 3 or even 4°C characterization of
dangerous climate change.’218
Back to Contents
Peak Oil, Gas and Coal?
If we could spend the oil age in an Irish pub…the glass was more or less
full in 1900, just about half full in 2000 and there are a few little dregs
left at the end of this century.
Dr Colin Campbell (1 February, 2007)
My father rode a camel. I drive a car. My son flies a jet plane. His son
will ride a camel.219
Saudi saying
Supplying the world with all the crude oil and natural gas it wants is about
to become much harder, if not impossible.
For oil, the horizon of the global
peak and decline of production appears close and that for gas not much
further behind. When demand exceeds production rates, the rivalry for what
remains is likely to result in dramatic economic and geopolitical events
that could make the financial chaos of 2008 in Europe and the USA seem
light-hearted.
Ultimately, it may become impossible for even a single major
nation to sustain an industrial model as we have known it during the
twentieth century.220
Counter-intuitively, the imminent global onset globally of the peak, plateau
and decline of the key fossil fuels, oil and gas, will not help arrest
climate change. If anything, it could be a catalyst for worse emissions and
accelerating warming. For example, in October 2009, the UK Energy Research
Centre (UKERC) reviewed the current state of knowledge on oil depletion.221
The study argued as we advance through peak oil:
…there will be strong incentives to exploit high carbon non-conventional
fuels. Converting one third of the world’s proved coal reserves into liquid
fuels would result in emissions of more than 800 million tonnes of CO2, with
less than half of these emissions being potentially avoidable through carbon
capture and storage.
In other words, with the analyses by Meinshausen and Allen discussed earlier
in this report in mind, without extensive investment in low carbon
alternatives to conventional oil, and policies that encourage demand
reduction, Peak Oil is likely to drive emissions further towards a threshold
of dangerous climate change.
|
Box 17. Peak Oil and food production
Increased fossil energy prices
will in turn cause the price of food to increase significantly. On
average, 2.2 kilocalories of fossil fuel energy are needed to
extract 1 kilocalorie of plant-based food.222 In the case
of meat, the average amount of kcal fossil energy used per kcal of
meat is much greater, with an input/output ratio of 25.223
In early 2008, the UN World Food Program had to reassess its agreed
budget for the year after identifying a $500 million shortfall. It
found that the $2.1 billion originally allocated to food aid for 73
million people in 78 countries would prove to be inadequate because
of the rising costs of food.
Higher oil and gas prices have
contributed to this by increasing the costs of using farm vehicles
and machinery, transporting food and manufacturing
fossil-fuel-dependent input such as fertilizer. The move to grow biofuel crops has also exerted upward pressure on food prices by
leaving less productive land available to grow crops. |
The global economy is still heavily dependent on fossil fuels. Oil remains
the world’s most important fuel largely because of its role in transport and
agriculture and the ease with which it can be moved around.
The historical pattern has been for industrial societies to move from
low-quality fuels (coal contains around 14-32.5MJ per kg) to higher quality
fuels (41.9 MJ/kg for oil and 53.6 MJ per kg), and from a solid fuel easily
transported and therefore well suited to a system of global trade in energy
resources.224
Now, almost all aspects of our economy are dependent on a constant and
growing supply of cheap oil, from transport to farming, to manufacturing and
trade. In the majority world, where too many people live close to, or below
the breadline, the long tail of green revolution agriculture depends on
pesticides and fertilizers that need large amounts of fossil fuels.
The
implication of any interruption to that supply, either in terms of price or
simple availability, means a significant shock to the global economy.
Everyone will be affected, but some more than others.
|
Box 18. We’ve been here before
The world oil crises in the
1970s provide some idea of how the effects of Peak Oil may ricochet
through the economy. The two world oil crises in the 1970s (the most
significant occasions when demand exceeded supply due to politically
caused interruptions) caused widespread panic that the economy would
fall into a global depression. During the first oil embargo in 1973,
oil supplies only fell by 9 per cent. The second oil crisis caused
by the Iranian oil cut-off resulted in a fall in oil production by 4
per cent.225 Both world oil crises were followed by recession,
resulting in economic hardship, unemployment and social unrest
around the world.226
Interestingly, the first and second oil crises are the only recorded
times in the industrial epoch where energy efficiency improvements
have actually resulted in a decrease in demand for energy. This
shows how a strong price signal, aggressive government policy and
awareness can work together to decrease energy demand. |
The price burden of crude oil
Recent research explored the price burden of crude oil on French households
in 2006.227
This is the first analysis of this type. Other analyses have
only focused on direct domestic energy consumption (electricity and
gas).228,229,230 This study, however, explores the contribution of indirect
or ‘embodied’ energy within goods and services. The results and can be taken
to be broadly consistent with other developed nations.
The analysis found that in 2006, the average burden of crude oil was
equivalent to 4.4 per cent of the total budget of a typical French
household. This figure, however, varied significantly depending on income,
age or the size of their city of residence. The results are presented in
Figure 16. This provides some indication of the vulnerability to oil price
rises.
In general, Figure 16 shows the largest burden is likely to be
experienced by the elderly and low-income groups. This illustrates that
changes in oil prices are an acute social justice issue.
Figure 16.
Dependence of the
contribution of crude oil to household’s budget as a function of
per capita income, age of the
household’s reference person, and the type of residential area.231
In an international context, different government responses to oil price
rises can also radically alter the consequences for developing countries.
Following the 1973 oil price shock, relaxed monetary policy in rich
countries caused low to negative real interest rates on hard currencies. As
well as maintaining demand for poor countries’ exports this also laid the
foundations for the Latin American debt crisis. But following the 1979 oil
price shock, rich countries’ fear of inflation created a triple blow for
their poorer relations.
Economist David Woodward describes the consequences
of tightening monetary policy,
‘demand contracted, developing countries’
export prices collapsed and real interest rates increased dramatically to
historically high levels’.232
Consequently, the price of oil imports
doubled ‘overnight’ and interest rates on commercial foreign debts doubled
over the next three years.
Even at oil prices prevailing in early 2004, the IEA believed that
oil-importing developing countries were being seriously disadvantaged.233
As the International Monetary Fund (IMF) observes, although the so-called
Heavily Indebted Poor Countries (HIPCs) ‘account for only a small share of
global GDP, many of them are among the most seriously affected by higher oil
prices’.234
The IMF points out that 30 of the 40 HIPCs are net oil importers, making
them particularly sensitive to price fluctuations. Their problems are
compounded by several interconnected economic factors including: low per
capita incomes, high level of oil imports relative to GDP, large current
account deficits, high external debt, and limited access to global capital
markets.
Altogether, according to the IMF, this means that,
‘the impact of
higher oil prices on output is relatively large, as it will have to be met
primarily through a reduction in domestic demand’.235
This is economists’
speak for the poor getting poorer.
Timing of Peak Oil
We may argue about when the peak is, but
it doesn’t change the argument that it is coming.236
Robert Kaufmann, Energy Economist at Boston University
The actual global peak year will only be known when it has passed, but most
estimates suggest that we are either at, or very close to this point.
At
most it is one or, less likely, two decades away. Against a background of
rising demand, ‘peaking’ will result in a major shock to the global economy.
But, even before then, an opening gap between production and demand is
already driving prices up.
The recent review published by UKERC warned that, almost unequivocally, peak
production will occur before 2030, with a significant risk that this will
occur before 2020.237 Estimates of the precise onset of Peak Oil range from
2006 to 2030 (Table 6). The higher-end estimates are by and large due to
exaggeration of technical reserves. A constant flow of new studies and
industry leaks, however, point towards a downward revision of potential
reserves.
Actual technical reserves of oil are often very different from published
reserves, the former rarely changing and the latter being related to
political circumstance (often overestimated because of poor data, to bolster
financial investment, political and institutional self interest, and other
complicating factors).
But, despite the variety of different estimates, many
credible analysts have recently become much more pessimistic about the
possibility of finding the huge new reserves needed to meet growing world
demand, and even the most optimistic forecasts suggest that world oil
peaking will occur in less than 25 years.
A central problem in the estimation of ‘real’ oil reserves is that not all
oil companies work to the same standards of reporting. Whilst the US
Securities and Exchange Commission sets rules for how to report reservoir
estimates, only US and major international companies generally abide by
those standards, reporting is not always performed reliably..238,239
Jeremy
Leggett, an expert on Peak Oil, reports in his book
Half Gone that reporting
by Organization of Petroleum Exporting Countries (OPEC) is usually
particularly dubious:
‘Middle East official reserves jumped 43 per cent in
just three years [during the 1980s] despite no new major finds.’240
Additionally, Saudi Arabia has posted a constant
level of reserves (260 billion barrels) over the past 15 years, despite the
fact that it has produced over 100 billion barrels in the same period.241
Table 6.
Projected dates of reaching ‘Peak Oil’.242
The North Sea is the only place where a significant new discovery has been
made outside of OPEC nations, Russia and Alaska in the past four decades.
Both Norway and the UK are seeing decreases in the production from the
region to the extent that the UK no longer exports oil. Furthermore, no new
giant oilfields are replacing those which have already passed their peaks.
Of all the oil resources remaining:243
-
62 per cent is in the Persian Gulf
-
10 per cent is in Africa, mostly Angola,
Libya, and Nigeria
-
10 per cent is in the former Soviet Union (FSU),
mostly Russia, Kazakhstan, and Azerbaijan
-
10 per cent in Latin America, mostly Venezuela
A failure to grasp the problems associated with Peak Oil was, until
recently, a serious blind spot in many official government policies and
reviews.
For example, ASPO commented on the 2006 Stern Review: ‘It fails to
take note that oil and gas, which drive the modern economy, are close to
peak, and will decline over most of this century to near exhaustion. The
coal resources are indeed large, but the coal-burning airliner has yet to
take off.’244
Whilst there is considerable uncertainty surrounding future oil reserves,
and the field is surrounded by intense debate, the current view appears to
be converging towards the view that Peak Oil is a very real and impending
problem that could have catastrophic implications for the global economy, to
the extent that it is gradually filtering into the A-list of political
concerns with then Secretary of State for Environment, Food and Rural
Affairs, David Miliband addressing an audience at the University of
Cambridge in March 2007 stating:
‘The time is right to look at what it would
mean for the UK over the period of 15 to 20 years to create a post-oil
economy - a declaration less of ‘oil independence’ and more the end of oil
dependence.’245
More recently, the IEA has begun to identify the problems of Peak Oil.
The
Medium Term Oil Market Report published by the IEA (an official advisor to
most of the major economic powers) reported in 2008 that:
‘there will be a
narrowing of spare capacity to minimal levels by 2013’.
Since the previous
year alone it had made, ‘significant downward revisions’ on ‘both non-OPEC
supplies and OPEC capacity forecasts’.246
The fuel price volatility of the
last two years looks to be a foretaste of a far more massive crunch that
will follow as the graph lines for global oil demand and supply head in
opposite directions.247 The IEA’s motto - ‘energy security, growth and
sustainability’ - appears to be the antithesis of the situation that it
surveys.
Since UK North Sea production peaked around 1999, hopeful eyes have been
focused on the major producers like Saudi Arabia to keep the economy’s
arteries full of oil.248 But, looking ahead, Saudi Arabia appears to have
other ideas.
Over the next 12 years it intends to spend around $600 billion
(about the same staggering figure that the USA earmarked for propping up its
financial system) on a massive domestic infrastructure program, including
power stations, industrial cities, aluminium smelters and chemical plants.
And, while doubts persist that its reserves are a lot less than publicly
stated, guess what: all these new developments will be powered with Saudi
oil.
The rest of the world should not hold its breath waiting to be
rescued.249
Figure 17.
The rise in the price of
Light Crude (NYMEX) between January 2004 and December 2009 (current $US per
barrel).
Already the cost of a barrel of oil has risen almost 14-fold in the last
decade reaching $147 a barrel in July 2008 (Figure 17).
While the price
dropped in late 2008 to $40 a barrel, they have doubled again since. Oil
prices are becoming increasingly volatile due to declining indigenous
production and growing reliance on international markets.
It is noteworthy
that that several analysts forecast oil prices could rise to $200 to $300 a
barrel in the near future.250,251
The energy return on investment
The first half of the total oil resource is easy to extract, the second half
is hard. We will transition from oil fields that are shallow, big, onshore,
safe, and close, to fields that are deep, dispersed, offshore, remote, and
unsafe.252
Professor Michael Klare, author of Blood and Oil (2004)
[It] takes vast quantities of scarce and valuable potable water and natural
gas to turn unusable oil into heavy low-quality oil…In a sense, this
exercise is like turning gold into lead.253
Matthew Simmons, leading expert on Peak Oil
The Energy Return on Investment (EROI) is the ratio between the useful
energy obtained from a source divided by all the direct and indirect energy
inputs needed to obtain it.
For example, a fuel with an EROI of 10:1 means
10 joules would need to be invested to yield 100 Joules of useful energy,
resulting in a net energy (or energy surplus) of 90. If, however, the EROI
was 3:1 (in the case of unconventional oil), to net the same 90 Joules
around 45 Joules would need to be invested.
As ecological systems with a large energy surplus have a competitive
advantage, so does the economy. Indeed, the huge growth in the global
economy can be attributed to the switch from low EROI wood (30:1) to coal
(80:1) and finally to oil (100:1). Our economy thrives on high EROI energy
sources.
Not only is the discovery rate of oil falling, oil production is
experiencing diminishing returns. This is clearly illustrated by the
evolution of EROI for oil in the US over time.254
-
1930s, EROI = 100:1
-
1970s, EROI = 25:1
-
1990s, EROI = 11-18:1
Another study found that the global average EROI for oil in the first half
of the 2000s, was approximately 20:1.255
And, if current trends continue the
ratio will change to 1:1 in the next 20 to 30 years. In other words, at this
point, oil will cease to be a net energy source of energy.
With declining conventional oil reserves, it will be necessary to
increasingly rely on unconventional oil reserves, such as Canadian tar sands
and Venezuela’s Orinoco tar belt. Whilst many estimates of the
unconventional oil resource indicate that it may well substantially exceed
those of conventional oil, increasing amounts of energy will be required to
extract that resource.256
Unconventional oil is estimated to have an EROI of
around 3:1 - bearing in mind that once EROI approaches a ratio of 2:1, the
oil might as well be left in the ground, given the additional energy
required to refine it into a useful fuel.257
The techno-optimistic belief holds that when Peak Oil arrives, we will be
able to deal with it.
This outlook is generally not held by the majority of
Peak Oil experts, many of whom hold the view that no combination of existing
and emerging technologies will provide industrial nations with the energy
necessary to sustain current consumption rates and exorbitant lifestyles.258
Figure 18.
Global supply of liquid
hydrocarbons from all fossil fuel resources and associated costs
in dollars (top) and GHG
emissions (bottom).
EOR = enhanced oil
recovery.259
In the past, higher prices led to increased estimates of conventional oil
reserves worldwide, since oil reserves are dependent on price.
In other
words, reserves are defined as the amount of oil that is considered
economically feasible to recover. Geology, however, places an upper limit on
what is actually recoverable from conventional oil. Effectively, there is an
upper limit to the price of oil - beyond this point additional conventional
oil will not be recoverable at any realistic price.
The high price of oil over the past decade has provided an incentive for oil
companies to conduct extensive exploration over that period. The results,
however, have been disappointing.
Alternatives
What are the potential alternatives to oil if the Peak Oil experts are wrong
about a technofix, such as liquid and gas synthetic fuels (synfuels)
produced from coal, or the widespread use of biofuels?
Coal has an EROI ratio of around 80:1. Therefore, coal could be transformed
into synthetic oil through the Fischer-Tropsch process.260 However,
synthetic transport fuels emit even more carbon on a well-to-wheels basis
than conventional crude; and when the feedstock is coal, the emissions are
double.261
Even if the process producing synfuels included CCS, CO2
emissions would still be greater than those associated with conventional
diesel and petrol. According to one study even if 85 per cent of the carbon
emitted from the processing of coal were captured (bearing in mind this is
the upper limit of what most CCS experts believe is possible), emissions
from end-use of these synthetic fuels would produce on average 19-25 per
cent as much CO2 as petroleum derived fuels.262
Much of the literature focuses on the availability of oil as a result of
Peak Oil.
But some analysts have raised concerns about the transition from
conventionally produced oil, highlighting that synthetic liquid fuels are
generally higher capital, higher energy intensive and have higher carbon to
hydrogen ratios, and therefore produce more CO2 than conventional crude
oil.263 Figure 18 shows that the oil transition is not necessarily a shift
from abundance to scarcity, but a transition from high quality resources to
lower quality resources that have potentially higher levels of environmental
damage.
Investment into synthetic fuels will tend to cause world oil prices to fall,
benefiting consumers, with potentially the impact of increasing demand even
more.
Therefore, the management of the oil transition may not be necessarily
focused on dealing with global economic collapse, but rather dealing with
the environmental problems associated with synthetic liquid fuels derived
from other fossil fuels, such as coal and tar sands.
Peak Gas
‘Peak gas is an entirely unheard of and unwelcome spectre’
264
Andrew McKillop, energy analyst
Less discussed, but equally real is the prospect for the global peak and
decline in the production of natural gas. Peak Gas is analogous to Peak Oil,
but refers to the maximum rate of the production of natural gas.
For
example, in the context of the UK the Digest of UK Energy Statistics
reports:
‘The UK oil and natural gas production peaked in 1999 and 2000. Since then
they have declined at an average rate of 7 per cent per annum (pa) and 3 per
cent pa respectively (to 2004).’ 265
In 2007, Defra reported that emissions from industry in the UK increased
during 2006 as power stations had to switch from gas to coal due to high gas
prices.266
This implies rising gas prices connected to geopolitics or
decline in production could also result in an increase in carbon emissions.
Additionally, because a significant proportion of domestic dwellings are
dependent on gas for space heating, declining gas supply and subsequent
price increases could have a significant impact on fuel poverty.
UK gas fields have already peaked, and it’s expected that most of the UK’s
gas will eventually come from Russia, Iran and Qatar. Figure 19 shows the
changes in the UK’s indigenous production and consumption of natural gas
between 1998 and 2008.267 Since 1998, demand (white) of natural gas shows an
inter-annual variability of approximately 5 per cent.
At the same time,
indigenous gas production showed a slow decline from 2000 (light grey). In
2004, in order to meet demand for the first time since 1997, the UK began
importing gas. This reduced the UK’s energy independence significantly.
The ‘energy dependence’ factor is the ratio of net energy imports to demand,
and multiplied by 100 to produce a scalable figure. When it becomes
‘positive’, it means that we are obliged to import energy to meet our
demand. In other words, our independence declines. Between 2004, when the UK
first lost its energy independence, and 2008, the energy dependence factor
has risen almost 5-fold.268
More recently Shell’s vice president, John Mills, told delegates at the Abu
Dhabi International Petroleum Exhibition and Conference (ADIPEC) on 5
November 2008 that:
‘Globally, what people have woken up to is that there is
a prospect for the gas industry that its supply-demand crunch could come
earlier than anticipated.’269
Figure 19.
Natural gas production, net
exports/ imports and consumption 1998-2008.270
Consumption plus net exports
will differ from production plus net imports
because of stock changes,
losses and the statistical difference item.
Many energy policies have no concept of Peak Gas being imminent.
This is
largely due to poor reporting of gas reserves. Whilst estimates of gas
reserves succumb to the same problems and lack of accurate disclosure as the
oil industry, unlike oil, the gas market is regional.271
For example, oil
can be transported from the other side of the world for consumption in the
UK, but the UK gas market is generally restricted to Europe and Russia. In
short, gas is very difficult and expensive to move around, and
infrastructure is necessary before a gas reserve can have a market (i.e.,
storage and pipelines).
If we consider an energy market under Peak Oil/Gas conditions, we would
expect the UK to be able to afford to outbid poorer countries in the global
oil market. In the Euro-Russian gas market, however outbidding all other
equally wealthy European countries would be extremely costly resulting in
large increases in gas prices.
This suggests that for developed nations like
the UK, Peak Gas may pose a greater threat to the economy than Peak Oil, and
naturally both will present significant problems to developing nations
following a similar carbon intensive development pathway.
|
Box 19. The feasibility of saving 1
Gt of Carbon by switching to gas
A program to displace 1400GW of
coal-fired power stations with, for example, 1400 1GW 70 per cent
fuel efficient CCGT plants, would require an additional 0.7 per cent
annual increase in natural gas production on top of the
business-as-usual annual increases in demand of 2.3 per cent
projected by the IEA.272
Whilst an additional increase of global gas demand by 0.7 per cent
may not seem huge, in the context of known gas reserves and current
production from fields, this rate of increase is unlikely to be
sustainable for long. For example, gas fields in large developed
economies are declining, while regional natural gas constraints are
already being observed, primarily in North America (the most
intensive consumer of the resource), as well as Russia and Europe.273
,274 |
Overall, any carbon emissions savings made through fuel switching from coal
or oil to gas will be undermined by the onset of Peak Gas. Equally, our
assumptions about how gas will be able to carry us through to a low carbon
economy are seriously flawed.
For example, in 2006, carbon emissions from British industry covered by the
EU ETS (Emissions Trading System) rose by 3.5 per cent during 2006.275
These
rising emissions were due to power generators switching from gas to coal in
response to high gas prices during 2006. The rise in emissions from these
power stations cancelled out all improvements across those sectors that
actually reduced their emissions.
Natural gas is also important for many plastics, fabrics, even plastic bags.
It provides the heat necessary for cement production, and is also
indispensable for making synthetic oils from tar sands (see previous section
on Peak Oil).276
Additionally, natural gas is ‘absolutely indispensable’ for
the production of industrial fertiliser.277
Unconventional gas
Unconventional gas is defined by the International Gas Union as: ‘methane
from tight (very low permeability) formations, methane from coal seams,
methane from geo-pressured brine, methane from biomass (onshore and
offshore), and methane from hydrates’.278
But, the fundamental problem with
unconventional gas is that its recovery is more energy intensive and
expensive compared to oil, and the production process can be much slower.
While technology may help to overcome some of these problems, a very real
problem will be transportation, and the significant reduction of the EROI.
Peak Coal?
A scenario seldom discussed is the peaking of coal production. Global
consumption of coal is growing rapidly.
From 2000 to 2007, world coal
extraction grew by a rate of 4.5 per cent compared to 1.06 per cent for oil
(oil production actually fell by 0.2 per cent between 2006 and 2007).279
This is opposite to the trend observed over the past two decades. In
particular, as China rapidly industrializes, the use of coal is increasing
dramatically. In 2005, China was responsible for 36.1 per cent of world coal
consumption, the USA 9.6 per cent, and India 7.3 per cent.280
Global coal production is expected to peak around 2025 at 30 per cent above
present production in the best-case scenarios. Geographically, coal reserves
are concentrated in just a handful of nations. Approximately 85 per cent of
global coal reserves are concentrated in six countries (in descending order
of reserves): USA, Russia, India, China, Australia, and South Africa.
Furthermore, coal consumption generally takes place in the country of
extraction - around 85 per cent of coal is used domestically, with around 15
per cent exported.281
Again, the concentration of coal in a small number of
nations increases energy insecurity.
Coal’s contribution to the economy
Currently, coal provides over 25 per cent of the world’s primary energy and
generates around 40 per cent of electricity.
For a number of reasons - including the cost of mining, transport and the lower energy density of
coal, and the more inefficient process of electricity generation - its
primary energy yield is only around one-third of the economic productivity
of the primary energy in oil.282
While coal may be able to provide some buffer to Peak Oil and Gas, it is one
of the most environmentally damaging fossil fuels. For example, while it
produces a quarter of the world’s energy, it is responsible for almost 40
per cent of the greenhouse gases. Since 1750, the burning of coal has
released around 150 gigatonnes of carbon into the atmosphere.283
Although carbon sequestration could in theory reduce the carbon burden of
coal, coal is problematic for other reasons. For example, sulphur, mercury
and radioactive elements are released into the air when coals is burned.
These are particularly difficult to capture at source.
The mining of coal
also destroys landscapes, and very fine coals dust originating in China and
containing arsenic and other toxic elements has been detected drifting
around the globe in increasing amounts.284
Clean coal?
Clean coal technology refers to some form of CCS but, there is something
rather peculiar about the phrase ‘clean coal’. Despite the environmental
burden from the mining of coal, stick the word clean in front of it, and
suddenly it becomes palatable.
In his keynote speech at the Labour Party conference in 2008, the Prime
Minister, Gordon Brown, called for a new generation of ‘clean coal’ plants.
Speaking almost simultaneously in the USA, former Vice President and
Nobel
Prize winner
Al Gore stated explicitly:
‘Clean coal does not exist.’285
More recently, the Subcommittee on Investigations and Oversight of the US
Committee on Science and Technology, which is responsible for overseeing all
non-defense research and development programs at a number of federal
agencies published a report examining the recent abandonment of
FutureGen by
the Department of Energy.286
FutureGen was a 10-year long $1 billion government/private partnership
program to build a 275MW CCS power plant in Mattoon, Illinois.
The report
argued:
‘Creating ‘clean coal’ is an extremely complex task involving not
only the development of reliable and economical technology to capture CO2
and other pollutants, and integrating it into electricity-producing coal
plants, but also the acceptance of higher electricity prices and unknown
liability for carbon dioxide sequestration sites by the public and their
elected officials worldwide.’
In other words, clean coal is further away than we are being led to believe.
We discuss the potential of ‘clean coal’ in the context of carbon capture
and storage in the following section.
Back to Contents
Carbon capture and storage - the nuclear fusion of the 2010s?
‘… carbon sequestration is irresponsibly portrayed as an imminently useful
large-scale option for solving the challenge. But to sequester just 25 per
cent of CO2 emitted in 2005 by large stationary sources of the gas […] we
would have to create system whose annual throughout (by volume) would be
slightly more than twice that of the world’s crude-oil industry, an
undertaking that would take many decades to accomplish.’ 287
Professor Vaclav Smil (2008)
By 2015, the European Union aims to have 12 large CCS demonstration projects
in place, requiring an investment of e5 billion.
The expectation is that
this development will cause significant cost reductions, making the
technology affordable by 2020. There are, however, many drawbacks; for
example, it will keep costing large sums of money to make sure the CO2 stays
where it is supposed to, and the process is energy intensive.
CCS - capturing CO2 and storing it indefinitely - is one of the key
technologies expected to contribute to the stabilization of atmospheric
concentrations of CO2. The IPCC has now endorsed its use, Nicholas Stern
concludes that it will be a crucial technology in the 2006 Stern Review, and
the UK Climate Policy Program places significant emphasis on this as a
plausible technological response.
Despite this optimism, many still highlight that it is still by no means
clear that it will work or that it will become commercially viable in time
to have a significant impact on the mitigation of climate change.288
For
example, a recent editorial in the journal Nature Geoscience argued:
‘Capacities for geological storage are uncertain, pilot projects for deep
ocean sequestration have been halted, and public acceptance of both options
is at best questionable - not least because full risk assessments based on
solid scientific data are scarce’.289
A short overview of CCS
CCS can involve a number of different processes which are heavily reliant on
advanced and unproven engineering.
There are three types of CCS processes
currently under consideration. And all three processes are already being
applied in several industries on smaller scales, but most without storage.
-
Post-combustion - the mixture of CO2 and flue gases after combustion is
separated by using a liquid solvent.
-
Pre-combustion - the fuel is processed prior to combustion resulting in a
mixture of mainly CO2 and hydrogen. Both gas streams are subsequently
separated, so that the hydrogen can be combusted for electricity production
and the CO2 for storage.
-
Oxyfuel combustion - using pure oxygen instead of air when combusting
resulting in flue gas that contains mainly water vapor and CO2. Both
streams can easily be separated and treated further if necessary.
According to MIT’s Carbon Dioxide Capture and Storage Project Database,
there are approximately 40 carbon storage demonstration projects in various
scales running at present.290
But CCS is still an experimental technology,
or rather a collection of technologies which has yet to be proven at scale.
Such optimism in a technology is worrying, particularly as yet, not a single
coal plant has been built anywhere in the world that uses complete capture
and storage.
The first US pilot plant that can capture CO2 from coal burning, FutureGen,
was due online in 2012.
FutureGen began in 2003 by testing safety,
permanence and the economic feasibility of storing large volumes of CO2 in
geological structures at 22 test sites. A decision made by the Bush
Administration, however, appears to have stalled the progress of the
project.291
Disposal of CO2 under sea-beds is still at the research phase according to
the IPCC, who also states that pre- and post-combustion capture of the gas
has passed research and demonstration stages and is now ‘economically
feasible under specific conditions’.292
The cost of CCS
IPCC estimates that installing CCS at a coal-fired power plant could raise
the cost of generating power from 4-5 ¢/ kWh to between 6-10 ¢/ kWh.
So, CCS
could effectively double the cost of electricity from coal at worst and
increase the cost by a third at best. If the captured gas is used for
enhanced oil recovery (EOR), revenue could decrease to between 5-8 ¢/ kWh.
In the case of EOR, however, whilst CO2 is being stored deep underground,
more fossil fuels are being burned at its expense.
Natural gas can also be used with CCS technology. Gas can be transformed
into hydrogen by reacting high temperature steam with natural gas in a
process called ‘steam methane reformation’. When burned, hydrogen is
considered to be a clean fuel and can also be used in fuel cells. The carbon
within the natural gas is captured and pumped underground.
How quickly is CCS likely to become commercially viable?
Proponents of CCS claim that ‘all technology is proven at the desired scale;
we are only demonstrating the ability to integrate technology’.293 While a
number of CCS projects are underway, and have been for some time, there is a
plethora of serious concerns about this technology.294
It has been claimed
that all the necessary steps required for underground storage of CO2 have
been commercially proven, yet at a recent hearing of the Senate Energy and
Natural Resources Committee in 2007, the Director of the US Geological
Survey laid out a timeline of commercialization of workable CCS schemes
after 2012.295 He argued that the first commercial deployment would be
around 2020, with widespread CCS by 2045.
So what does this mean in terms of emission reductions?
One estimate by the
Natural Resources Defense Council’s Climate Centre suggests that if the
total number of new coal plants that analysts think will be built around the
world over the next 25 years were built without CCS, these new plants will
emit around 30 per cent more CO2 than all previous human uses of coal.296
But, if the first pilot plant for coal CCS is not going to be online until
2012 - this means the recent trend of increasing carbon intensity of the
economy is very likely to continue well into the new decade.
Is CCS the magic bullet?
If artificial carbon storage in the twenty-first century becomes the main
route of carbon emission reductions, the total carbon storage by the end of
the century could exceed 600GtC.297
Since this may be an unrealistic level
of artificial carbon sequestration, in Box 20, we examine the potential
implications of capturing 1-3 GtC per year.
|
Box 20: Achieving emissions
reductions through CCS
Assuming a rate of increase in
CCS of 70 Sleipner-sized* geological storage formations per year
over the next 50 years, providing a total artificial sink capacity
of 1 GtC per year would result in the cumulative storage of 27GtC of
carbon dioxide by 2050.
If this annual carbon capture rate was kept
constant over following 50 years until 2100, the cumulative carbon
dioxide stored would reach approximately 80 GtC. If this was
increased to 3GtC naturally the cumulative carbon stored would be
three times this amount (240 GtC).
*
Sleipner is the first operational carbon reserve. It is located in
the North Sea amd captures around 0.3 MtC every year.
By capturing this volume of carbon, it is reasonable to assume some
leakage would be unavoidable. It would be impossible to detect,
monitor and control all potential escape routes of CO2 for hundreds
if not thousands of years - therefore, geological storage cannot be
viewed as truly permanent.298
If we consider, on average a 1 per cent global leakage rate from the
cumulative reserves, the amount of carbon dioxide leaked from the
storage of just 1 GtC per year could, by the end of the century, be
of comparable size as the amount of carbon captured and stored (0.8
GtC leaked per annum) - i.e., recapture would be 80 per cent of the
emissions captured.
Whilst the annual leakage rate of 1 per cent is
arbitrary (the IPCC believes that a 99 per cent retention of CO2 is
‘very likely’ and ‘likely’ over 1,000 years) we must accept that the
more carbon dioxide we decide to capture and store in geological
reservoirs, the more energy intensive it will be to keep it there,
and monitor that it is still there, transferring the responsibility
to future generations.
Therefore, artificial carbon sequestration in geological reserves
should only be viewed as temporary relief, if at all. |
Risk of leakage
People often ask; ‘is geological storage [of carbon dioxide] safe’… it’s a
very difficult question to answer. Is driving safe...You might say yes or
no, but what makes driving something we’re willing to do…You get automakers
to build good cars, we have driver training, we don’t let children drive, we
have laws against drunk driving-we implement a whole system to ensure that
the activity is safe.299
Sally Benson, Executive Director, Global Climate and Energy Project
As journalist Jeff Goodell writes in his book
Big Coal, tens of thousands of
people may be destined to live above a giant bubble of CO2 and since,
‘CO2 is
buoyant underground it can migrate through cracks and faults in the earth,
pooling in unexpected places.’300
A sudden release of large amounts of CO2
due to, for example, an earthquake resulting in the fracturing or pipeline
failure could result in the immediate death of both people and animals,
since asphyxiation can result from inhalation of CO2 at just a 20 per cent
concentration.
Because CO2 is a colorless, odorless and tasteless gas; a
large leak would be undetected. An example of just how catastrophic a leak
could be is the natural limnic eruption of CO2 in 1986 from Lake Nyos in
Cameroon. The sudden release of 1.6 Mt CO2 resulted in the asphyxiation of
around 1,700 people and 3,500 livestock.
If this rules out the storage of CO2 in land-based geological sites, let us
consider sequestration in ocean saline aquifers, such as Sleipner in Norway.
Slow, gradual leakage of CO2 could result in the dissolution of CO2 in
shallow aquifers, causing the acidification of groundwater and undesirable
change in geochemistry (i.e., mobilization of toxic metals), water quality
(leaching of nutrients) and ecosystem health (e.g., pH impacts on
organisms).301
Transportation of captured carbon could also be problematic. CCS involves a
process of converting CO2 to something else, or moving it somewhere else.
Taking the transport of natural gas as an example, we can estimate how
secure CO2 transportation might be.
The world’s largest gas transport
system, 2,400km long running through Russia (the Russian gas transport
system), is estimated to lose around 1.4 per cent (a range of 1.0-2.5 per
cent).302 This is comparable to the amount of methane lost from US pipelines
(1.5 ± 0.5 per cent). Therefore, it is reasonable to assume that CO2 leakage
from transport through pipelines could be in the order of 1.5 per cent.
Furthermore, it is noteworthy that around 9 per cent of all natural gas
extracted is lost in the process of extraction, distribution and storage.
Storage capacity
A detailed analysis (rather than an estimate) of known US geological
sequestration sites undertaken by the US Department of Energy revealed that
only 3GtC could be stored in abandoned oil and gas fields.303 This estimate,
however, does exclude saline aquifers (very little is known about potential
US saline aquifers).
Assuming that the USA took responsibility for CO2 emissions that were
directly proportional to its share of global emissions, the USA’s capacity
to store its own carbon in known geological sequestration sites would be
exhausted in 12 years. Similarly, a recent analysis explored the potential
storage capacity in Europe.
The study found that based on Europe’s current
annual emission rate of 4.1 GtCO2 per year in the EU 25, the medium-range
estimate of storage capacity is only 20 times this.304 In other words, CCS
is clearly not a long-term solution, as ‘peak storage’ could be reached
relatively quickly.
Further sequestration would require expensive and potentially unsafe
pipelines directing CO2 to sequestration sites further a field. This would
be an energy-intensive process which is why CCS not only poses significant
future risks in terms of leakage, but also reduces the net energy gained
from a particular fuel - what has been called the ‘energy penalty’.305 Given
these problems, to put such faith in schemes which are operationally
immature, instead of decreasing our carbon emissions, seems outrageously
risky.
Surely it would be better not to produce the emissions in the first
place?
One further limitation of CCS is that, only one-third of emissions in
industrialized countries are actually produced in fossil-fuelled power
stations. A significant proportion comes from the transport sector (around
30 per cent), and as yet CCS has only been developed for static CO2 sources.
By pursuing a CCS pathway, we are encouraging our continued reliance on
fossil fuels delivering energy through a centralized system. Should CCS
become economically viable, it could act to undermine initiatives to move
towards a more efficient distributed energy system with diverse arrays of
low carbon energy sources.
Could CCS be another ‘just around the corner’ technology like nuclear
fusion? Will small-scale pilot projects ever realistically be scaled up to
make a significant impact on ever growing global emissions?
For over 50 years, physicists have been promising that power from nuclear
fusion (see Box 21) is on the horizon. While fusion has been achieved, in
the JET (Joint European Torus) reactor, the experimental rector did not
break even, i.e., it consumed more energy that it generated, but managed to
produce 16MW of energy for a few seconds.
In a Nature news feature, science
journalist Geoff Brumfiel commented that,
‘…the non-appearance [of nuclear
fusion] should give us some insight into how attempts to predict the future
can go wrong’.306
Back to Contents
The limits to nuclear
‘So the big question about nuclear ‘revival’ isn’t just who’d pay for such a
turkey, but also… why bother? Why keep on distorting markets and biasing
choices to divert scarce resources from the winners to the loser - a far
slower, costlier, harder, and riskier niche product - and paying a premium
to incur its many problems?
Nuclear advocates try to reverse the burden of
proof by claiming it’s the portfolio of non-nuclear alternatives that has an
unacceptably greater risk of non-adoption, but actual market behavior
suggests otherwise.’ 307
Amory Lovins, Chief Scientist, Rocky Mountain Institute
nef’s 2005 report Mirage and Oasis, made the case that nuclear power faced
insurmountable problems in living up to expectations placed upon the sector
to help deliver both energy security and an answer to climate change.308
The
report made the case that, if anything, an expanding nuclear program would
increase insecurity and, by distracting skills and other resources, delay
more effective solutions.
In his book -
The lean guide to nuclear energy: a life-cycle in trouble
- David Fleming introduces the term ‘energy bankruptcy’, referring to a point
in the nuclear energy life cycle where more energy is used in the life cycle
than can be supplied as electricity.309 Fleming illustrates that whilst
emissions of CO2 from nuclear energy superficially look ‘rather good’ at
approximately 60g/kWh (cf. 190g/kWh for natural gas), scratch the surface
and it becomes very clear that this comparison is very misleading.
Fleming identifies that the long-term disposal solution for nuclear waste
has been deferred, resulting in a ‘back log’ of emissions neither realised
nor accounted for yet.
Not only will we eventually have to face the
challenge of a long-term storage solution of nuclear waste, which will be a
very energy-intensive process due to the necessary over-engineering to
safeguard future generations from the hazardous waste, but emissions from
nuclear energy will grow relentlessly as uranium ores used progressively
turn to low-grade.
|
Box 21. Nuclear fusion
Nuclear fusion is technology
that produces energy by mimicking the Sun. The fusion of two
hydrogen nuclei (a hydrogen atom stripped of its electron) results
in the formation of a single Helium nucleus. Since the mass of a
single helium nucleus is less than the combined masses of the two
hydrogen nuclei, energy is released based on Einstein’s mass-energy
equivalence formula E = mc². Initiating the process of fusion
requires extremely high temperatures (hundreds of millions of °C),
as the positively charged nuclei need to overcome their natural
repulsion. This can only be achieved when the nuclei are moving very
fast or are closely packed together. As has often been commented,
any practical, large-scale application of fusion technology remains
decades away, as it has done for decades. |
Back to Contents
The hydrogen economy
It is often argued that the next evolutionary step in the global energy
system is the substitution of natural gas with hydrogen - often assumed to
be a zero-carbon fuel.
Whilst this is true at the point of end use, it
ignores carbon embedded within the fuel.
Hydrogen itself is not a source of energy, but a carrier. Because of this,
hydrogen first has to be produced from the reaction between carbon monoxide
(CO) and methanol, through steam reactions (steam reformation) with natural
gas, oil or even coal or by the electrolysis of water (efficiencies of fuel
cells and hydrogen production are discussed later). But there are two
problems here.
Hydrogen will only be truly zero carbon if it is produced through
zero-carbon electricity generation. A life-cycle assessment by the National
Renewable Energy Laboratory estimates the carbon emissions associated with
hydrogen production from the steam reformation of natural gas without CCS,
would equal just under 12kg of CO2e for every kg of H2
- one kg of H2 has a
similar energy content to 3m3 of natural gas, or the same amount of energy
required to drive a 2003 Golf Edition approximately 30km.310
A hydrogen economy, promoted as a zero-carbon energy source, based on the
energy system we have at present (i.e., dominance of fossil fuels) relies
heavily on the assumption that CCS is safe and secure. And, we have already
argued that CCS is by no means guaranteed to work, and there are limited gas
reserves.
Other alternatives to steam reforming include the electrolysis of water into
hydrogen by using a renewable energy source, such as wind.
Yet the process
of electrolyzing water to hydrogen, and then burning it as a clean fuel to
use in a fuel cell to produce electricity introduces two additional
inefficiencies. Why introduce these inefficiencies if there is zero-carbon
electricity generation in the first place? Secondly transportation of
hydrogen is expensive (both cost and energy).311
Whilst hydrogen may become an effective way of storing energy from
renewables to cope with intermittency of electricity supply from renewables,
such as wave, solar and wind (an issue often raised by those not in favor
of renewable energy), it doesn’t seem likely that the hydrogen economy will
be upon us any time soon.
|
Box 22: Hydrogen economy for the UK’s
transport system: is it possible? 312
If we decided to run Britain’s
road transport system, say, on cleanly produced hydrogen -
electrolyzing water using non-CO2-emitting forms of generation
- our
options would be:
All very well, but we’d also
need space for renewable energy technology for use in our homes,
offices and industries. |
Back to Contents
Biofuels
Whilst, biofuels can be produced sustainably and with real CO2 reductions
…in the industrialized world there simply isn’t the land.313
David Strahan, author of The Last Oil Shock (2007)
Concern for climate change and the rising price of oil has resulted in new
policies that aim to substitute petrol and diesel with biofuels.314 There
are, however, a number of unintended consequences of the agro-industrial
scaling out biofuels.
Last year the impact of the US’s significant drive for increasing production
of bioethanol had a significant impact on the food market because of the
diversion of cereals, specifically Maize away from animal feed.315
For
example, in its 2008 World Development Report,
The World Bank stated:
‘Biofuel production has pushed up feedstock prices. The clearest example is
maize, whose price rose by over 60 per cent from 2005 to 2007, largely
because of the US ethanol program [sic] combined with reduced stocks in
major exporting countries. Feedstock supplies are likely to remain
constrained in the near term.’ 316
The report then goes on to state:
‘The grain required to fill the tank of a sports utility vehicle with
ethanol…could feed one person for a year; this shows how food and fuel
compete. Rising prices of staple crops can cause significant welfare losses
for the poor, most of whom are net buyers of staple crops’
In other words, the rise in popularity of biofuels is creating competition
for land and water between crops grown for food and those grown to make
biofuels.
This has led to civil unrest around the world. For example, the
‘Tortilla Riots’ in Mexico in 2007 followed the dramatic rise in price of
corn (a staple food for poor households) as more land was given over for biofuel production.
In terms of climate change, new calculations looking at the full lifecycle
of palm oil production concluded that under a range of fairly typical
circumstances vastly more carbon was released into the atmosphere as a
result of growing palm oil, than results from burning fossil fuels. 317 In
the context of bioethanol, research has also shown that biofuels produced
from corn, wheat or barley all contain less energy than the energy required
to produce them.318
Research published earlier in 2007 showed that the growth of palm oil for
biodiesel for the European market is now the main cause of deforestation in
Indonesia.319 Because of deforestation and drainage of peat-lands necessary
to grow the crop, every tonne of palm oil created in South East Asia
resulted in up to 33 tonnes of carbon dioxide emissions - ten times as much
as conventional petroleum.
Separately, an estimate by a coalition of aid and
environment groups including Greenpeace, Oxfam, the RSPB, WWF and Friends of
the Earth, suggests that soya grown for biodiesel grown on deforested land
would take 200 years before it could be considered carbon neutral.320
In light of the seemingly unsustainable nature of biofuels, in 2008 the UK
government commissioned Edward Gallagher to examine the indirect impact of biofuels on climate change and food security.321 The review confirmed
growing concerns of the negative impacts of UK and EU biofuels policy on
land use, greenhouse gas emissions and food security.
In light of the
review, the UK government has agreed to reconsider its policy on biofuels.
|
Box 23:
Is the complete or even partial
substitution of diesel and petrol fuels with biofuels possible?
-
If the UK directly
substituted all its diesel and petrol fuels (by energy not
volume) to rapeseed oil biodiesel and corn bioethanol, the
amount of agricultural land required would be approximately 36
million hectares. To put this figure in context, the total land
area in the UK is just over 24 million hectares. Furthermore,
less than 20 per cent of the UK’s land is suitable for
agriculture.
-
To meet President Bush’s
goal of increasing bioethanol production from the five billion
gallons currently produced to 35 billion gallons by 2017 would
require more corn than the USA currently produces.322
-
To replace 10 per cent of
global petrol production with bioethanol, Brazil would have to
increase its ethanol production by a factor of 40, and would
result in the destruction of around 35 per cent of the remaining
Amazon Rainforest.
-
By increasing the
consumption of bioethanol to around 34 million barrels per year
by 2050, 1GtC of carbon could be offset, due to the substitution
of mineral liquid fuels.323 We find, however, that coupled to
population growth; this would require a 25 per cent increase in
cultivated land by 2050. This will clearly mean claiming a vast
amount of land from the already stressed natural environment.
|
Back to Contents
Geoengineering - technological saviour or damaging distraction?
‘There is a suspicion, and I have that suspicion myself, that a large number
of people who label themselves “green” are actually keen to take us back to
the 18th or even the 17th century. [Their argument is] “Let’s get away from
all the technological gizmos and developments of the 20th century”…And I
think that is utter hopelessness ... What I’m looking for are technological
solutions to a technologically driven problem, so the last thing we must do
is eschew technology.’
Professor Sir David King, former Chief Scientific Advisor to the UK
government 324
As we have shown earlier in this report, even modest changes to the
work-and-spend lifestyle of the global North would be hugely beneficial, yet
David King’s comments imply that the political consensus is that changes in
lifestyle should not be necessary and would be largely unwelcome. As a
result more novel solutions to climate change are beginning to receive more
and more interest.
Once an idea limited to the realms of a James Bond film, human manipulation
of climate - geoengineering - is increasingly being discussed by some of the
most respected climate scientists in the world.
From giant mirrors in space
reflecting sunlight away from Earth, to pumping aerosols into the
stratosphere, or large-scale cloud-seeding (releasing aerosols in the lower
atmosphere is thought to initiate the formation of clouds), geoengineering
could, in the not too distant future, become a reality.
In its current context,325 geoengineering technologies can be divided into
two categories: those that remove greenhouse gases from the atmosphere, and
those that reduce incoming solar radiation - with the intention of
offsetting the changes to Earth’s radiation budget caused by anthropogenic
greenhouse gases. The debate about the role geoengineering can and should
play in dealing with the impacts resulting from climate change is one which
is already beginning to gain momentum.326
In most cases, geoengineering schemes are viewed as a stopgap between now
and some point in the future where mitigation technology is cheaper and more
widespread. There are, however, large technical and scientific
uncertainties.
For example Professor David Victor, Director of the
Laboratory on International Law and Regulation at Stanford University
argues:
‘…real-world geoengineering will be a lot more complex and expensive
than currently thought because simple interventions—such as putting
reflective particles in the stratosphere—will be combined with many other
costlier interventions to offset nasty side effects.’327
The large majority of academics working in the field of geoengineering
research have been clear that their research and technical propositions are
not intended to distract from the efforts of reducing greenhouse gas
emissions as the first priority for controlling climate change.
However,
many now argue that a technological intervention may be required parallel to
current mitigation efforts.328
The Royal Society’s recent report Geoengineering the climate: Science,
governance and uncertainty assessed both technical and social aspects of
geoengineering options.329 With respect to the technical level, two
approaches are identified: Carbon Dioxide Removal (CDR) techniques and Solar
Radiation Management (SRM) techniques.
The objective of CDR methods is to remove CO2 from the atmosphere by;
enhancing uptake and storage by terrestrial biological systems, enhancing
uptake and storage of oceanic biological systems or using engineered systems
(physical, chemical, biochemical). In contrast to this, SRM techniques focus
on changing the Earth’s radiation budget by reducing shortwave radiation
absorbed by the Earth.
Both techniques have the ultimate aim of reducing
global temperatures, however they differ in their modes of action,
timescales over which they work, and costs. There is a general preference
towards CDR methods as a way to augment continuing mitigation action in the
long term, whilst SRM could provide short-term back-up for rapid reduction
in global temperatures.330
Of the two techniques, The Royal Society report found SRM to have the least
potential. This is due to high levels of uncertainty associated with
large-scale modification of the climate. In particular, climate scientists
have raised concerns about the potential impact SRM may have on rainfall
patterns.331 While temperatures may return to those of the pre-industrial
era, rainfall patterns would not.332
There is also particular concern about
the impact of SRM interventions on the Asian and African summer monsoons on
which billions depend.333
Furthermore, beyond non-invasive
laboratory/computer modeling and analogue case studies - the first phase of
research and development of SRM technologies - research would necessarily
involve intentional interventions with the climate system.
Because it is a
technology with many uncertainties, field experiments beyond limited
duration, magnitude and spatial-scale could involve some risk of unintended
climate consequences. Yet, the collection of direct empirical evidence from
large-scale field experiments would be a necessary part of any research
programme.334
Researchers have also highlighted that should any SRM intervention stop
abruptly or fail, global temperatures could rise rapidly.335 As the
concentration of CO2 in the atmosphere increases, carbon sinks would be
weakened with possible carbon-cycle feedbacks accelerating the increase in
CO2 concentration in the atmosphere.
Termination of the climate modulation
provided by a geoengineering scheme, could result in a temperature change of
2-4°C per decade (there is no evidence that global temperature changes have
approached this rate at any time over the last several glacial cycles).336
This rate of temperature change is 20 times faster than the rate predicted
under a business-as-usual scenario. Clearly such a rapid change in climate
would have devastating impacts on humans and the environment.
The Royal Society’s viewed CDR as having the most potential and as some
mimic natural processes (e.g. ecosystem-based CDR and some engineered CDR)
they may involve fewer risks compared to SRM. However, this category of
geoengineering is likely to be less effective in reducing global
temperatures quickly.
Both CDR and SRM are relatively under researched technologies.337
Specifically with respect to SRM, there has been limited consideration in
these proposals on the impact of continued increases in CO2 - this is the
most worrying.
For example, the direct effect of elevated CO2 could have
significant effects on the hydrological cycle. For example, a recent
modelling study showed that in the absence of climate warming and with
elevated CO2, changes to plant water use efficiency resulted in a decrease
in precipitation over vegetated areas in the Tropics. 338
However, one of the most critical reasons for making absolute cuts in CO2
emissions is due to acidification of ocean waters.339 As CO2 is absorbed by
the oceans, it forms a weak acid, called carbonic acid. Part of this acidity
is neutralized by the buffering effect of seawater, but the overall impact
is to increase the acidity.
According to a report by the Royal Society,
apart from global climate change, this should be the second largest
motivation for reducing CO2 emissions.340
So far, the acidity of the ocean
surface has increased by 0.1 units. General circulation models show that if
CO2 emissions from fossil fuels continue to rise, a reduction of 0.77 units
could occur by 2300.
To put this in perspective, over the past 300 million years, there is no
evidence that the pH of the ocean has ever declined by more than 0.6 units.
While there is limited research into the impact of pH decline on marine
biota, organisms which have calcium carbonate skeletons or shells, such as
molluscs, coral and calcareous plankton, may be particularly affected,
especially as a large proportion of marine life resides in surface water.341
Given that techniques for reducing acidity are unproven on a large scale and
could have additional negative impacts on the marine environment, it is
clear that a technical solution that only partially deals with controlling
the climate will not address anthropogenic interference of the carbon-cycle.
Whilst none of the current geoengineering methods currently offer immediate
solutions to the problems of climate change, nor do they replace the need to
continually reduce emissions- a growing group of academics now argue that
they could be a potential option to actively engineer the climate on a
planetary-scale to curb and control the impacts associated with a global
temperature rise of 2ºC or more.
Although our understanding of the climate system continues to improve, and
the forecasting skill of climate models improves, there is still no
guarantee that we’d be able to predict the implications of manipulating the
delicate energy balance of the climate system that has already been hurled
out of equilibrium.
As well as the technical feasibility of geoengineering, its application must
also be socially and ethically permissible.
The unknown factors associated
with manipulating climate change heighten the need for any decisions to be
mutually agreed upon and accepted. The language of ‘risk’ cannot be
disassociated from this debate as the changes created by geoengineering,
may, in the long term be irreversible.
So, if the effects of geoengineering
were to be irreversible, then those who made the decision to undertake these
technologies would be choosing one climate path for future generations
rather than another.342, 343
Back to Contents
How much can energy
efficiency really improve?
One hundred years ago, electricity production, at best was only 5-10 per
cent efficient. For every unit of fuel used, between 0.05 and 0.1 units of
electricity were produced. Today, the global average efficiency for
electricity generation is approaching 35 per cent and has remained largely
unchanged for the past 40 years.344
This may come as a surprise given the
often-held view that technology has continued to improve ess and will
continue to do so in the future.
Whilst this is largely due to the current
mix of the global energy system, rather than individual technologies, it
highlights two problems associated with the assumption that we can expect a
steady increase in energy efficiency/decline in carbon intensity of the
global economy. First, as a general rule of thumb, in a given technology
class, efficiency normally starts low, grows for decades to centuries and
levels-off at some fraction of its theoretical peak.345
As described earlier
in the report, the second law of thermodynamics, is one of the most
fundamental physical laws; it states that energy conversion always involves
dissipative losses (an increase in entropy). As such, any conversion can
never be 100 per cent efficient.
The results of our analyses have shown, future stabilization pathways are
dependent on assumptions about energy intensity and, therefore, energy
efficiency. These assumptions fail to acknowledge, however, that in many
cases of ess, engineers have already expended considerable effort to
increase the energy efficiency.346
Second, we are built into and are still building ourselves into a
centralized energy system. Such systems favor fossil and nuclear fuels over
renewable energy, do not exploit the maximum efficiency possible (i.e., do
not favor a system where an exergy cascade, such as combined heat and
power, can be utilized), and the energy system is subject to large
distribution loses.
This is likely to continue into the future if energy
policies rely heavily on nuclear and CCS schemes.
Particularly given that
CCS reduces the efficiency of the energy system, and nuclear fission is a
mature technology, already approaching its efficiency limit, and is far from
being carbon neutral, as is often claimed. If nuclear fusion ever becomes a
viable option, it is likely to have the same thermal efficiencies as nuclear
fission.347
In other words, many of the technologies that make up the global
energy system are mature technologies and their current efficiencies are at
or almost at their practical maximums.
Figure 20:
Average lifespans for
selected energy/related capital stock348
The slow capital stock turnover for large energy infrastructure
- shown in
Figure 20 also means that energy decisions made now will influence the
trajectory of emissions over the next 25-60 years, with obvious implications
for the speed at which a transition to a low carbon economy can take place.
Amongst the most efficient technologies are large electric generators (98-99
per cent efficient) and motors (90-97 per cent). This is followed by
rotating heat engines that are limited by the Carnot efficiency limits
(35-50 per cent), diesel (30-35 per cent) and internal combustion engines
(15-25 per cent).
Improvements in these areas are, therefore, small. In
fact, the energy efficiency of steam boilers and electrical generators has
been close to maximum efficiency for more than half a century. 349
Similarly, the most efficient domestic hot water and home heating systems
have been close to maximum efficiency for a few decades.350
Whilst hydrogen fuel cells are often pursued as future sources of ‘clean,
zero-carbon, highly efficient sources of energy’, there are also upper
limits to the energy efficiency achievable. Fuel cells are currently 50-55
per cent efficient, and are believed to reach a maximum at around 70 per
cent. This is due to limits imposed by electrolytes, electrode materials and
catalysts within the fuel cell system. Additionally the production of
hydrogen from oil or methanol is has a maximum efficiency of 75-80 per
cent.351
In terms of renewable energy, photovoltaic (PV) cells currently have
efficiencies between 15 and 20 per cent (in commercial arrays) with a
theoretical peak of around 24 per cent (highest recorded efficiency = 24.7
per cent).
This maximum is higher for multi-band cells and lower for more
cost-effective amorphous thin films. Wind turbines have commercial limits
are around 30-40 per cent, with a maximum efficiency limit of 59.6 per cent
- the Betz limit.352 Hydroelectric power is already at its maximum average
efficiency of around 85 per cent.353
Photosynthesis is highly inefficient in converting sunlight into chemical
energy with the most productive ecosystems being around 1-2 per cent
efficient and a theoretical peak of around 8 per cent. The extent of
bioenergy is also restricted by the volume of biomass necessary versus land
available which is possibly not greater than 30 per cent of the Earth’s
land-surface.
In the case of lighting, high pressure sodium vapor has an energy
efficiency of around 15-20 per cent, whilst fluorescent (10-12 per cent) and
incandescent (2-5 per cent) illumination generate more heat than light.
For transport systems, specifically road transport, improvements in private
vehicle efficiencies are largely due to vehicle mass (see Box 9), driving
patterns and aerodynamic drag and the use of technology such as regenerative
breaking (electric power recovery from mechanical energy otherwise lost).
The efficiency of the internal combustion and diesel engine are largely at
their maximum.
Further improvements could be made by hybrid, electric
(dependent on the central power plant efficiency) or fuel cell vehicles.
Box
24 shows a similar leveling of in aviation efficiency gains.
|
Box 24. Aviation eating up efficiency
gains
Some are optimistic that
technological improvements will allow air travel to continue to grow
into the future while keeping emissions under control - and
eventually reducing them overall. This kind of optimism was embodied
by the strap line that heralded the new Airbus A380 on its maiden
flight from Singapore to Sydney in 2007: ‘cleaner, greener, quieter,
smarter’.
Overall fuel efficiency gains of 70 per cent between 1960 and 2000
are often cited as evidence for continued improvements in
efficiency.
For example, the Air Transport Action Group has said:
‘Building on its impressive environmental record, which includes a
70 per cent reduction in… emissions at source during the past 40
years, the aviation industry reaffirmed its commitment to… further
develop and use technologies and operational procedures aimed at
minimizing noise, fuel consumption and emissions.’354
There is little evidence, however, that major improvements will be
made in the near future. Despite technological achievements so far,
absolute growth in fuel use by aircraft has grown by at least 3 per
cent per year.355 Quite simply, the efficiency improvements of 0.5
to 1.3 per cent a year that have been achieved are being dwarfed by
the industry’s annual growth of 5-6 per cent.356 The time it takes
to pension off and replace commercial aircraft is long, and any
additional efficiency gains anticipated are likely to be wiped out
by a continuing increase in flights.357
The Advisory Council for Aeronautics Research in Europe (ACARE) has
established ambitious goals for improvements to aircraft efficiency.
By 2020, it wants the industry to achieve a 50 per cent reduction in
CO2 per passenger kilometer. Of this, 15-20 per cent will be from
improvements to engines, 20-25 per cent from airframe improvements
and a further 5-10 per cent from air traffic management.358
But to
achieve these targets, the industry would need to improve its
efficiency by over 2.5 per cent per year. In reality, efficiency
gains of just 1 per cent have been described as ‘rather optimistic’
given that the jet engine is now regarded as mature technology, and
annual efficiency improvements are already falling.359
An analysis of projected aviation growth and anticipated
improvements in aircraft efficiency suggests that if growth in
Europe continues at 5 per cent, traffic will double by 2020
(relative to 2005). With an ‘ambitious’ 1 per cent annual
improvement in fleet efficiency, CO2 emissions would rise by 60 per
cent by 2020 (and 79 per cent if emission trading did not affect
growth).
Even if a 10 per cent reduction in CO2 per passenger
kilometer were to be achieved, CO2 emissions would rise by 45 per
cent.360
Figure 21 shows long-haul aircraft efficiency gains since 1950 as an
index based on the De Havilland DH106 Comet 4 (the least efficient
long-haul jet airliner that ever flew). It shows a sharp improvement
in efficiency between 1960 and 1980 but a steady slowing of
efficiency gains since then. Further efficiency gains between 2000
and 2040 are likely to be in the order of 20-25 per cent.361
Even
the performance of the new Airbus A380 fits neatly into the
regression, indicating that the 50 per cent more efficient aircraft
that some have predicted by 2020 are highly unlikely. |
Figure 21.
Long-haul aircraft efficiency
gains since 1950 as an index based on the De Havilland DH106 Comet 4.362
Figure 22.
EROI for various electric
power generators.363
One way of comparing efficiencies of different technologies is through an
EROI assessment.
Figure 22 shows various EROI ratios for a number of
electric power generators. It shows that wind turbines compares favorably
with other power generation systems. Base load coal-fired power generation
has an EROI between 5 and 10:1. Nuclear power is probably no greater than
5:1, although there is considerable debate regarding how to calculate its
EROI.
The EROI for hydropower probably exceeds 10, but in most places in the
world the most favorable sites have already been developed.
Practical limitations to the improvements in supply-side energy efficiency
An increase in resource efficiencies alone leads to nothing, unless it goes
hand in hand with an intelligent restraint of growth.364
Wolfgang Sachs (1999)
In terms of work generation from a heat engine (where heat is converted to
work), the Carnot efficiency, named after the French Physicist Nicolas Léonard Sadi Carnot, determines the maximum efficiency in which this can be
achieved.
The thermal efficiency of gas and steam turbines is a function of the
temperature difference between the inlet temperature and the outlet
temperature. In a perfect Carnot cycle, the maximum efficiency that can be
achieved is around 85 per cent. In reality, the most efficient
combined-cycle gas turbine (CCGT) plants have efficiencies in the range of
59-61 per cent.
In a CCGT, gas is used to drive a turbine and the exhaust
gases are used to raise steam to drive a second turbine. The high efficiency
of this type of turbine is due to the use of both the gas and the ‘waste’
exhaust gases. Currently, however, the average fossil-fuelled power plant is
approximately 33 per cent efficient.365
With the potentially imminent
peaking in production of gas, it seems unlikely this will change
significantly in the future.
An Integrated Gasification Combined Cycle plant (IGCC), is a similar
technology to CCGT, but uses coal as a feedstock. Coal is converted into a
synthetic gas and then used in a CCGT.
The efficiency of an IGCC is in the
range of 30-45 per cent. Obviously, without CCS, this process would act to
increase the carbon intensity of the economy, but with CCS the efficiency of
the plant declines. Biomass could be used as a feedstock however, which
could have a significant impact on the level of carbon emissions.
Fuel cell technology converts the chemical energy of fuels directly
(electrochemically rather than through combustion) and therefore, is not
restricted by the Carnot efficiency limit. Therefore, considerably higher
efficiencies can be met. There are a number of different types of fuel cells
entering the market. Generally all fuel cells run on hydrogen, although some
can run on fuels such as CO, methanol, natural gas or even coal if
externally converted to hydrogen.366
The advantage of fuel cells is that
emissions at point of use are simply water vapor and therefore could
significantly contribute to a reduction in urban pollution.
But, as
described earlier in the report, hydrogen is not a fuel; it is a carrier of
energy. And, if the hydrogen is produced from a hydrocarbon fuel, then the
benefits as a low carbon solution are reduced. Furthermore, scaled up
significantly, fuel cell technology will hit other limiting factors, such as
the availability of the metal platinum - a catalyst in the fuel cell.
It is useful at this point to return to the term ‘exergy’. This describes
the maximum useful work obtainable from an energy system at a given state in
a specified environment.
By and large, any attempt to increase the overall efficiency of a
supply-side energy process could be achieved by making use of low exergy
products as well as high exergy products of energy generation. An example of
this is CCGT (described above) or a combined heat and power station
(co-generation). Co-generation involves the recovery of thermal energy that
is normally lost or wasted. Both electricity and the low-grade waste heat
are used for both powering appliances and heating.
By adding district
heating capacity to a CCGT, efficiency can increase to almost 80 per cent.
Distributed generation?
An area that is strongly associated with efficiency of the energy industry
is distributed generation. While its main benefits are cleaner and more
efficient generation and location of generation closer to demand,
distributed generation also has an effect on losses.
In simple terms,
locating generation closer to demand will reduce distribution losses as the
distance electricity is transported will be shortened, the number of voltage
transformation levels this electricity undergoes is lessened and the freed
capacity will reduce utilization levels.367
Ofgem (2003)
Using an economic model developed by the World Alliance for
Decentralized
Energy (WADE),368 it has been repeatedly shown that the pursuit of a
decentralized renewable energy system with cogeneration is becoming
increasingly economically attractive; not only for mitigating climate
change, but also in the face of dwindling fossil fuel reserves.369
Centralized energy systems, such as the UK’s on average lose 9.3 per cent
(global average is 7.5 per cent) of all electricity generated through
transmission and distribution losses.370
Ofgem estimated that the UK could
achieve approximately 4 per cent of the UK government’s domestic target of a
20 per cent reduction in CO2e by 2010 through simply reducing distribution
losses by 1 per cent. When these distribution losses are considered, the
argument against a new nuclear age or large-scale CCS is strengthened
further.
Distributed energy is a favorable pathway for developing nations. This is
because a centralized energy system using a transmission network like the
National Grid requires a high capital transmission and distribution network.
Once in place, the network will also have high operation and maintenance
costs as well as significant energy losses.
The challenges to decentralized energy are fourfold, however:
-
Policy and regulatory barriers to
decentralized energy.
-
Lack of awareness and effectiveness of
decentralized energy.
-
Failure of industrial end-users to accept and adapt to
decentralized
energy agenda.
-
Concerns regarding the dependence of
decentralized/cogeneration of fossil
fuels. Indeed, the decentralized system proposed by Ken Livingstone, is
based on combined heat and power from CCGT.
Cogeneration lends itself to specific types of generation, generally small
scale (less efficient), close to where the low-grade heat can be used.
This,
therefore excludes nuclear. It is also difficult to obtain large and/or
consistent benefits from cogeneration, since the normally lost or waste heat
cannot be stored until needed. Thus, it is necessary to try to balance the
amount and timing of the loads between electricity generation and heat
utilization.371
Given this,
‘cogeneration is likely to remain a relatively minor contributor
to improved energy efficiency.’372
Nevertheless, a decentralized energy
system is still more efficient in terms of transmission and distribution
losses.
The absolute theoretical efficiency that can be achieved assumes that energy
operations experience no losses. It is estimated that ess is currently 37
per cent at the global level and that a two-fold increases may be possible,
i.e., a 200 per cent improvement in ess.373
But the assumption that the
types of technology that could lead to such a significant change will become
commercially available and installed at a rate concomitant with within the
timescales necessary to stabilize greenhouse gas concentrations at a ‘safe
level’ is questionable.
Whilst the limits of thermodynamics only apply to the heat engine (thermal)
generation of electricity, there are also theoretical and practical limits
to the use of renewable energy, also based on the second law of
thermodynamics.
The limits to a renewable energy fix
There are numerous reasons for a rapid transition to a global energy system
based on renewable technologies: wind, water and solar.
As described
throughout this report, these include climate change, energy security in the
face of Peak Oil, cost-effective conversion and flexible and secure supply.
Several studies have shown that, although not without a few difficulties to
overcome, it is both practical and possible to meet the global demand for
energy from these sources.374
One recent study published in Scientific American in late 2009 outlined a
plan to achieve just this - the complete decarbonisation of the global
energy system - by the year 2030.375
Based only on existing technology that
can already be applied on a large scale, it called for the building of 3.8
million large wind turbines, 90,000 solar plants and a combination of
geothermal, tidal and rooftop solar-PV installations globally.
The authors
point out that while this is undeniably a bold scheme, the world already
produces 73 million cars and light trucks every year. And, for comparison,
starting in 1956 the US Interstate Highway System managed to build 47,000
miles of highway in just over three decades, ‘changing commerce and
society’.
But, even plentiful supplies of renewable energy are not a ‘get out of jail
free’ card for economic growth. The reasons are few and straightforward.
-
First, growth has a natural resource footprint that goes far beyond energy
and we have to learn to live within the waste-absorbing and regenerative
capacity of the whole biosphere.
-
Secondly, even under the most ambitious program of substituting new renewable energy for old fossil fuel systems,
it will take time and, in climate terms, we are, according at least to James
Hansen, already beyond safe limits of greenhouse gas concentrations.376
More global growth will take us even further beyond, with few guarantees
that in the space of a few short years the chances of avoiding runaway
climate change become unacceptably small.
-
Thirdly, we also have to take into
account the fact that, at least until renewable energy achieves a scale
whereby its own generated energy becomes self-reproducing in terms of the
energy needed for manufacture, even renewable energy systems have a resource
footprint to account for.
For example, recent research by the Tyndall Centre
for Climate Change Research suggests that embodied energy in new energy
infrastructure means that it would be approximately eight years before a decarbonisation plan would have a meaningful impact on emissions.377
Renewable technologies are rightly regarded as a potential source of future
employment and have a large economic contribution to make, and tend to be
seen as carbon neutral or potentially negative.378
Despite this, their
overall environmental impact is not entirely benign, and this is
particularly evident when renewable technologies are considered on a
large-scale, something that is regularly assumed in future emission/
economic growth scenarios.
Renewable energy supply is still constrained by the laws of thermodynamics,
since energy is being removed from a system; the natural system of the
Earth. Whilst this refers to the theoretical limits of energy from renewable
sources, there are also practical limits; for example,
‘…large enough
interventions in [these] natural energy flows and stocks can have immediate
and adverse effects on environmental services essential to human
well-being’.379
This is most obviously the case where biomass (e.g. biofuels)
are concerned. It has been suggested that given that 30-40 per cent of the
terrestrial primary productivity is already appropriated by humans; any
major increase could cause the collapse of critical ecosystems.380
In the IEA AP scenario, it is assumed that biofuels, such as biodiesel and
bioethanol will replace mineral oil for use in transport. Without
encouraging more land-use change, a major anthropogenic contributor to CO2
emissions, relying on energy biomass to provide a natural replacement to
gasoline (petrol) would mean competition of agricultural land for food and
fuel. Yet, with increasing population and increasing energy requirements is
this physically possible without causing widespread ecosystem collapse?
This
is one of the key reasons why Jacobsen and Delucchi, authors of the study
published in Scientific American, do not rely on biofuels in their plan.381
Not all biofuels, though, are reliant on a primary resource feedstock, such
as sugarcane and corn (bioethanol) or rapeseed and soya (biodiesel).
Cellulosic ethanol can potentially be produced from agricultural plant
wastes, such as corn stover, cereal straws, sugarcane bagasse, paper, etc.
The technology, however, requires aggressive research and development as it
is not yet commercially viable.
At present the energy intensity of this type of ethanol production means
that the overall energy value of the product is negative, or only marginally
positive, although it is hoped that this will improve as technology
develops.382
However, a number of experts feel less positive.383
For
example: according to Eric Holt-Giménez, the executive director of FoodFirst/Institute
for Food and Development Policy:
‘The fact is that with cellulosic ethanol,
we don’t have the technology yet. We need major breakthroughs in plant
physiology. We might have to wait for cellulosic for a long time.’384
Elsewhere, approximately one-half of the global available hydro power has
already been harnessed. Little efficiency improvement, also, can be expected
from wind turbines, which are at about 80 per cent of the maximum
theoretical efficiency.385
The efficiency of solar PV cells could, however,
increase from the present 15 per cent to between 20 per cent and 28 per cent
in unconcentrated sunlight.386
To be unequivocal, renewable energy is a very good thing and has enormous
potential to expand. Something like the Jacobson and Delucchi plan for 2030
is an urgent necessity at a global level if we are to avoid catastrophic
global warming.387 As we have shown, zero-carbon or low carbon energy
sources are not infinite.
Therefore there is no excuse to avoid addressing
the waste of energy.
Practical limits to energy efficiency (demand and supply side)
In general, energy efficiency improves at a slow rate of around 1 per cent
per year.
This rate is not policy-induced and is entirely due to
technological developments the Autonomous Energy Efficiency Improvement
parameter (AEEI). This global figure, however, has a regional signature. For
example, evidence in 1990 suggested that the pace of AEEI in the USA slowed
or stopped.388
Overall an energy efficiency improvement rate of 2 per cent (AEEI plus
policy intervention) per year is often considered achievable. Higher
energy-efficiency improvement rates in the range of 3-3.5 per cent are also
thought to be possible due to continuous innovation in the field of energy
efficiency.389
For industrialized countries, this means a reduction of
primary energy use by 50 per cent in 50 years compared to current levels.
This means that in spite of the doubling of energy use under
business-as-usual conditions, the energy use could be as low as 50 per cent
of the current level.390
But given the limitations discussed above, significant improvements to
efficiency increases are only likely to be due to improvements in chemical
processes rather than fuel combustion and increases in end-user energy
efficiency.391
In terms of end-user efficiency, there is a long way to go. ‘Unrealised’
energy conservation measures in OECD countries may amount to 30 per cent of
total energy consumption.392,393
Some suggest that if there are no economic,
social or political barriers, an instantaneous replacement of current energy
systems by the best available technology would result in an overall
efficiency improvement of 60 per cent.394 This is contrary to the forecast
improvement of efficiency by 270 per cent if historical efficiency
improvement rate of 1 per cent continues and is maintained over the next 100
years.
And, even if this was possible, the improvement rate of 1 per cent
would be unlikely to continue beyond 100 years.395
Demand side barriers
When energy efficiency promoters claim that we can get more out of less, we
must conclude that the focus so far has been to get more out, period! 396
Nakicenovic and Gruebler (1993)
Throughout this report, we have shown that observations of changes to carbon
intensity and energy intensity of the economy over the past decade have
failed to improve at a rate necessary to slow the increase in greenhouse gas
concentrations, and in recent years appear to be heading in the opposite
direction.
This is supported by a recent report by the IEA on trends in
energy consumption between 1973 and 2004.397
The report found that while
energy intensity had fallen by over 30 per cent since 1973 - it now takes
one third less energy to produce a unit of GDP in IEA economies - the rate
of change has slowed.398 Improvements in energy intensity have slowed in all
sectors of the economy since the 1980s.
As such, projecting forward
historical rates of energy efficiency are misleading. But this is the basic
assumption made by most the future emissions scenarios.
While we have shown that improvements to supply-side efficiency is limited
by practical limits to energy conversion and technological, what are the
drivers of demand side energy efficiency? Earlier in the report we discussed
the significance of the rebound effect, whereby efficiency savings are
offset by increases in consumption (see Box 8). There are a number of
additional barriers to demand side efficiency - eeu (see Equation 1). These
are shown in Box 25.
All these factors contribute to the failure of energy efficiency to drive
absolute emissions downward. The main reason, however, relates to the market
imperfection. For example the IEA found that the price signals in the 1970s
did more to increase efficiency than improved technology has done since the
1980s.399
In other words, the cost of energy is currently too low. Because
of subsidies or the externalization of the environmental cost, the wasteful
use of energy is encouraged.
Limits to the speed of technological uptake
The magnitude of implied infrastructure transition suggest the need for
massive investments in innovation energy research.400
Hoffert et al. (1998)
Based on historical evidence, what is the capacity for social and
institutional organizations to rapidly change? Is there a limit to our
ability to produce knowledge and new technology to deal with a problem?
Surprisingly, this is a vastly under researched field.
For example, Tim Lenton and colleagues conclude in their paper on tipping points with the
following statement:
‘A rigorous study of potential tipping elements in
human socioeconomic systems would also be welcome, especially to address
whether and how a rapid societal transition toward sustainability could be
triggered, given that some models suggest there exists a tipping point for
the transition to a low-carbon-energy system.’401
|
Box 25. Barriers for energy
efficiency improvements 402, 403
Technical barriers:
Options may not yet be available, or actors may consider options not
sufficiently proven to adopt them.
Knowledge/information barriers: Actors may not be informed
about possibilities for energy-efficiency improvement. Or they know
certain technologies, but they are not aware to what extent the
technology might be applicable to them.
Economic barriers: The standard economic barrier is that a
certain technology does not satisfy the profitability criteria set
by firms. Another barrier can be the lack of capital for investment.
Also the fact that the old equipment is not yet depreciated can be
considered as an economic barrier.
Institutional barriers: Especially in energy-extensive
companies there is no well-defined structure to decide upon and
carry out energy-efficiency investments.
The investor-user or landlord-tenant barrier: This barrier is
a representative of a group of barriers that relate to the fact that
the one carrying out an investment in energy efficiency improvement
(e.g., the owner of an office building) may not be the one who has
the financial benefits (in this example the user of the office
building who pays the energy bill).
Lack of interest in energy-efficiency improvement: May be
considered as an umbrella barrier. For the vast majority of actors,
the costs of energy are so small compared to their total (production
or consumption) costs that energy-efficiency improvement is even not
taken into consideration. Furthermore, there is a tendency that
companies, organizations and households focus on their core
activities only. |
While there is a growing awareness of the urgency with which the transition
to a low carbon economy must be made, identification of potential tipping
elements in human systems is still a largely under-researched area.
A recent report to the US Department of Energy has noted that it takes
decades to remake energy infrastructures.404 This is further supported by
Figure 20 which maps capital stock turnover rates for energy related
infrastructure. Decisions made now in terms of transport and energy
infrastructure and the built environment will determine the capability of a
nation to reduce its carbon footprint.
Highly centralized energy systems,
inefficient buildings and poor planning will make a difficult task even more
challenging.
Climate change has long been viewed as a pollution problem. This has led to
the interpretation of climate change in predominantly scientific terms by
policy makers, the media and environmental NGOs resulting in technocentric
responses gaining more interest than any more systemic change.
However, the
growing emphasis on the technological or market-based initiatives as a
cure-all ignores what we have shown in this report - that the challenges we
currently face, have their roots in a faulty economic system. So, with the
vast majority of efficiencies realized, it appears restructuring of the
economic system may be the only route by which we can achieve the emission
cuts necessary.
In the context of energy systems, the findings of this report only add to
the desirability of carefully considered low carbon planning, and other
prompt actions to slow down the use of energy and resources.
Such solutions
can also improve inter alia resilience to exogenous shocks such as volatile
food or energy prices, local economic regeneration, social cohesion,
physical and mental well-being, employment opportunities and the increased
individual and community capacity to reduce emissions and resource use.
For
example, investment into renewable energy can create new jobs often in areas
where they are needed the most. If installed at the local level, renewable
energy schemes can also contribute to local economic regeneration, social
cohesion (an important factor for adaptive capacity) and improve
environmental literacy.
Energy efficiency and decentralized or low carbon
energy production targeted at low-income households also has the potential
to reduce fuel poverty or access to energy caused by poor living standards
and low-incomes.
Back to Contents
Equity considerations
So far, in the growth and emissions scenarios, we have abstracted from
national differences to look solely at globally aggregate data.
Unfortunately, detailed national projections for fuel mix and fuel usage are
not readily available, not to mention the difficulty of making assumptions
about national technology levels and adoption speeds. It is possible,
however, to look at national level GDP and growth data, as this is more
easily available. Additionally we have been abstracting from actual
predictions of growth to look at the energy and emissions possibilities
given varying levels of growth.
The scenarios presented earlier indicate that even with very optimistic
assumptions about energy and carbon intensity improvements and technology
adoption, the world will not meet the target for emissions reductions.
To
meet that target will require aggressive technological improvements combined
with a slowing of our use of resources and a reduced demand for
energy-intensive goods and services. That implies lower growth. Yet the
world is not an equal place, with income and emissions levels varying by
orders of magnitude from one country to the next.
Expecting reductions in
growth along with carbon/energy intensity improvements may seem reasonable
for industrialized economies, where additional income does little to
increase well-being in society.
Clearly the situation is different in low-income countries, some of which
have incredibly low income levels along with their high mortality rates, low
life expectancy and low measures of well-being.
These countries could not be
expected to bear equal measures of growth reduction, especially since they
were not responsible for the historical emissions which have brought us to
this critical threshold of rapid climate change.
Allowing some low-income countries to grow rapidly and offsetting that with
further reductions of growth in the industrialized world would not be very
costly for most cases, as the low-income countries start with low bases of
economic size. Ten per cent growth in Malawi, for example, would require
little offsetting growth reductions in the UK.
But this is not uniformly the
case. Leaving aside the problems of domestic inequality, fast-growing
economies such as India and China have large bases of economic activity,
despite their comparatively lower per capita incomes. Faster growth in those
two economies, which could help eliminate global poverty if well distributed, would need to be accompanied by off-setting reductions in the
industrialized world.405
Consumption in the North simply cannot continue at
its current level if society is to address both the poverty and climate
change problems.
Back to Contents
If not the
economics of global growth, then what?
Getting an economy the right size for the planet
The stationary state
The lineage of the notion of ‘one planet living’ can be traced at least as
far back as the early nineteenth century. Philosopher and political
economist John Stuart Mill was shaped by the human and environmental havoc
of the voracious Industrial Revolution.
In reaction to it, he argued that, once certain conditions had been met, the
economy should aspire to exist in a ‘stationary state’. It was a hugely
radical notion for the time. Mill thought that an intelligent application of
technology, family planning, equal rights, and a dynamic combination of a
progressive workers movement with the growth of consumer cooperatives could
tame the worst excesses of capitalism and liberate society from the
motivation of conspicuous consumption.
He prefigured Kropotkin’s analysis that economics could learn from the
success of cooperation, or ‘mutual aid’ as he coined it, in ecological
systems, itself a riposte to the fashionable misappropriation of Darwinism
to social and economic problems.406
The latter economic folk wisdom remains
nevertheless strong. And even today, the Anglo Saxon economic model is
commonly defended with similar misappropriations of Darwin that emphasize
the ‘law of the jungle’ and ‘survival of the fittest.’
This view suggests
that competition in economics, as in nature, should be the natural, dominant
mode of operation. Yet, actual evolutionary biology has moved far beyond
this caricature, identifying a wide range of different and equally
successful strategies in evolution alongside competition.407
These include symbiosis (an example of which is the bacteria which fix
nitrogen in plant roots consequently making life possible), collaboration
(as was the case with primeval slime mould), co-evolution (the pollinating
honey bee responsible for about one in three mouthfuls of the food we eat),
and even reason (as with problem solving animals - like elephants, dogs,
cats, rats, sperm whales and, sometimes, humans).
Optimal diversity too is
considered a key condition - nature’s insurance policy against disaster - suggesting that economic systems which allow clone towns to be dominated by
massive global chain stores, are probably a bad idea.
Mill also prefigured Keynes’s hope, and similar faith in technology, that
once the ‘economic problem’ was solved, we would all be able to turn to more
satisfying pursuits, and put our feet up more.
He also prepared the ground
for the emergence of ecological economics.
The Steady state
In a fairly direct line of intellectual descent, economist Herman Daly has
done perhaps more than anyone to popularize the notion of what he calls
‘steady state’ economics.
His comprehensive critique, worked-up over
decades, decries the absence of any notion of optimal scale in
macro-economics, and the persistent, more general refusal of the economics
profession to accept that it, too, like the rest of life on the planet, is
bound by the laws of physics (see Introduction).
As he wrote in Beyond Growth:
‘Since the earth itself is developing without
growing, it follows that a subsystem of the earth (the economy) must
eventually conform to the same behavioral mode of development without
growth.’408
Of course the big question concerns when, precisely, the ‘eventually’ moment
comes. Daly borrows a public safety analogy from the shipping industry to
demonstrate what is needed ecologically at the planetary level.
The introduction of the ‘Plimsoll line’ was, so to speak, a watershed to do
with a watermark. When a boat is too full, rather obviously it is more
likely to sink. The problem used to be that, without any clear warning that
a safe maximum carrying capacity had been reached, there was always an
economic incentive to err on the incautious side by overfilling.
The Plimsoll line solved the problem with elegant simplicity: a mark painted on
the outside of the hull that indicates a maximum load once level with the
water.
Daly’s challenge to economics is to adopt or design an equivalent, ‘To keep
the weight, the absolute scale, of the economy from sinking our biospheric
ark’.409 But Daly is not a crude environmental determinist; for any model to
work he insists that alongside optimal scale, equally important is a
mechanism for optimal distribution based on equity and sufficiency.
To date, the nearest, in fact, only, leading contender to provide the
environmental Plimsoll line is the Ecological Footprint. Before the
Contraction and Convergence model, which is designed to manage safely
greenhouse gas emissions, was ever thought of, Daly identified its basic
mechanism as the way to manage the global environmental commons.
First, he
said, you need to identify the limit of whichever aspect of our natural
resources and biocapacity concerns you, then within that, allocate equitable
entitlements and, in order to allow flexibility, make them tradable. Such an
approach could be applied to the management of the world’s forests and
oceans as much as CO2.
Daly credits the innovative American architect and
polymath Richard Buckminster Fuller for first suggesting the approach. At a
fundamental level, this is the primary mechanism to avoid the tragedy of the
commons.
In addition, an indicator such as the Happy Planet Index 410 which
incorporates the Ecological Footprint helps to reveal the degree of
efficiency with which precious natural resources are converted into the
meaningful human outcomes of long and happy lives.
At the ‘eventually’ moment, or rather well before, these other ways of
organizing and measuring the economy become vital. In one sense it has
already passed. According to the Ecological Footprint, the world has been
over-burdening its biocapacity - consuming too many natural resources and
producing more waste than can be safely absorbed - since the mid-1980s.
We’ve been living beyond our ecological means. But, at what point does the
damage become irreversible? This will be different for different ecosystems.
But, where climate change is concerned, we have drawn a line in the
atmospheric sand at the end of 2016.
Based on current trends and several
conservative assumptions, at that point, greenhouse gas concentrations will
begin to push a new, more perilous phase of global warming.411
Dynamic equilibrium
‘Stationary’, ‘steady’, up to a point these words communicate the message
that, logically, a subset of a system (the economy) cannot outgrow the
system itself (the planet), and the need to establish a balance. Why suggest
yet another term for an essential characteristic of true sustainability?
Yet, the terms ‘stationary’, and ‘steady’, are unattractive for our
purposes. They fail to capture sufficiently the dynamism of the interactions
between human society, the economy and the biosphere. They wrongly appear to
suggest for economics, what was once famously, and with epic error announced
for history, namely its end.
But, on the contrary, writes Daly, it is just that a very different
economics is needed, one that is,
‘a subtle and complex economics of
maintenance, qualitative improvements, sharing frugality, and adaptation to
natural limits, It is an economics of better, not bigger’.412
‘Dynamic equilibrium’, is both a more accurate description of the condition
we have to find and manage, and a more attractive term.
Found typically in
discussions of population biology and forest ecology, it captures a mirror
of nature for society, in which, within ecosystem limits, there is constant
change, shifting balances and, evolution. ‘Dynamic’ in the sense that little
is steady or stationary, but ‘equilibrium’ in that the vibrant, chaotic kerfuffle of life, economics and society must
organize its affairs within
the parent-company boundaries of available biocapacity.
In his parting address from the World Bank, where he worked for six years,
Daly left his colleagues with a formula for sustainability:
-
stop counting
the consumption of natural capital as income
-
tax labour and income less,
and resource extraction
-
maximize the productivity of natural capital
in the short run and invest in increasing its supply in the long run
-
most contentiously, abandon the ideology
of global economic integration through free trade, free capital
mobility, and export-led growth
nef’s report, The Great Transition, explores how best to organize an economy
that exists in a state of dynamic equilibrium with the biosphere.
That and
other research underway seeks to address all the usual questions such as
ensuring livelihoods, security in youth and old age, maximizing well-being
and social justice.
The point of this report has been simply to establish
the case, as far as possible beyond question, that such an economy is
needed.
The challenge: How to create good lives and flourishing societies that do
not rely on infinite orthodox growth
This report set out to examine the physical and environmental constraints to
unlimited global economic growth as measured by GDP.
Taking climate change
and fossil fuel use as a particular focus, we find that these constraints at
the global level are real and immediate. This means, that in order to allow
economic growth in low per capita income countries where, for example,
rising income has a strong relationship to greater life expectancy, there
will need to be less growth in those high-income countries where the
relationship to increasing life expectancy and satisfaction has already
broken down.
It is not the purpose of this report to explore in detail what the latter
might look like in practice. This is the focus of a large amount of work by
nef that is unnecessary for us to duplicate.
We refer the reader, for
example, to the book produced by nef and the Open University, titled Do
Good Lives Have to Cost the Earth?, and to recent nef reports including:
-
The Happy Planet 2.0 (2009), which provides a new compass to set society
on the path to real progress by measuring what matters to people - living a
long and happy life - and what matters to the planet - our rate of resource
consumption.
-
The National Accounts of Well-Being (2009), proposes nations should
directly measure people’s well-being in a regular and thorough way, and that
policy is shaped to ensure high, equitable and sustainable well-being.
-
The Great Transition (2009), which is a bold and broad plan for the UK
that demonstrates how, even with declining GDP, it is possible to see rises
in both social and environmental value. The plan envisages a pathway of
rapid decarbonisation for the economy and significant increases in equality
in society.
It is possible, though, to say something briefly here about why the things
that lock economies like the UK into GDP growth are not immutable. In Box 1
at the beginning of the report we summarized those reasons as being mainly
threefold.
First, governments plan their expenditure assuming that the economy will
keep growing. If it then didn’t, there would be shortfalls in government
income with repercussions for public spending. Secondly, listed companies
are legally obliged to maximize returns to shareholders, and investors
generally take their money wherever the highest rates of return and growth
are found. Thirdly, nearly all money is lent into existence bearing
interest. For every pound lent, more must be repaid, demanding growth.
Encouragingly, however, none of these three conditions is a given,
unchangeable ‘state of nature’.
Economic rules and habits are not like the
laws of physics. Today’s fiduciary duties on company management are not on a
par with the force of gravity. These things are the result of cultural and
political choices, which can, if necessary, be changed in the light of
necessary and urgent circumstances.
In terms of government spending on essential services, governments have more
room for maneuver than they like to admit. When the financial crisis hit,
in the UK alone over £1 trillion was found to support the banks, apparently
from nowhere. It can be done.
Through so-called ‘quantitative easing’ money
really was conjured from thin air (the dirty little secret of banking is
that this is practically what happens all the time when people borrow, for
example, to buy a house).
Governments can also change priorities, spending less on unproductive
military expenditure and more on schools, hospitals and support for those
who need care. New techniques employing greater reciprocity with the users
of public services can also radically reduce the upfront cash-cost of
services by making them more effective (through so-called ‘co-production’).
There’s also no reason why fairer taxation and greater redistribution,
coupled with better services cannot provide security for all in old age,
removing the insecurity that makes us all worry about having a private
pension with a high interest rate.
Herman Daly makes the point that in a non-growing, steady state (or dynamic
equilibrium) economy it might actually be easier to approach full
employment. With lower levels of material throughput and lower levels of
fossil fuel energy use, the proportion of human energy input (labour) is
likely to increase. Generations of having people made redundant by machines
largely powered by coal, oil and gas could be reversed.
He writes:
‘There
are several reasons for believing that full employment will be easier to
attain in a SSE [steady state economy] than in our failing growth economies…
the policy of limiting the matter-energy throughput would raise the price of
energy and resources relative to the price of labour. This would lead to the
substitution of labor for energy in production processes and consumption
patterns, thus reversing the historical trend of replacing labour with
machines and inanimate energy, whose relative prices have been
declining.’413
Such a new economy implies the need for a great ‘re-skilling’, for example in
the food economy, and the growth of urban agriculture.
Other adaptations
could bring a range of social, environmental, and economic benefits. A
redistribution of paid employment via a shorter working week, tackling the
twin problems of overwork and unemployment, would free up time for people to
do more things for themselves, each other and the community, and reduce
their dependence on paid-for services.
At the corporate level, there are many other forms of governance that could
reduce or remove the pressure to service shareholders who have a one-eyed
obsession with maximum growth and returns.
Cooperatives, mutuals, publicly
owned companies and social enterprises all have broader or simply different
objectives.
Finally, when it comes to monetary systems, there is a whole world of
alternatives, and a long history of innovation, some of it explored in the
Green New Deal, published by nef in 2008, and widely written about in the
works of people like Bernard Lietaer, David Boyle, Ann Pettifor and James
Robertson.414
There are different forms of exchange, such as Time Banks,415
and different kinds of local and regional currencies, each with their own
characteristics. Not all money need be interest bearing.
Low- or no-cost
credit can be created by Central Banks for the purpose of achieving
particular tasks - such as building new infrastructures for energy,
transport, farming and buildings - for the environmental transformation of
the economy. Such money can have special conditions attached to prevent it
becoming inflationary.
Unending global economic growth, it would seem therefore is not possible,
but also neither desirable nor necessary. If you have any doubts, ask a
hamster.
Back to Contents
Video
What the impossible hamster has to teach us about economic growth. A new
animation from nef (the new economics foundation), scripted by Andrew Simms,
numbers crunched by Viki Johnson and pictures realized by Leo Murray.
We wanted to confront people with the meaning
and logical conclusion of the promise of endless economic growth.
We used a hamster to illustrate what would
happen if there were no limits to growth because they double in size each
week before reaching maturity at around 6 weeks. But if a hamster grew at
the same rate until its first birthday, wed be looking at a nine billion
tonne hamster, which ate more than a years worth of world maize production
every day.
There are reasons in nature, why things don't
grow indefinitely. As things are in nature, sooner or later, so they must be
in the economy. As economic growth rises, we are pushing the planet ever
closer to, and beyond some very real environmental limits.
With every doubling in the global economy we use
the equivalent in resources of all of the previous doublings combined.
The Impossible Hamster
by
onehundredmonths
January 24, 2010
from
YouTube Website
Back to Contents