|

from
WWatching Website
|
The story of the
development of navigation and map making as it is
commonly understood goes something like this. |
 The
earliest maps that we know of were made on clay tablets and come
from the ancient Babylonians around 2300 BC. These
maps were of land lots and were used to control taxation. There are
maps made on silk from China around the 2nd
century BC. The Mayans and Incas made
maps of the territories they conquered. In the early 1300's
navigators developed maps of the Mediterranean and other known
coastlines. Finally in modern times we have perfected the art of map
making and navigation. The
earliest maps that we know of were made on clay tablets and come
from the ancient Babylonians around 2300 BC. These
maps were of land lots and were used to control taxation. There are
maps made on silk from China around the 2nd
century BC. The Mayans and Incas made
maps of the territories they conquered. In the early 1300's
navigators developed maps of the Mediterranean and other known
coastlines. Finally in modern times we have perfected the art of map
making and navigation.
"Only since the late 1700's has it
been possible to collect & record truly accurate geographic
information"
[Encarta Encyclopedia : Geography &
Maps, History of]
The following maps are very much ancient
enigmas because they simply do not fit in our current model of
history.
Piri Re'is Map of 1513
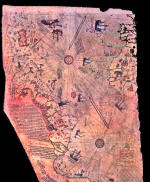 There
is a map, dating from 1513, which was made by a man named Piri
Ibn Haji Memmed, otherwise known as Piri Re'is. This man
was an Admiral in the Turkish navy. Today we only have a fragment of
the original map. (click image right) There
is a map, dating from 1513, which was made by a man named Piri
Ibn Haji Memmed, otherwise known as Piri Re'is. This man
was an Admiral in the Turkish navy. Today we only have a fragment of
the original map. (click image right)
Piri Re'is made a number of very interesting claims about
this map:
-
He claimed it was made from
approximately 20 original source maps
-
He claimed the western portion of
the map was obtained from Christopher Columbus
-
He claimed some of the source maps
were dated from the time of Alexander the Great
-
He claimed some of the maps were
based upon mathematics
These are pretty amazing claims. An
initial examination of this map seems to support the idea that the
western portion (the map of the coastline of the Americas) was done
by people with little or no knowledge of what the coastline actually
looked like. The reason for this conclusion is the coastline of the
America's looks very distorted.
This map was drawn using the Equidistant projection method.
Also, instead of using the standard markings of latitude and
longitude that are common on today's maps. Instead maps of the "portolan"
style were drawn using a series of points from which a
series of lines radiate outward. One such mechanism for drawing
these maps was the "Eight Wind" system. Others including the
Sixteen Wind system etc. also were used.
The reasons for such drawing methods have long been assumed to
benefit the mariner. This is because these lines seem to correspond
to the points of the compass, which also began to surface in Europe
around the same time. This method of drawing would also greatly
benefit the map map maker as well.
It is interesting to note that the portolan maps that
surfaced in the AD 1300's did so without any evidence of
development. Also throughout the next several hundred years they did
not show development either. From fourteenth through the sixteenth
century AD there is no material modifications to these maps. Further
they are all drawn from the same scale. This suggests that the maps
were not being developed as a result of mariner survey activity.
Also the lack of variance in scale may suggest that the
understanding of these maps, and the mathematical principles behind
them, was not understood.
Charles Hapgood performed a detailed analysis of this map. He
worked with students from Keene State College, as well as
with cartographers from the US Air Force. After a detailed
analysis, several interesting observations were made.
-
The map appears is composed of at
least six separate source maps.
-
The map provided remarkably accurate
latitude and longitude locations of coastal features of Africa,
North and South America, and a portion of Antarctica.
(This point is contested by many people and is addressed later
in the section on Antarctica).
-
The source maps themselves utilize
the principles of plane geometry and an ability to account for
the curvature of the earths surface.
-
The knowledge of longitude suggests
either a people, or a mechanism, that are currently unknown to
us. (This is because the ability to determine longitude with any
degree of accuracy is not known before AD 1700 (?) ).
-
The map is based on an equidistant
projection with its center on the meridian of Alexandria
in Egypt.
 Mr.
Hapgood presented a number of exhibits in his book,
The Maps of the Ancient Sea Kings
to support these claims. He also presented a plethora of empirical
evidence to back up these points. Click image
left to see a large map from
that book indicating the location six maps, the features that have
been verified with modern geography, etc. Although the accurate
mapping of the coastline of the Americas is amazing examine the
portion of Antarctica that is also illustrated. Mr.
Hapgood presented a number of exhibits in his book,
The Maps of the Ancient Sea Kings
to support these claims. He also presented a plethora of empirical
evidence to back up these points. Click image
left to see a large map from
that book indicating the location six maps, the features that have
been verified with modern geography, etc. Although the accurate
mapping of the coastline of the Americas is amazing examine the
portion of Antarctica that is also illustrated.
NOTE: There is
significant debate about whether or not this is actually
Antarctica. Mr. Hapgood himself comments that if this was
the only evidence we had that the ancients had mapped Antarctica it
would be questionable. Examine the later section on Antarctica
for much more credible maps of it.
To understand the method of projection examine the following map.
This is a section of an equidistant projection centered on
Memphis Egypt. This map was produced by the US Air Force. Note
the similar distortion of the coastline of the Americas between
Piri and this map.
This map shows the super-imposition of
the portolan type projection on the equidistant
projection. Note that the numbers on the outside of the largest
circle correspond with projection points on the map of Piri
Re'is.
The degree of accuracy contained in
the Piri Re'is map is extraordinary. Given that the
author of this map himself claimed to have based this map, not on
his own surveying skills, but rather on ancient maps going back to
the 1400's and earlier, serious questions about the development of
navigation as we currently understand it.
Go Back
The Maps of Antarctica
Officially Antarctica was discovered in the early
1800's. Its existence is said to have been theorized by the ancient
Greeks who realizing the amount of land in the northern hemisphere
assumed that this mass must be balanced by a proportionate mass in
the southern hemisphere.
Also, the continent of Antarctica, according to modern
science, has been covered with ice for millions (sic) of years. This
would make it impossible for anyone, especially the ancients to
actually map its coastline.
Unfortunately for some there are maps, dating from at least the
early 1500's that not only indicate the existence of
Antarctica, but also map its coastline in amazing detail.
One such map is the Oronteus Finaeus World Map of
1532. The section of this map indicting Antarctica is
shown below (click image to enlarge).
Keep in mind that this projection method is different than those
that you are used to seeing today.
Charles Hapgood and his team
converted this map from its current projection method into a modern
projection method. Look at the results.
Click images to
enlarge
|
This first
image is simply the map as it was drawn by Oronteus
Finaeus
. |
Next they
converted it to a modern projection method as shown here
. |
Compare the
left image with a modern map of Antarctica to see at a
glance just how close they were |
Well if the existence was only
theorized, the people developing these theories were also able to
theorize the coastal features of this theoretical continent.
The problems posed by these maps of Antarctica are not
trivial.
-
First of all it demonstrates
that sometime in the history of the earth, before at least
the 1500's a sea faring people existed that could
circumnavigate the globe and accurately survey its
features.
-
Second it raises the question
of, if the ice cap has been in place for millions years how
was this accomplished?
-
Did the maps originate
prior to this time?
-
Was it mapped while the ice caps
were in place?
-
Is the ice cap development
actually a much more recent event than we think?
There are several other maps of
Antarctica that could be presented here. These are covered
in Mr. Charles Hapgood's book Maps of the Ancient Sea
Kings (see excerpts
HERE).
Go Back
|