|
from
Spectator Website
Detail from Peasants before an Inn, Jan Steen, The Mauritshuis Royal Picture Gallery, The Hague.
So, our new technical paper (The Application of Machine Learning for Evaluating Anthropogenic versus Natural Climate Change) in GeoResJ will likely be ignored.
Because after applying the latest big data technique to six 2,000 year-long proxy-temperature series we cannot confirm that recent warming is anything but natural - what might have occurred anyway, even if there was no industrial revolution.
Over the last few years, I've worked with Dr John Abbot using artificial neural networks (ANN) to forecast monthly rainfall.
We now have a bunch of papers in international climate science journals showing these forecasts to be more skilful than output from general circulation models.
During the past year, we've extended this work to estimating what global temperatures would have been during the twentieth century in the absence of human-emission of carbon dioxide.
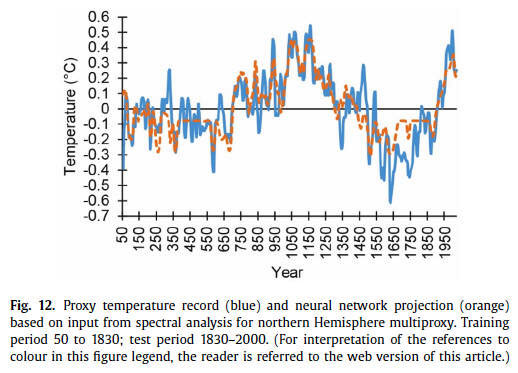
We began by deconstructing the six-proxy series from different geographic regions - series already published in the mainstream climate science literature. One of these, the Northern Hemisphere composite series begins in 50 AD, ends in the year 2000, and is derived from studies of,
Typical of most such temperature series, it zigzags up and down while showing two rising trends:
In between, is the Little Ice Age (LIA), which according to the Northern Hemisphere composite bottomed-out in 1650 AD.
(Of course, the MWP corresponded with a period of generally good harvests in England - when men dressed in tunics and built grand cathedrals with tall spires. It preceded the LIA when there was famine and the Great Plague of London.)
Ignoring for the moment the MWP and LIA, you might want to simply dismiss this temperature series on the basis it peaks in 1980:
In fact, this decline is typical of most such proxy reconstructions - derived from pollen, stalagmites, boreholes, coral cores and especially tree rings.
Within mainstream climate science the decline after 1980 is referred to as "the divergence problem", and then hidden.
In denial of this problem, leading climate scientists have been known to even graft temperature measurements from thermometers onto the proxy record after 1980 to literally 'hide the decline'.
Phil Jones, the head of the Climate Research Unit, University of East Anglia, aptly described the technique as a 'trick'.
Grafting thermometer data onto the end of the proxy record generally 'fixes' the problem after 1980, while remodeling effectively flattens the Medieval Warm Period.
There are, however, multiple lines of evidence indicating it was about a degree warmer across Europe during the MWP - corresponding with the 1200 AD rise in our Northern Hemisphere composite.
In fact, there are oodles of published technical papers based on proxy records that provide a relatively warm temperature profile for this period. This was before the Little Ice Age when it was too cold to inhabit Greenland.
The modern inhabitation of Upernavik, in north west Greenland, only began in 1826, which corresponds with the beginning of the industrial age. So, the end of the Little Ice Age corresponds with the beginning of industrialization.
But did industrialization cause the global warming? Tolstoy's 'intelligent man' would immediately reply: But yes...!
In our new paper in GeoResJ, we make the assumption that an artificial neural network - remember our big data/machine learning technique - trained on proxy temperatures up until 1830, would be able to forecast the combined effect of natural climate cycles through the twentieth century.
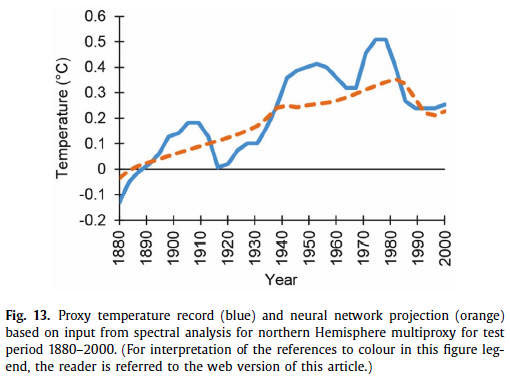
Using the proxy record from the Northern Hemisphere composite, decomposing this through signal analysis and then using the resulting component sine waves as input into an ANN, John Abbot and I generated forecasts for the period from 1830 to 2000.
Our results show up to 1°C of warming. The average divergence between the proxy temperature record and our ANN projection is just 0.09 degree Celsius.
This suggests that even if there had been no industrial revolution and burning of fossil fuels, there would have still been warming through the twentieth century - to at least 1980, and of almost 1°C.
The Intergovernmental Panel on Climate Change (IPCC), relying on General Circulation Models, and giving us the Paris Accord, also estimates warming of approximately 1°C, but claims this is all 'our' fault (human caused...)
For more information, read Jennifer Marohasy's below article...
August 21, 2017 from JenniferMarohasy Website
The results from this
novel technique, just published in GeoResJ, [1] accord
with climate sensitivity estimates from experimental spectroscopy
but are at odds with output from General Circulation Models.
It's not disputed that
carbon dioxide absorbs infrared radiation, what is uncertain is the
sensitivity of the climate to increasing atmospheric concentrations.
We just don't know; in part because
the key experiments have never been undertaken. [3]
And we now have a bunch of papers in
international climate science journals on the application of this
technique showing its more skilful than the Australian
Bureau of Meteorology's General Circulation Models
for forecasting monthly rainfall.
These records are based on things like tree rings and coral cores which can provide an indirect measure of past temperatures.
Most of these records show cycles of
warming and cooling that fluctuated within a band of approximately
2°C.
Indeed, there are oodles
of published technical papers based on proxy records that provide a
relatively warm temperature profile for this period, [7]
corresponding with the building of cathedrals across England, and
before the
Little Ice Age
when it was too cold for
the inhabitation of Greenland.
I date the end of the
Little Ice Age as 1826, when
Upernavik
in northwest Greenland
was again inhabitable - after a period of 592 years.
For example, it was on 15
September 1830 that the first coal-fired train arrived in Liverpool
from Manchester: which some claim as the beginning of the modern era
of fast, long-distant, fossil-fuelled fired transport for the
masses.
Typical of most such proxy temperature series, when charted this series zigzags up and down within a band of perhaps 0.4°C on a short time scale of perhaps 60-years.
Over the longer nearly 2,000-year period of the record, it shows a rising trend which peaks in 1200AD before trending down to 1650AD, and then rising to about 1980 - then dipping to the year 2000:
The ANN was trained for the period 50 to 1830; test period was 1830
to 2000.
To be clear, while the thermometer and satellite-based temperature records generally show a temperature increase through the twentieth century, the proxy record, which is used to describe temperature change over the last 2,000 years - a period that predates thermometers and satellites - generally dips from 1980, at least for Northern Hemisphere locations, as shown in Figure 12 above.
This is particularly the case with tree ring records.
Rather than address this
issue, key climate scientists, have been known to graft instrumental
temperature series onto the proxy record from 1980 to literally
'hide the decline'. [8]
Both the proxy record and
also our ANN forecast (trained on data the predates the Industrial
Revolution) show a general increase in temperatures to 1980, and
then a decline.
This suggests that even
if there had been no industrial revolution and burning of fossil
fuels, there would have still been some warming through the
twentieth century - to at least 1980.
The difference between output from the ANN models and the proxy records is at most 0.2°C; this was the situation for the studies from Switzerland and New Zealand.
So, we suggest that at most, the
contribution of industrialization to warming over the twentieth
century would be in the order of 0.2°C.
For example, the last IPCC Assessment report concluded that,
If we go back 1,400 years, we have a period in Europe immediately following the fall of the Roman empire, and predating the MWP.
So, clearly the IPCC
denies that the MWP was as warm as current temperatures.
To be clear, while mainstream climate science is replete with published proxy temperature studies showing that temperatures have cycled up and down over the last 2,000 years - spiking during the Medieval Warm Period and then again recently to about 1980 as shown in Figure 12 far above - the official IPCC reconstructions (which underpin the Paris Accord) deny such cycles.
Through this denial, leaders from within this 'much-revered' community can claim that there is something unusual about current temperatures:
In our new paper in GeoResJ, we not only use the latest techniques in big data to show that there would very likely have been significant warming to at least 1980 in the absence of industrialization, we also calculate an Equilibrium Climate Sensitivity (ECS) of 0.6°C.
This is the temperature increase expected from a doubling of carbon dioxide concentrations in the atmosphere.
This is an order of
magnitude less than estimates from
General Circulation Models, but
in accordance from values generated from experimental spectroscopic
studies, and other approaches reported in the scientific literature.
[9,10,11,12,13,14]
In reality, some of the
data is 'problematic', the underlying physical mechanisms are
complex and poorly understood, the literature voluminous, and new
alternative techniques (such as our method using ANNs) can give very
different answers to those derived from
General Circulation Models
and
remodeled proxy-temperature series.
|