|

by Evelyn Browning-Garriss
June 2013
from
BrowningNewsletter Website
Three factors,
-
volcanic debris
-
more variable polar jet streams
-
increased human habitation in
high-risk areas,
...are creating extreme weather and high
insurance payouts. Some of these are temporary while other factors
will last for decades.
It's May, time to publish the economic impact summaries of last
years weather. They are not pleasant reading.
In the United States, there were 3,527 monthly weather records
broken for heat, rain, and snow in the US. That’s even more than the
3,251 records smashed in 2011; some of the newly broken records had
stood for 30 years or more.
According to the National Climatic
Data Center (NCDC), every state in the union saw record-breaking
extreme events. The nation saw the hottest March on record in the
contiguous US, and July was the hottest single month ever recorded
in those lower 48 states.
In particular, the US had:
-
The worst drought in 50 years
across the nation’s grain belt, with over 1,300 US counties
in 29 states declared drought disaster areas.
-
Wildfires burned more than 9.2
million acres in the US, and destroyed hundreds of homes.
The average size of the fires set an all-time record of 165
acres per fire, exceeding the prior decade’s 2001-2010
average of approximately 90 acres/fire.
-
Hurricane Sandy’s storm surge
height (13.88 feet) broke the all-time record in New York
Harbor, and ravaged communities across New Jersey and New
York with floodwaters and winds. The cost of Hurricane Sandy
reached an estimated $79 billion for federal aid to cover
damages, recovery and measures to cope with future storms in
New York and New Jersey. However, that price tag doesn’t
include health-related impacts.
Overall, U.S. taxpayers paid nearly $100
billion responding to damage caused by last year’s extreme weather
events associated with climate change, about $1,100 per taxpayer,
according to an analysis by the Natural Resources Defense Council
(NRDC).
The analysis shows taxpayers spent,
through the federal government, nearly $100 billion on climate
change cleanup more than on either education or transportation.
This is part of a long-term trend. Recently, international insurance
giant MunichRe concluded that from 1980 through 2011, the frequency
of weather-related extreme events in North America nearly
quintupled, rising more rapidly than anywhere else in the world.
The insurance industry estimates that
2012 was the second most expensive in U.S. history for
climate-related disasters, with damages totaling more than $139
billion.
The burden of paying for the damage created by these weather events
has shifted away from private insurers and is falling more heavily
on America’s taxpayers. Over the past five years, taxpayers spent
three times more than private insurers to pay for recovery from
climate damages.
According to Dan Lashof, the
NRDC’s Climate and Clean Air Program,
“This singleticket expense now tops
the list of non-defense discretionary federal spending”.
The US had 90% of the global disaster
costs of 2012.
fig. 10, above - fig.
11, below
Source, two graphics: Michelle Yonetani et. al.
Global Estimates
2012: People displaced by disasters, Internal
Displacement Monitoring Centre and Norwegian Refugee Council, May
2013
However, there was enough devastation to
go around.
The world experienced 900 major
disasters in 2012, compared to the average annual number of 800
disasters worldwide since 1980. The weather forced 32.4 million
people to leave their homes, with the majority displaced by flooding
from monsoons and typhoons in Asia.
Over half of the displaced millions were
in,
-
India
-
Nigeria
-
China
-
the Philippines
At that, the cost of global natural and
man-made disasters in 2012 is actually significantly lower than last
year’s total.
According to a report released by
reinsurer Swiss Re, total economic losses from disasters - naturally
occurring or otherwise - is estimated to be at least $140 billion.
The total financial loss from disasters
did not near 2011s total of $380 billion - the highest in history -
or 2010’s $218 billion.
Why are the costs of disaster rising so
much?
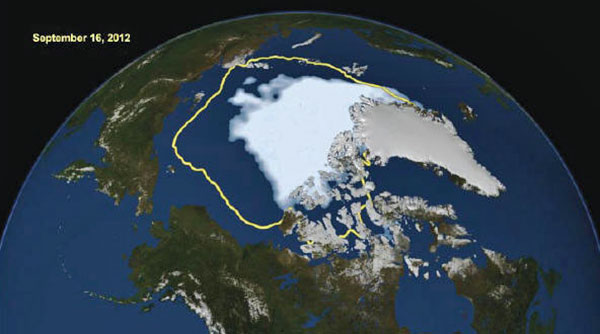
fig. 12
In 2012, the
Arctic Sea ice was only 51 % of the size
that was normal
between 1979 - 2000
http://www.nasa.gov/fop;cs/earfh/feafures/2072-sea/cem/n.hfm/
Why are we seeing more extreme events?
The answer seems to lie in three
factors:
1. VOLCANIC ERUPTIONS (3 - 7 year duration)
As noted in the first article, large
volcano eruptions temporarily alter climate.
If the eruption pours ash and
chemicals into the stratosphere, it takes two to seven years to
precipitate out. For those two to seven years, the aerosols and
the clouds they create block out incoming sunlight. The
atmosphere below cools. It holds less moisture. Air pressure is
changed and this in turn alters the strength and direction
ofwinds.
Since 2006, we have seen increased volatility in both Alaska and
Russia’s Kamchatka peninsula and in the North Pacific. For seven
years, large eruptions distorted normal airflow, altering the
Arctic Oscillation from decades-long patterns.
These distortions have been felt
throughout the Northern Hemisphere but have had their greatest
impact on North America, which is directly downwind from the
eruptions. Two extremely cold winters and volatile springs
followed the giant 2009 eruption of Alaska’s Mt. Redoubt.
The 2011 eruptions of Iceland’s
Grimsvotn and Russia’s Sheveluch produced the last two bizarre
winters and springs. (Snow on Memorial Day!)
fig. 13 -
below left
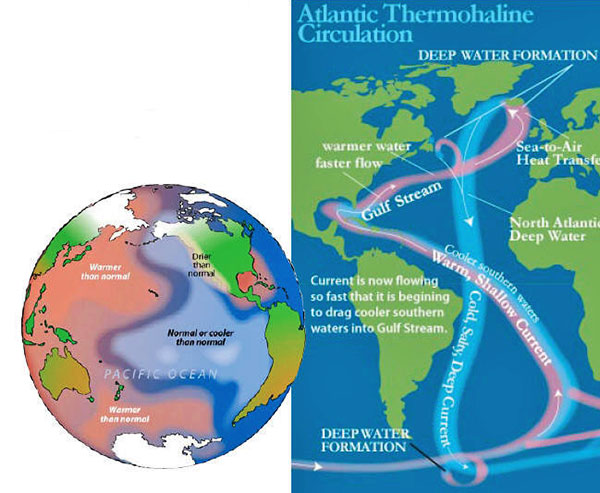
The Negative PDO.

fig. 14 - above right
The fast- moving
Gulf Stream brings tropical water to temperate zones.
2. EXTREME ARCTIC SEA ICE MELT AND ITS
EFFECT ON THE JET STREAM (long-term impact)
Scientists have been reporting the
dramatic reduction of the Arctic sea ice for more than a decade.
Last year, the sea ice dropped to a new low record, 1.27 million
square miles (3.29 million square kilometers) or 49% below the
1979 to 2000 average minimum. (Satellite measuring of the ice
pack began in 1979.)
This ice loss is the equivalent in
size to Europe minus Scandinavia and Russia or 45% of the
contiguous US. Now scientists are correlating this dramatic
change in the Arctic with the volatility of the polar jet
stream.
There are several reasons for this
dramatic reduction of Arctic sea ice.
Most of us have read about the
impact of man-made greenhouse gasses and the studies to
determine how much they are contributing to this trend. At the
same time two natural factors, both long term, are warming the
Arctic.
The Atlantic is in the middle of the
warm phase of a 70-year-long Atlantic Multi-decadal Oscillation.
In this, the oceans tropical currents are flowing very rapidly
and warming northern waters.
Similarly, in the Pacific, the
Pacific Decadal Oscillation has entered the negative phase,
which creates cooler conditions in the tropics and steers warmer
water toward the poles. Both oceans are pouring warmer waters
into the Arctic basin. History shows that this trend should
continue for at least another 20 years.
Dr. Jennifer Francis, professor of Atmospheric Science at
Rutgers University has explained how this affects the jet stream
in,
“Evidence linking Arctic
amplification to extreme weather in mid-latitudes,”
published in Geophysical Research Letters, on 21 February,
2012.
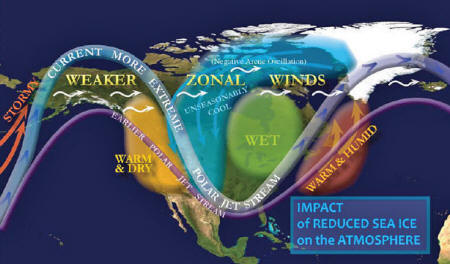
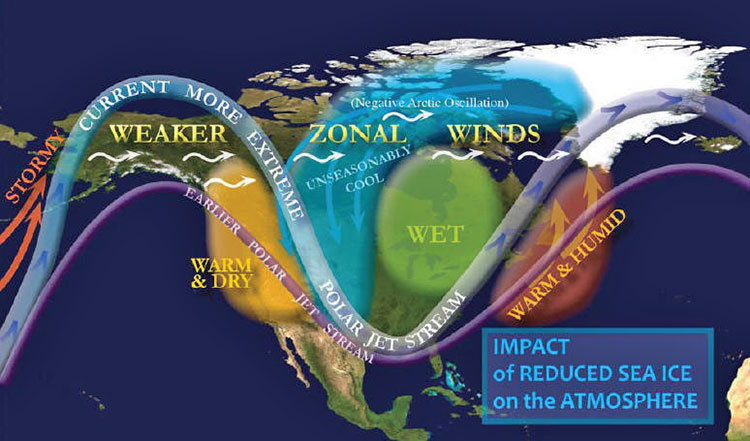
fig. 15
Evelyn Browning
Garriss
Arctic ice reflects sunlight while
open waters absorb the heat. As fall comes, the stored ocean
heat is released into the atmosphere, heating the autumn air by
2-5° and altering air pressure.
This alters upper air circulation
by:
-
SLOWING ARCTIC WINDS - The
flow of the circumpolar winds that circle the Arctic and
trap the cold in the north are slower and weaker. More
of the frigid polar air escapes south.
-
INCREASING TENDENCY TO MAKE
CONTORTED HIGH-AM- pLITuDE LOOpS. The jet stream
fluctuates as it circles the Arctic, dipping south and
arching north. What Francis shows is that in years when
the Arctic ice is severely reduced, the size of these
north south loops increases.
The polar jet stream soars further
north and plunges further south. Dr. Francis’s work concentrates
in North America and shows that we are seeing the jet stream
fluctuating at its most extreme along the East and West Coast.
Both of these changes slow weather patterns. Weaker zonal winds
mean they don’t push weather fronts as hard and fast. Instead of
zipping from the west to east, the weather patterns linger in
one place, prolonging the heat wave or cold spell. Storm fronts
linger, dropping heavy precipitation and creating blizzards or
floods.
Similarly, the giant dips in the jet
stream (called Rossby waves) move much slower than shallow dips.
The cold air or heat waves stall. This creates more extreme
weather - hotter, drier summer heat-waves or prolonged winter
and springtime chills and storms.
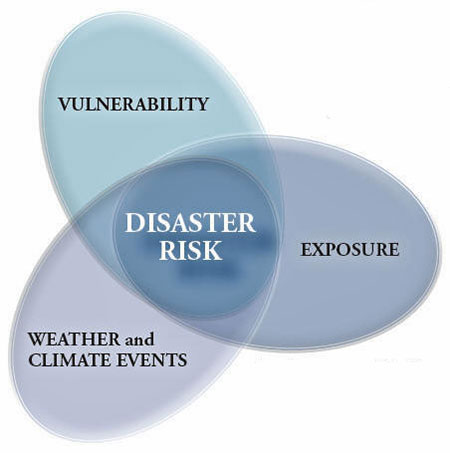
fig. 16 source:
http:/ipcc-wg2.gov/SREX/images/uploads/SREX-SPMbrochure_FINAL.pdf
Unfortunately, the melting Arctic ice pack is at least partially
caused by Atlantic and Pacific Ocean patterns that will last
another 20 years. This means the extreme weather patterns caused
by slowing air circulation should last another couple of
decades.
3. THE HUMAN FACTOR
The third factor that is causing an
increase of extreme and expensive weather events is the human
factor. People are living in high-risk areas. Frequently it is
the poorest and most vulnerable members of society in these
areas and this can cause severe weather events to become deadly.
Let me give an example: In 1995, the
Atlantic Multidecadal Oscillation switched to its warm phase,
which according to NOAA research roughly doubles the numbers of
Atlantic hurricanes.
In 1996, one of my clients called
and complained. He had built a new beachside home and three
hurricanes had brushed near it that year.
All I could reply was,
“Why do you think it’s called
Cape Fear? Why do you think the Native Americans never lived
there?”
During the cool, more benign phase
of the AMO, the Atlantic had been relatively quiet and millions
of Americans had moved to beautiful coastal regions.
By the mid-Nineties, half of the US
population lived within 50 miles of a coastline. When the AMO
once again turned warm, this left billions of dollars of US
property in high-risk areas. The US has since increased its
exposure.
This is not unique to the USA. China’s two major exporting
cities, Hong Kong and Shanghai are near the Pacific coast and
were brushed by typhoons last year. India’s economic powerhouse
city of Mumbai is also coastal and as the India Ocean increases
in heat, the city has been flooded repeatedly.
According to the UN’s 2012 IPCC report,
a disaster risk combines not just weather and climate events but
also exposure and vulnerability.
-
EXPOSURE
With the shift in the AMO in
1995, Atlantic Rim precipitation patterns have shifted.
Coastal and flood plain regions in the Americas, Europe and
West Africa are facing increased exposure to floods,
heat-waves and, particularly in North Africa and the US
interior, drought.
Since the shift in the Pacific
Decadal Oscillation in 2006, low-lying regions of Asia and
Australia face greater exposure of storms and floods while
most of the western Americas face increased risk of drought.
-
VULNERABILITY
To the extent that societies do
not adjust to the new climate shifts, they are increasing
their vulnerability. Building codes that reflect the past 30
years, rather than the past decade do not provide adequate
protection from the new strains on infrastructure.
As urbanization increases, with
hundreds of millions of people moving into ramshackle urban
slums, the vulnerability of societies and economies
increases.
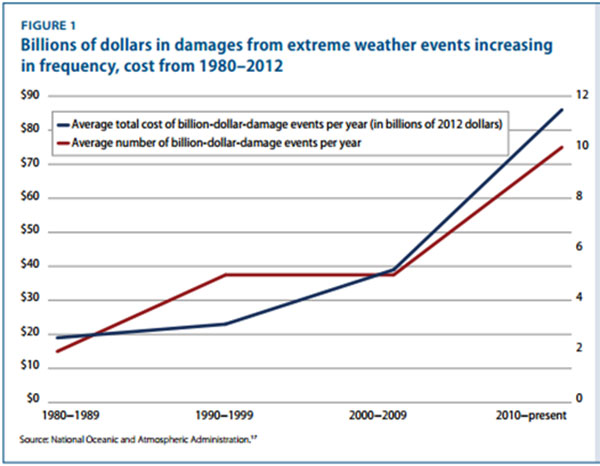
Conclusions
-
The payouts for disaster related
events and the number of billion dollar damage events is
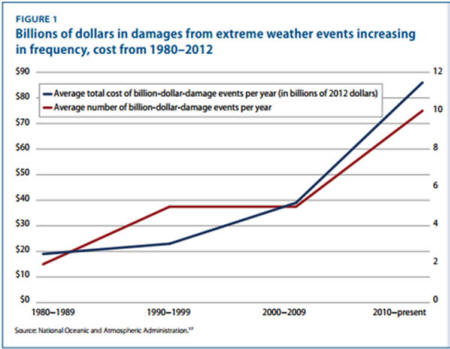
increasing and has increased dramatically since 2009.
-
Overall, global weather has not
necessarily become more extreme. The scientific community is
debating the issue. However, statistics do show that the
weather is becoming more extreme in the middle latitudes of
the Northern Hemisphere.
-
The trend for the increase of
extreme weather in the Northern Hemisphere due to volcanic
distortion of polar weather will fade out in another couple
of years, unless we have more large eruptions. The trend for
more extreme weather due to the prolonged impact of storms
or droughts has another 20 years or more to run.
-
Because of the shifts in the
Atlantic and Pacific long-term oscillations, new areas are
exposed to extreme weather. This increases their
vulnerability and their risk of disasters.
|