|

by Jonathan Fildes
Science and technology
reporter, BBC News, San Francisco
from
BBCNews Website
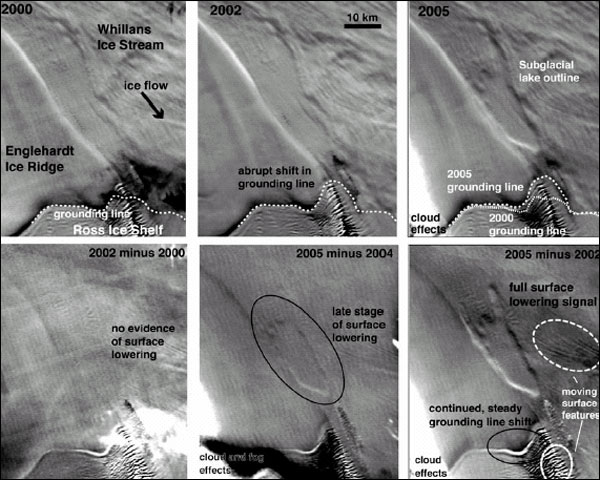
Satellite images reveal the changes
in volume of water
Scientists "stacked"
multiple images of on top of each other and then
subtracted some to
show up changes in the surface slope in different years.
The appearance of a
footprint-shaped depression
clearly reveals the
changes in the volume of water under the ice.
Giant "blisters" containing water that
rapidly expand and contract have been mapped beneath the Antarctic
ice sheet. Fed by a complex network of rivers, the subglacial
reservoirs force the overlying ice to rise and fall. By tracking
these changes with NASA's Ice Cloud and land Elevation Satellite (ICESat)
scientists were able to map the extent of the subglacial plumbing.
The results, published in the journal Science, show that some areas
fell by up to 9m (30ft) over just two years.
"We didn't realize that the water
under these ice streams was moving in such large quantities, and
on such short time scales," said Dr Helen Fricker of the Scripps
Institution of Oceanography, University of California, and one
of the authors of the paper.
"We thought these changes took place over years and decades, but
we are seeing large changes over months."
The results are important for
understanding how the Antarctic Ice sheet, which contains nearly 90%
of the world's ice, may respond to global warming and how much it
may contribute to sea level rise.
Climate response
Nearly 150 subglacial lakes have been identified beneath the vast
Antarctic ice sheet. The new ones were found under the fast-flowing Whillans and Mercer Ice Streams that carry ice from the interior of
the West Antarctic Ice Sheet to the floating Ross Ice Shelf.
These streams of ice move many meters every day and are of
particular interest to climate scientists.
"It's the fast-moving ice that
determines how the ice sheet responds to climate change on a
short timescale," said Professor Robert Bindschadler of NASA's
Goddard Space Flight Center in Maryland, and one of the
researchers on the study.
As atmospheric temperatures rise,
melting the ice shelves, their ability to hold back the ice streams
on land would be reduced.
"We aren't yet able to predict what
these ice streams are going to do."
However, understanding how much water
flows beneath the ice is critical because it is one of the factors
that determine how fast they flow. More water could speed up the
flow of ice into the sea, raising sea levels.
"It's essentially the grease on the
wheel," said Professor Bindschadler.
Ebb and flow
Using elevation data from NASA's ICESat, cross-checked with other
NASA satellites, the team was able to map the rise and fall of the
overlying ice, and hence areas where water pooled or flowed away.
Launched in 2003, ICESat can measure changes in elevation as small
as 1.5cm (0.6ins) from its orbit 645km (400 miles) above the Earth.
The study revealed a complex network of ponds and rivers, the
largest of which occurred under the Whillans ice stream and covered
an area of 500 sq km (190 sq miles). It also showed that water was
constantly moving between different reservoirs.
For example, a feature known as Lake Englehardt took just under
three years to empty two cubic kilometers (2 trillion liters) of
water. In the same period, Lake Conway filled with an additional 1.2
cubic kilometers (1.2 trillion liters) of water. Not all of the
water was the same as some escaped to the ocean or was refrozen on
to the base of the glacier.
Observations like these were only possible using the new satellite
technique.
"Until now, we've had just a few
glimpses into what's going on down there," said Professor
Bindschadler. "This is the most complete picture to date what's
going on beneath fast flowing ice."
The findings were presented at the
American Association for the Advancement of Science (AAAS) annual
meeting here in San Francisco, US.
|