|
from ModernHumanVariation Website
Each of us is unique in terms of the combination of tens of thousands of genetically determined characteristics that we possess. However, we clearly have some traits in common with other people. Most of us have readily identifiable male or female sexual characteristics which we share with others of our gender.
Photo of 4 chinese children age 4-6
People who are closely related to each other usually have even greater similarity in appearance because much of their genetic makeup is shared. Unrelated people whose ancestors came from the same part of the world often are generally similar in terms of such body features as skin and hair color, facial characteristics, body shape, and stature.
Not surprisingly, these traits have a strong genetic component as well. However, they can be affected by environmental influences. For instance, skin color often can be darkened, or tanned, seasonally by prolonged exposure to ultraviolet radiation from the sun. Likewise, stature can be affected by nutrition.
When young children do not
receive sufficient calories in their diet, especially protein, their
growth is likely to be stunted - they will not reach their full
genetically programmed height.
In North America, people usually think in terms of Black, White, Asian, Hispanic or Latino, and Indian or Native American. These are all archaic concepts of physical types that have little biological reality.
Academics may use more sophisticated sounding terms for these perceived biological groupings, such as Negroid, Caucasoid or Caucasian, and Mongoloid.
Nevertheless, they are still bad science. However,
they are important to contemporary life in North America because
they reflect culturally defined differences in our society. They are
essentially labels of ethnicity that are used for categorizing and
discriminating.
They continue well outside of the geographic areas in which a "race" is stereotypically supposed to exist. For instance, dark brown skin is usually thought of as the key trait in distinguishing sub-Saharan Africans from people elsewhere in the world.
However, dark brown skin is also found in parts of southern Asia, Australia, New Guinea and on the nearby islands of Melanesia, as well as in much of the Americas.
Map of the world showing the distribution of human skin color in about 1500 A.D. Darker skin colors are found mostly between 20 degrees north and south of the equator
(Data for native populations collected by R. Biasutti prior to
1940.)
in the Southwest Pacific
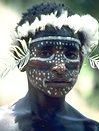
Ocean The non-African peoples with dark brown skin color (like the man in the photo from New Guinea) do not share a close common ancestry with Africans.
Their skin coloration is largely due to natural selection
rather than recent shared descent. The environmental factors that
led to dark brown skin among Africans apparently led to it elsewhere
as well.
Such patterns can result when selective pressures differ from one region to another and when people mate mostly with their immediate neighbors. Selective pressures favoring or discriminating against a trait may come from several sources. There may be natural selection resulting from environmental constraints.
At the same time, there also may be patterns of culturally defined discriminatory mate selection that vary from region to region.
Clinal distribution of hair color among Australian Aborigines Discontinuous distribution of red hair in Britain Sometimes, the distribution of genetically inherited traits does not follow a pattern of gradual change from one geographic region to another but has a discontinuous distribution.
The frequency of red hair in Britain illustrates this sort of pattern. Note in the map on the right above that there are several relatively isolated pockets where there is a high frequency of people with red hair.
Such a
pattern can result when groups of people migrate into a new area or
when there are closed breeding groups that select mates based on
such a trait.
There are three basic ways in which anthropologists have tried to do it in the past.
These models are generally referred to as,
They were using the typological model which has the same basis as the commonly used categories of race today. This approach focuses on a small number of traits that are readily observable from a distance such as skin color, hair form, body build, and stature.
Inherent in the typological model is the notion that there have been "pure" unmixed races in the past. The roots of this model for classifying people go back at least to the 18th century Swedish naturalist, Carolus Linnaeus.
He proposed the existence of four biological varieties or races of humans corresponding to geographic regions:
The typological model is based on what is now known to be a false assumption concerning the nature of human variation - that is, that we can be unambiguously assigned to a "race" on the basis of selected anatomical traits.
In fact, when we look at specific
individuals, we often run into difficulty trying to categorize them.
For example, on the basis of skin color, we might put them into one
"race" and on the basis of nose shape, body form, or blood type,
they might go into others.
For instance, we tend to classify
people as being slender, medium build, or fat despite the fact that
there is a continuum of body weight and size among humans. The same
is true of skin color and other commonly used "racial"
characteristics.
Recent research comparing human DNA sequences
from around the world has shown that 85% of human genetic variation
exists within what we have previously assumed to be more or less
separate "races" and only 15% between them. In other words, "racial"
groups are far from being homogenous.
For example, light skin color is considered to be a defining characteristic of Europeans. However, when you add the criteria of narrow noses, straight hair, and tall stature, many Europeans would be excluded altogether or the European racial category would have to be further subdivided into several smaller "races."
Since the number of "races" can be so easily changed by the way they are defined, it is clear that they do not really exist as distinct biological groupings of people. Instead, they are arbitrary creations that reflect our ethnocentric click this icon to hear the preceding term pronounced views of ourselves and other people.
They are mainly cultural rather
than biological groupings.
This is based
on the idea that the only significant groups, in evolutionary terms,
consist of people whose ancestors have more or less exclusively
mated with each other over long periods of time. Individuals in such
distinct breeding populations would be expected to share many
genetically inherited traits and to have a similar appearance.
Cultural and geographic barriers to intergroup mating have most often broken down over time. Speeding up this process of intermixture of humanity have been the mass intercontinental migrations of the last 500 years. This process is actually accelerating today largely due to relatively inexpensive and easy intercontinental travel. Biological anthropologists have found only a few moderately distinct breeding populations still existing. As a result, the populational model is of little help in understanding most of human variation today.
However, it is of value
in studying the few relatively isolated communities that have
survived.
This model is based on the fact that genetically inherited traits most often change gradually in frequency from one geographic area to another. For instance, the allele for type B blood generally increases from west to east in Europe. We can record different frequency zones, or clines (as shown in the map below).
Unlike the typological and populational models, the clinal model does not result in the definition of distinct groups or races of people.
Map of Europe showing B blood type allele clines The frequencies of B type progressively increase from Western to Eastern Europe In the west they are as low as 0-5% B, while in the east they are as high as 25-30% B
Clinal distribution of the B blood allele in Europe Gradual changes in gene frequency from one region to another are mostly due to the simple fact that the chance of our mating with someone is usually directly related to the distance they live from us.
People whose ancestors have lived close to ours for many generations are more likely to share genetically inherited traits with us than are people who live further away. However, as long distance transportation systems have become more accessible and dependable, the distance from home that we travel and potentially find mates has increased.
Despite this change, most people still
usually end up marrying others who live within a few hundred miles
of their home.
These also can be understood as results of historical migrations or exclusive breeding within more or less closed communities.
For example, the map below shows that the frequency of people who have the B blood allele generally increases from southeast and northeast Asia to central Asia. Within this more or less continuous cline, there are isolated pockets of relatively low B allele frequency.
Therefore, the distribution of this genetically inherited trait appears to be mostly clinal but, in part, it is also discontinuous.
Map of Asia showing B blood type frequencies They are generally higher in Central and Eastern Asia, but there are isolated pockets of low B frequencies in southern China and Siberia
In addition, focusing on new sets of traits often results in assigning people to different races, despite the fact that they were lumped into the same race before.
The patterns of human variation around the world are not only highly complex but also are constantly shifting through time.
Furthermore, the rate of change in the patterns has
been accelerating as our numbers grow and as long distance travel
and migration become more routine.
There is 2-3 times more genetic variation among chimpanzees, 8-10 times more among orangutans, and thousands of times more in many insect species. Most biological anthropologists would agree that human variation is not now sufficient to warrant defining separate biological races, varieties, or sub-species.
However, it very likely was in our
distant prehistoric past.
The
next section of this tutorial presents some of this evidence.
Two teams of geneticists at Stanford University compared the DNA of 938 people from 51 populations in order to better document human diversity and past migrations around the world.
They focused on 650,000 DNA nucleotides to discover differences. This provided what they believe to be clear evidence of human origins in Sub-Saharan Africa and its subsequent dispersion into various parts of the world.
They believe that it is also evidence of more recent
migrations that resulted in genetic differences between populations
today such as North and South Chinese.
(Jakobosson, Mattias et.al.,
Nature February 21, 2007 and Jun, Z. Li et.al., Science February 22,
2007)
It can be easily classified for many different genetically inherited blood typing systems. Also significant is the fact that we rarely take blood types into consideration in selecting mates. In addition, few people know their own type today and no one did a century ago. As a result, differences in blood type frequencies around the world are most likely due to other factors than social discrimination.
Contemporary
Japan is somewhat of an exception since there are popular Japanese
stereotypes about people with different blood types. This could
affect choice in marriage partners for some Japanese.
You inherited your blood types from your parents and the
environment in which you live can not change them.
It is quite clear that the distribution patterns are complex. Both clinal and discontinuous distributions exist, suggesting a complicated evolutionary history for humanity. This can be seen with the global frequency patterns of the type B blood allele (shown in the map below).
Note that it is highest in Central Asia and lowest in the Americas and Australia. However, there are relatively high frequency pockets in Africa as well.
Overall in the world, B is the rarest ABO blood allele. Only 16% of humanity have it.
It was absent in Australia, New Zealand, and most of the New World except for western Alaska It was present throughout the Old World with its highest frequencies in Central and East Asia
The A blood allele is somewhat more common around the world than B. About 21% of all people share the A allele.
The highest frequencies of A are found in small, unrelated populations, especially,
The A allele apparently was absent among Central and South American Indians.
It was absent in Central and South America, but present throughout the rest of the world It was at its highest frequency in Western Europe, Australia, and the sub-arctic regions of North America and Greenland
The O blood type (usually resulting from the absence of both A and B alleles) is very common around the world.
About 63% of humans share it. Type O is particularly high in frequency among the indigenous populations of Central and South America, where it approaches 100%. It also is relatively high among Australian Aborigines and in Western Europe (especially in populations with Celtic ancestors).
The lowest frequency of O is found in Eastern Europe and Central Asia, where B is common.
Most regions were 50% or higher in frequency It was highest in the New World (90-100%) and lowest in Central Asia (50-60%)
However, it is more common in some regions. Native Americans and Australian Aborigines were very likely 100% Rh+ before they began interbreeding with people from other parts of the world. This does not imply that Native Americans and Australian Aborigines are historically closely related to each other. Most African populations are around 75% Rh+.
Europeans have the lowest frequency of this
blood type for any continent. They are 60% Rh+. The lowest known
frequency is found among
the Basques of the Pyrenees Mountains
between France and Spain. They are only 47% Rh+.
This nonrandom distribution pattern fits well with
the hypothesis of an East Asian origin for Native Americans.
The implication is that the specific causes responsible for the distribution of human blood types have been different than those for other traits that have been commonly employed to categorize people into "races."
Since it would be possible to divide up
humanity into radically different groupings using blood typing
instead of other genetically inherited traits such as skin color, we
have more conclusive evidence that the commonly used typological
model for understanding human variation is scientifically unsound.
They cannot be easily summarized or understood. Yet, this hard-earned scientific knowledge is generally ignored in most countries because of more demanding social and political concerns. As a result, discrimination based on presumed "racial" groups still continues. It is important to keep in mind that this "racial" classification often has more to do with cultural and historical distinctions than it does with biology.
In a very real sense, "race" is a distinction that is created by culture not biology.
|