by Dane Wigington


The geoengineers threw everything they had at the Arctic in late July.


The ridiculous cooling anomaly they created (which all the media hyped up) has now totally imploded. The damage done from decades of playing God with the weather can not be undone and will only be made exponentially worse the more they try to hide it with ever increasing geoengineering assaults.


All their manipulation and spraying can create a short term cooling, at the cost of a much worsened situation overall.


Now we see the results, the Arctic ice implosion is in uncharted territory. The melt rate is virtually in “free fall”. It is very likely we will have an “ice free” Arctic this year or next. This will be the first time in at least 3,000,000 years and perhaps as much as 13,000,000 years.


Media is completely ignoring this issue in spite of the extremely dire ramifications for all life on earth. Global geoengineering programs have been ripping the climate system apart for over 60 years, with an all out ramp up of the programs in the last decade and a half.


As the ice goes, the methane hydrate deposits are completely letting loose.


Methane is now acidifying the oceans and saturating the atmosphere. The ozone layer is being decimated, and the toxic fallout from the spraying continues to poison all life on earth day in and day out.


The biosphere is unraveling and the geoengineers are fueling the fire.


Though there are countless sources of damage to the climate system, global geoengineering should be considered the single greatest destructive factor of all.


Its up to all of us to help bring this critical issue to light.


Get up to speed on the facts, arm yourself with credible data, and help us get the word out:


Arctic Sea Ice in Free Fall

by Sam Carana

August 15, 2013

from ArticNews Website  


Arctic Sea Ice has declined dramatically recently.


The recent image below, by the Danish Meteorological Institute, shows the decline in extent over the past few days, with extent calculated by including all areas with ice concentration higher than 30%.


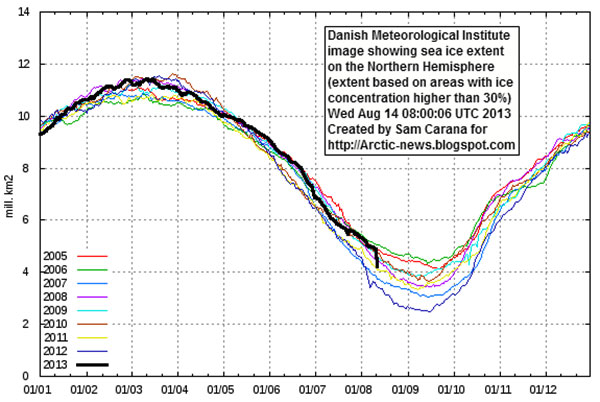
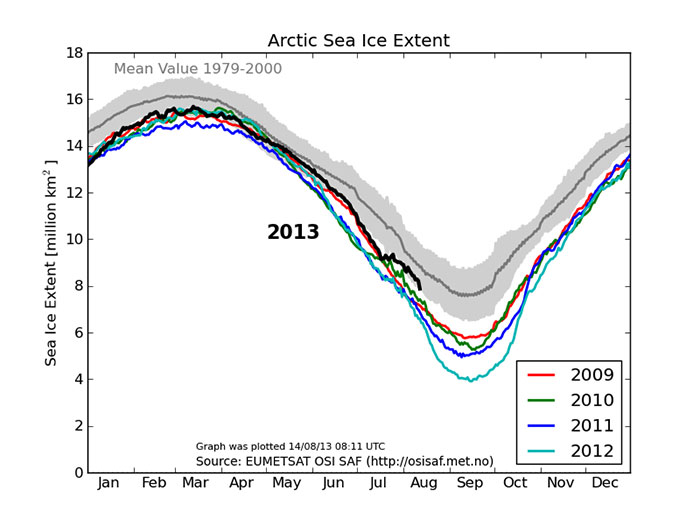
As the above image shows, sea ice extent (30%+ concentration) is now lower than any other year, except 2007 and 2012. Moreover, the sharp decline looks set to continue.

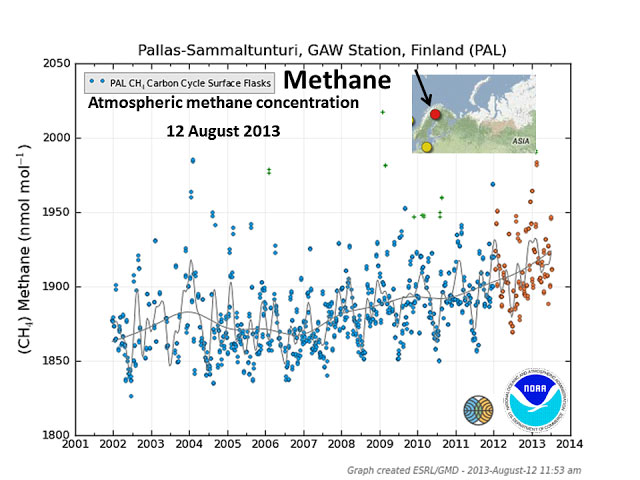
Ice volume and concentration have dropped dramatically, partly as a result of the cyclone that hit the Arctic Ocean a few days ago.


The eye of the cyclone is still visible almost exactly above the North Pole on the Naval Research Laboratory image below on the right, where sea ice concentration appears to form a circle.


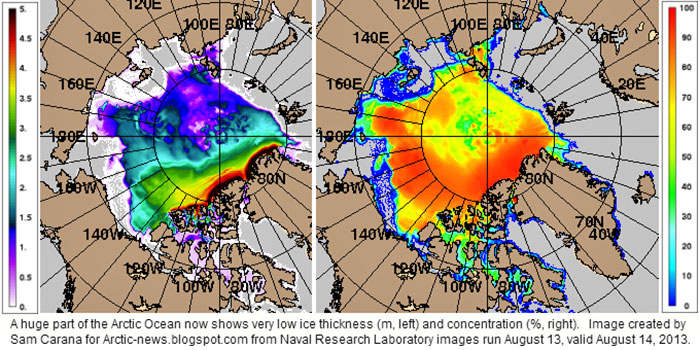
The sea ice looks set for an all-time record low; all this thin ice looks set to disappear over the next few weeks.


The graph below, also by the Danish Meteorological Institute, calculates sea ice extent by including all areas with 15% or more ice concentration.


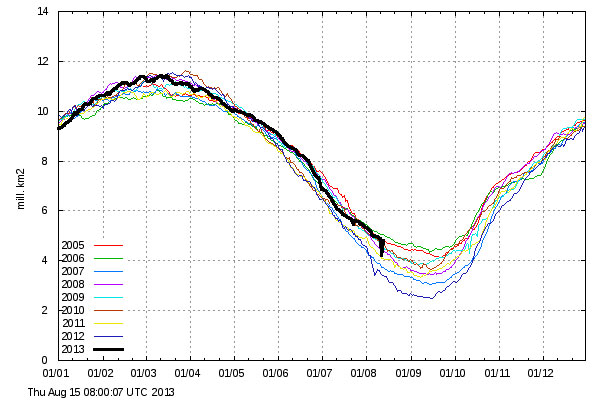
The above graph also shows a steep recent descent, although not as pronounced as in the graph at the top that includes spots with 30% or more ice concentration.


The graph at the top better illustrates recent drops in ice concentration from, say, 40% to 20%, which can occur quite abruptly due to the impact of a cyclone. 


The Danish Meteorological Institute has meanwhile produced a more recent version of the graph based on spots with 30% or more ice concentration (added below).


The above graph shows an August 15 extent that appears to be back in line with the earlier trend.


At first glance, it may appear as if the sea ice has largely recovered from the impact of three cyclones that have hit the Arctic Ocean over the past two months. 


However, these cyclones are likely to have contributed to the appearance and persistence of thin spots in the ice close to the North Pole. This phenomenon was earlier described in posts such as Thin Spots developing in Arctic Sea Ice


The conclusion remains the same as the one drawn then in that post, i.e. that for years, observation-based projections have been warning about Arctic sea ice collapse within years, with dire consequences for the Arctic and for the world at large.

Cyclones can speed up this collapse.


On this point, it's good to remember what Prof. Peter Wadhams said in 2012:

"...apart from melting, strong winds can also influence sea ice extent, as happened in 2007 when much ice was driven across the Arctic Ocean by southerly winds (not northerly, as she stated).


The fact that this occurred can only lead us to conclude that this could happen again. Natural variability offers no reason to rule out such a collapse, since natural variability works both ways, it could bring about such a collapse either earlier or later than models indicate.

In fact, the thinner the sea ice gets, the more likely an early collapse is to occur.


It is accepted science that global warming will increase the intensity of extreme weather events, so more heavy winds and more intense storms can be expected to increasingly break up the remaining ice, both mechanically and by enhancing ocean heat transfer to the under-ice surface."

Hopefully, more people will realize the urgency of the situation and realize the need for a comprehensive and effective plan of action as described here.


Dramatic Rise in Methane Levels

...Since End July 2013

by Sam Carana

August 11, 2013

from ArticNews Website  


There has been a dramatic rise in methane levels since end July 2013. The image below pictures methane levels above 1950 ppb on the Northern Hemisphere from 12 p.m. August 9, 2013, to 12 a.m. August 10, 2013.


Quite suddenly, readings above 1950 ppb have become commonplace since July 31, 2013.
 

The chart below illustrates the dramatic jump in methane levels that occurred since July 31, 2013. The chart shows the area (square km) with methane readings over 1950 ppb for selected layers, over the period from July 24, 2013, to August 9, 2013.


The chart further below shows that peak methane levels have increased dramatically.


Particularly worrying are high levels of methane over the Arctic Ocean, such as on the image below showing methane levels over 1950 ppb in yellow for selected layers on August 5, 2013 (a.m.).


Methane levels are also very high on the Southern Hemisphere, as illustrated by the image below on the right.


High readings have featured over the heights of Antarctica for quite some time, but the high levels of methane over the oceans on the Southern Hemisphere have only shown up recently.


They could be caused by one or more methane hydrates getting destabilized in the ocean between Antarctica and South America.


Peter Carter sent the image below, edited from NOAA Earth System Research Laboratory, showing high (and rising) methane levels in Pallas Sammaltunturi (north Scandinavia), measured with surface flasks.


Peter also added the image below, pointing at high methane levels in Lac La Biche, Northern Alberta, Canada. 

What to make of it?, Peter adds, It is not far from the Tar Sands - that does have a methane problem, but it is basically wetland peat region vicinity which is why I checked it.


See also, "New Climate Threat as Methane Rises From Cracks in Arctic Ice".