|

17 April 2009
from WatsUpWithThat Website
Those masters of disaster are at it
again, and it appears our friendly scientists at that National Snow
and Ice Data Center (NSIDC) help this story along each year.
Thanks to WUWT (What'sUpWithThat Website) reader Ron de Haan who spotted this on "Antarctic
Sea Ice - Wilkins Ice Shelf".
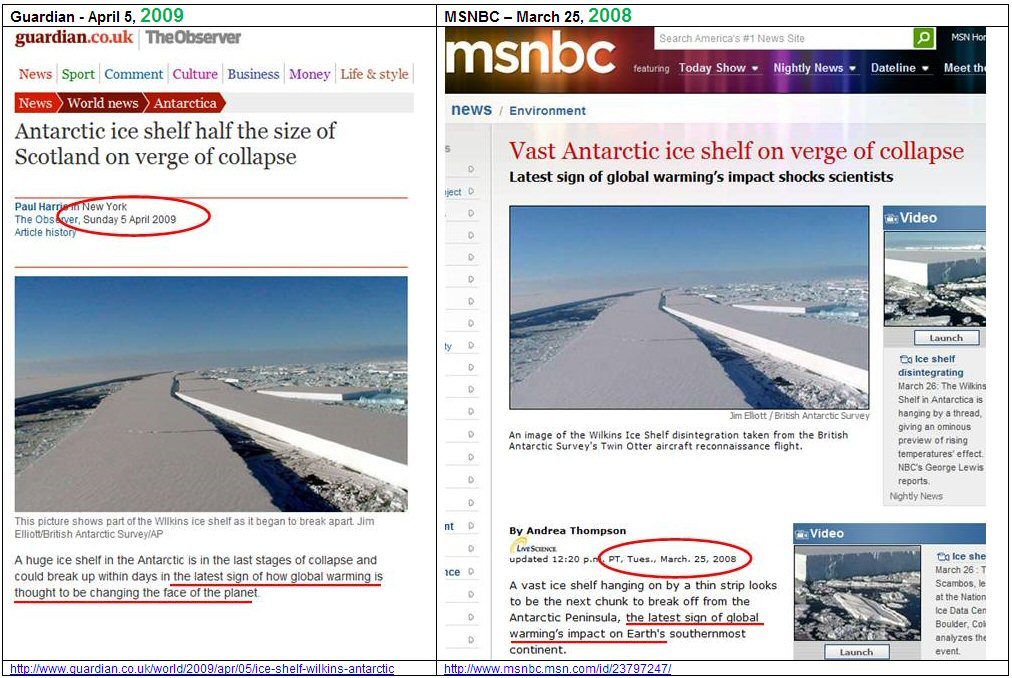
Note the dates for these two stories are a year apart, but use the
same photo.
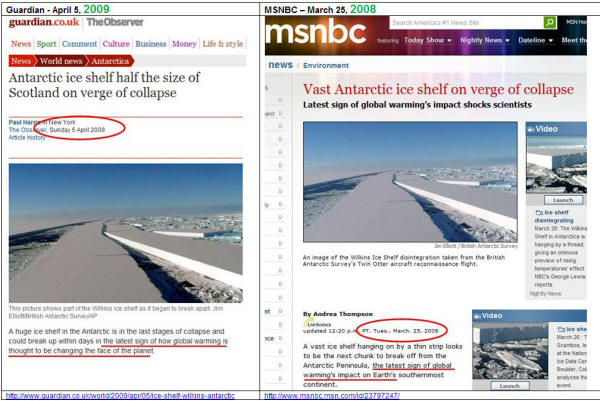
It seems that not only is the
photography recycled, so is the storyline. It seems to happen every
year, about this time.
Note the photos show shear failure and
cracks, not melted ice. Shear failure is mostly mechanical-stress
related, though ice does tend to be more brittle at colder
temperatures.
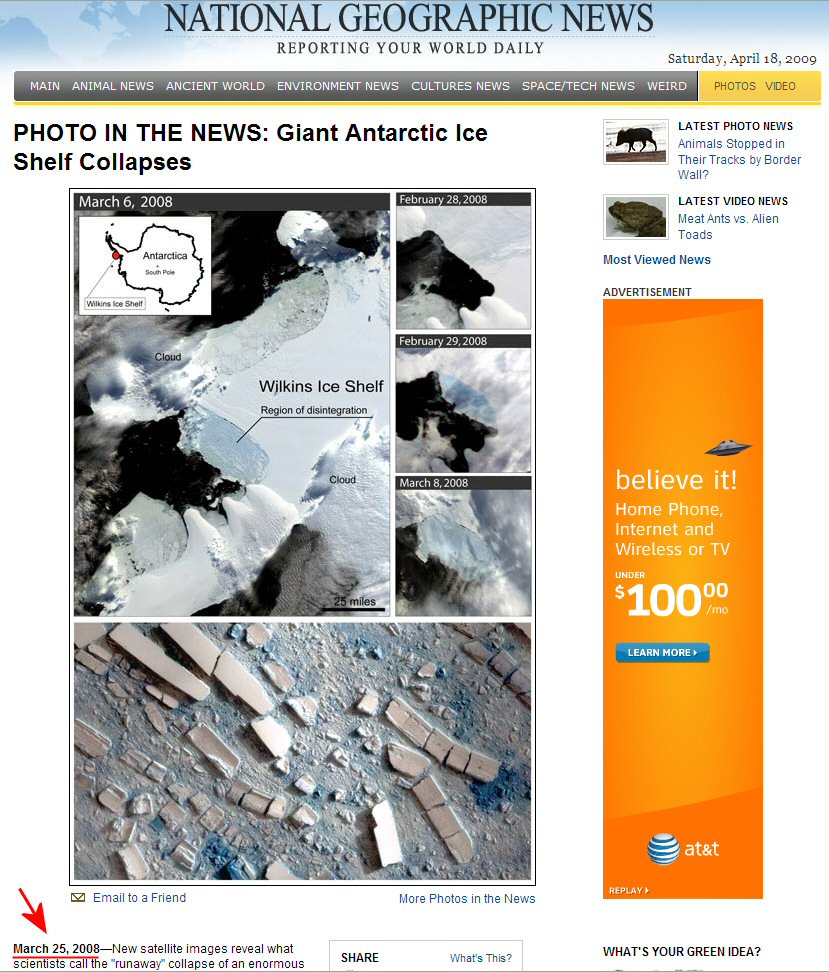
National Geographic reported this story headline last year, March
25th 2008
PHOTO IN THE
NEWS
Giant Antarctic Ice Shelf Collapses
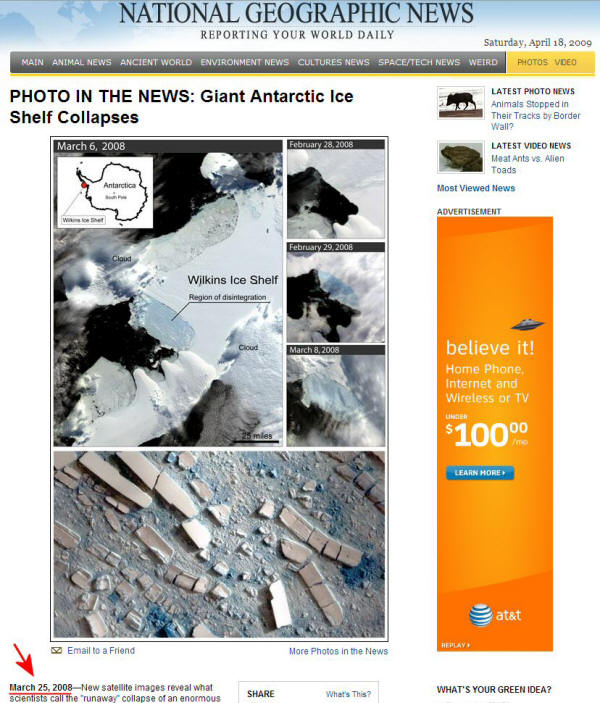
Don’t let the date in the upper right
fool you, that's just an automatic “today’s date” javascript element
found in many webpages.
From the Nat Geo story:
“[It's] an event we don’t get to see
very often,” Ted Scambos, lead scientist at the U.S. National
Snow and Ice Data Center in Boulder, Colorado, said in a press
statement.
Now, how is it that an ice shelf breaks
up in the spring of 2008 and again in the spring of 2009 and it’s
“not very often”? Hmmm...
It seems NSIDC’s Ted Scambos gets around. Doing a Google search for
Wilkins ice shelf + “Ted Scambos” yields about 4,930 results.
Yep, he sure gets the word out every year.
Ted Scambos said something similar in 1999:
“On the southwest side of the
peninsula, the Wilkins ice shelf retreated nearly 1,100 square
kilometers in early March of last year [1998], said Scambos…
Within a few years, much of the Wilkins ice shelf will likely be
gone”
(Antarctic
Ice Shelf Break-Up Accelerates)
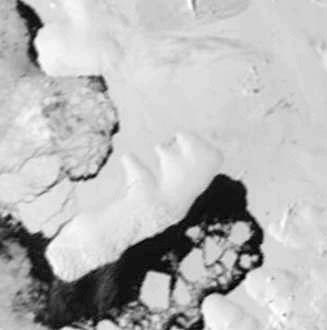
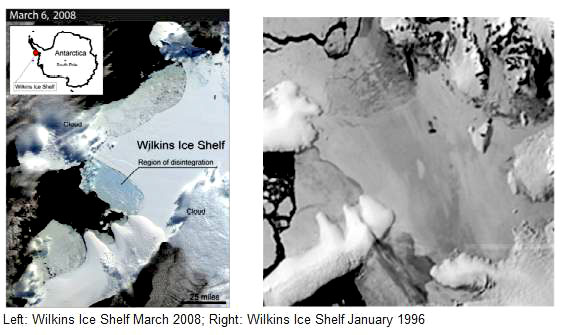
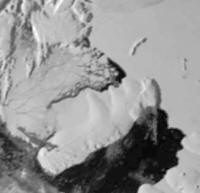
But, as can be seen from the following
January 1996 and March 2008 images, there has been hardly any change
in a decade. Look at the photos below from the appinsys web site:
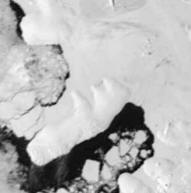
But wait, there’s more examples of that
“not very often” Wilkins ice shelf breakup, again from the
appinsys
web site:
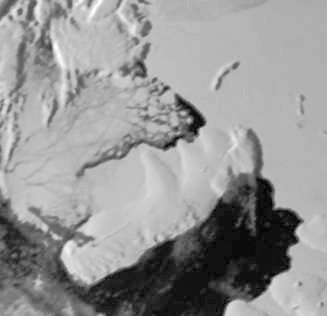
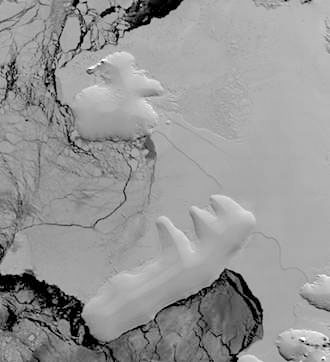
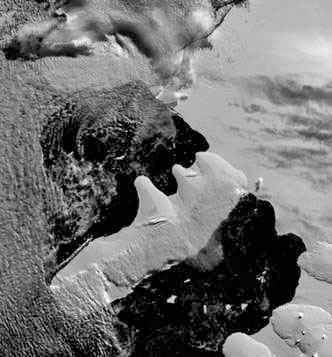
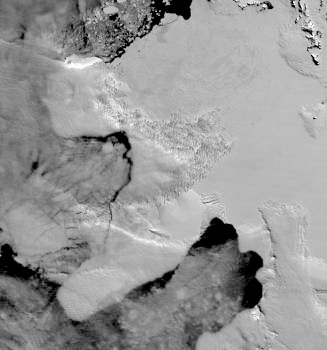
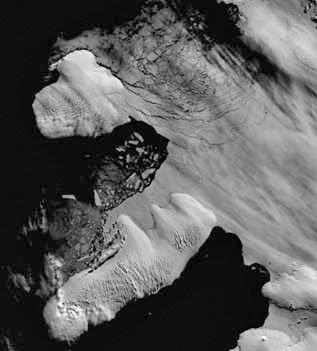
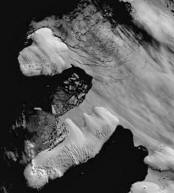
As the following historical
satellite images of the Wilkins Ice Shelf show, the
disintegration/re-growth is an annual event (winter ice
re-growth season; summer melt season).
|
Wilkins Ice
Shelf Dec 1993 |
Wilkins
disintegration in Feb 1994 |

Wilkins in
Oct 2004, on the mend |
|

Wilkins in
Mar 2004 - breaking up again |

Wilkins in
Nov 2008 - icing up |
Wilkins in
Feb 2009 - uh oh! |
But we just know warming is involved, NSIDC says so:
The MSNBC 2008 article reports on a
NSIDC article which states:
“NSIDC Lead Scientist Ted Scambos, who first spotted the disintegration in March,
said, “We believe the Wilkins has been in place for at least
a few hundred years. But warm air and exposure to ocean
waves are causing a break-up.”
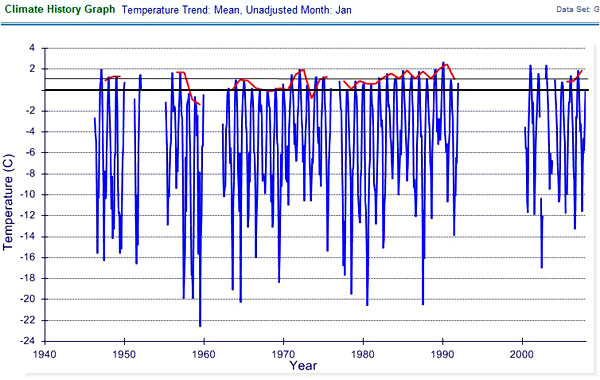
The closest station to the Wilkins Ice
Shelf in the NOAA Global Historical Climate Network database is
Rothera Point.
The following figure shows the historical data for
Rothera Point, with monthly temperatures in
blue and the annual
January temperature in red. Summer (Dec–Mar) temperatures have not
increased – the 2000s January temperatures are similar to the 1940s
(the oldest data available).
So why does NSIDC’s Scambos blame it on
air temperatures?
The
appinsys article goes on to talk about
ocean currents and sea
surface temperatures being a contributor, and it is worth the read.
The real question is, how often are we going to see the Wilkins Ice
Shelf be a lead news story as poster child for “global warming” to
illustrate ice loss in Antarctica that is actually growing.
I guess as long as we have NSIDC’s Ted Scambos to help the media, it
will be “something we get to see fairly often”.
|