|
19 February 2009 from IceAgeNow Website
In May, 2008, the National Snow and
Ice Data Center (NSIDC) predicted that the North Pole
would be ice-free during the 2008 melt season because of ‘global
warming.’
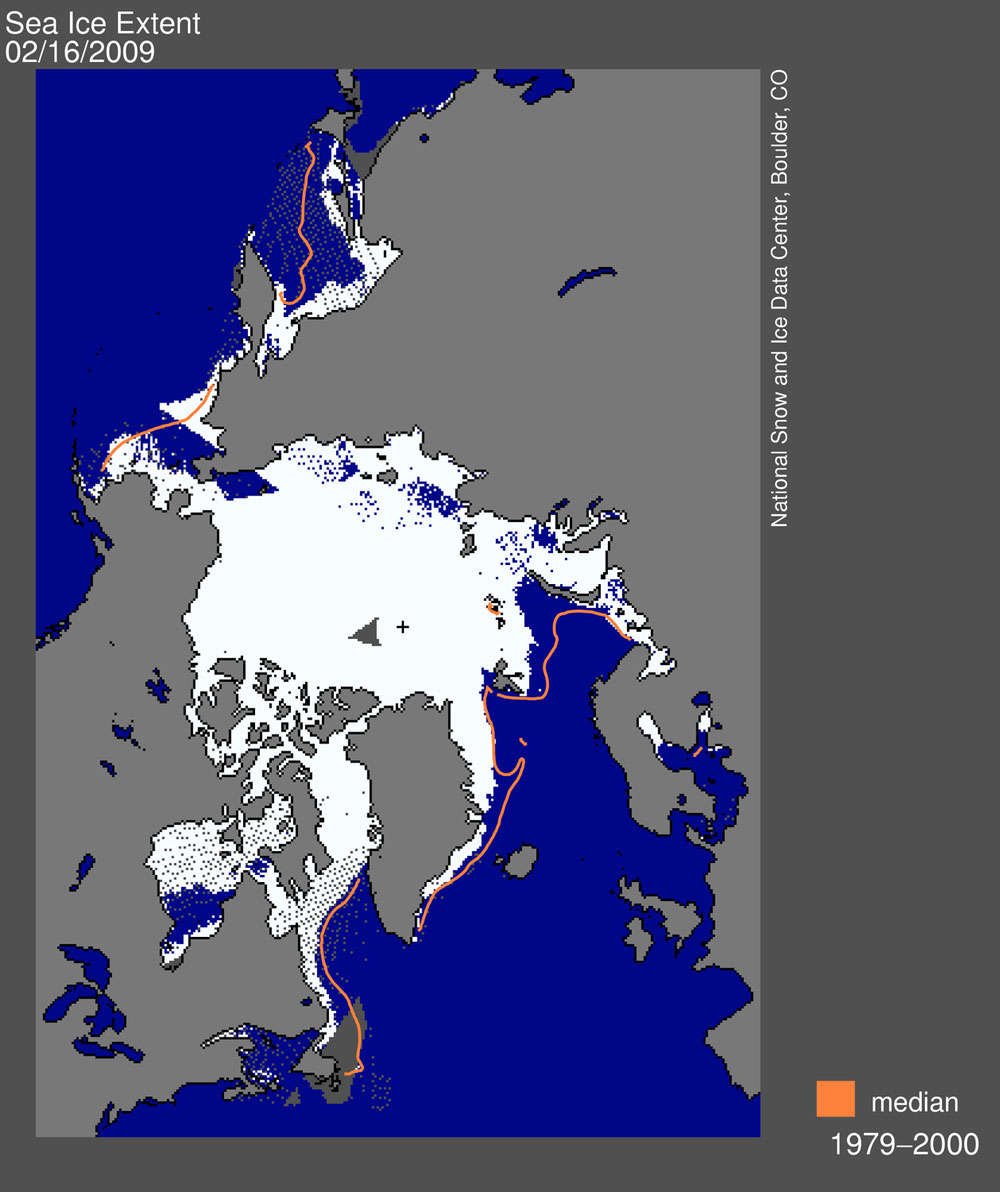
Daily Arctic sea ice extent map for 15 Feb 2009
showed areas of open
water that should have appeared as sea ice.
And we’re supposed to trust these people? (See below reports)
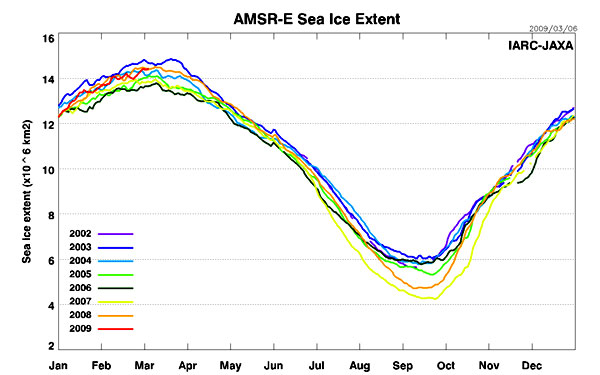
As opposed to the NSIDC information, AMSR-E data - compiled in cooperation with the Japan Aerospace Exploration Agency and the Advanced Earth Science and Technology Organization of Japan - shows that sea ice extent in 2009 is running ahead of 2005, 2006, 2007, and 2008.
Perhaps the NSIDC’s prediction of an ice-free north pole is premature.
...Cause Data
Outage from ArcticSeaIceNewsAndAnalysis Website
As some of our readers have already noticed, there was a significant problem with the daily sea ice data images on February 16.
The problem arose from a malfunction of the satellite sensor we use for our daily sea ice products. Upon further investigation, we discovered that starting around early January, an error known as sensor drift caused a slowly growing underestimation of Arctic sea ice extent.
The underestimation reached
approximately 500,000 square kilometers (193,000 square miles) by
mid-February. Sensor drift, although infrequent, does occasionally
occur and it is one of the things that we account for during quality
control measures prior to archiving the data. See below for more
details.
Figure 1. Daily Arctic sea ice extent map for February 15, 2009, showed areas of open water which should have appeared as sea ice.
Sea Ice Index data.
About the data.
These satellites are operated by the
U.S. Department of Defense. Their primary mission is support of U.S.
military operations; the data weren’t originally intended for
general science use.
High-quality archives from SSM/I, combined with data from the earlier Scanning Multi-channel Microwave Radiometer (SMMR) data stream (1979–1987) provide a consistent record of sea ice conditions now spanning 30 years.
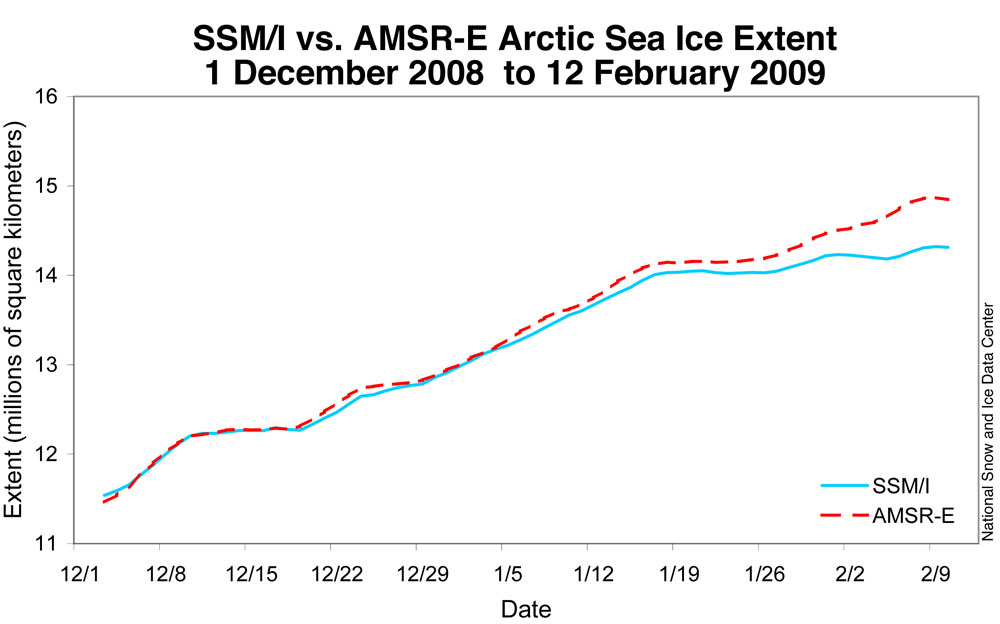
Figure 2. Daily total Arctic sea ice extent between 1 December 2008 and 12 February 2009 for Special Sensor Microwave/Imager SSM/I
compared to the
similar NASA Earth Observing System Advanced Microwave Scanning
Radiometer (EOS AMSR-E) sensor.
However, the SSM/I sensors have proven themselves to be generally quite stable. Thus, it is reasonable to use the near-real-time products for displaying evolving ice conditions, with the caveat that errors may nevertheless occur. Sometimes errors are dramatic and obvious. Other errors, such as the recent sensor drift, may be subtler and not immediately apparent. We caution users of the near-real-time products that any conclusions from such data must be preliminary.
We believe that the potential problems
are outweighed by the scientific value of providing timely
assessments of current Arctic sea ice conditions, as long as they
are presented with appropriate caveats, which we try to do.
For more information on the switch, see
“Note
on satellite update and intercalibration,” in our June 3,
2008 post.
As a result, our processes underestimated total sea ice extent for the affected period.
Based on comparisons with sea ice extent derived from the NASA Earth Observing System Advanced Microwave Scanning Radiometer (EOS AMSR-E) sensor, this underestimation grew from a negligible amount in early January to about 500,000 square kilometers (193,000 square miles) by mid-February (Figure 2).
While dramatic, the underestimated
values were not outside of expected variability until Monday,
February 16. Although we believe that data prior to early January
are reliable, we will conduct a full quality check in the coming
days.
There is a balance between being as accurate as possible at any given moment and being as consistent as possible through long time periods. Our main scientific focus is on the long-term changes in Arctic sea ice.
With that in mind, we have chosen to continue using the SSM/I sensor, which provides the longest record of Arctic sea ice extent.
from ArcticSeaIceNewsAndAnalysis Website
1. ice extent - the total area covered by some amount of ice, including open water between ice floes; ice extent is typically reported in square kilometers. 2. maximum ice extent - the largest sea ice extent during a given year; maximum ice extent marks the end of the growth period for sea ice, and the start of the melt season
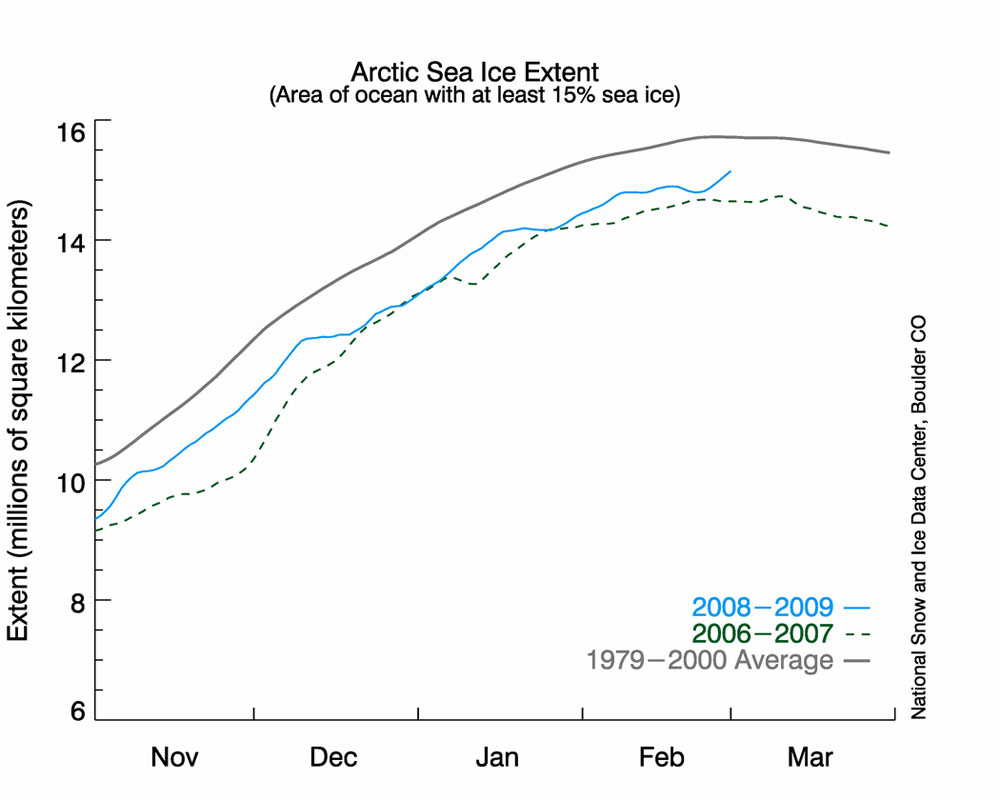
From February 18 to 22, ice extent declined slightly, primarily because of weather conditions off the coast of Alaska; ice extent then rebounded.
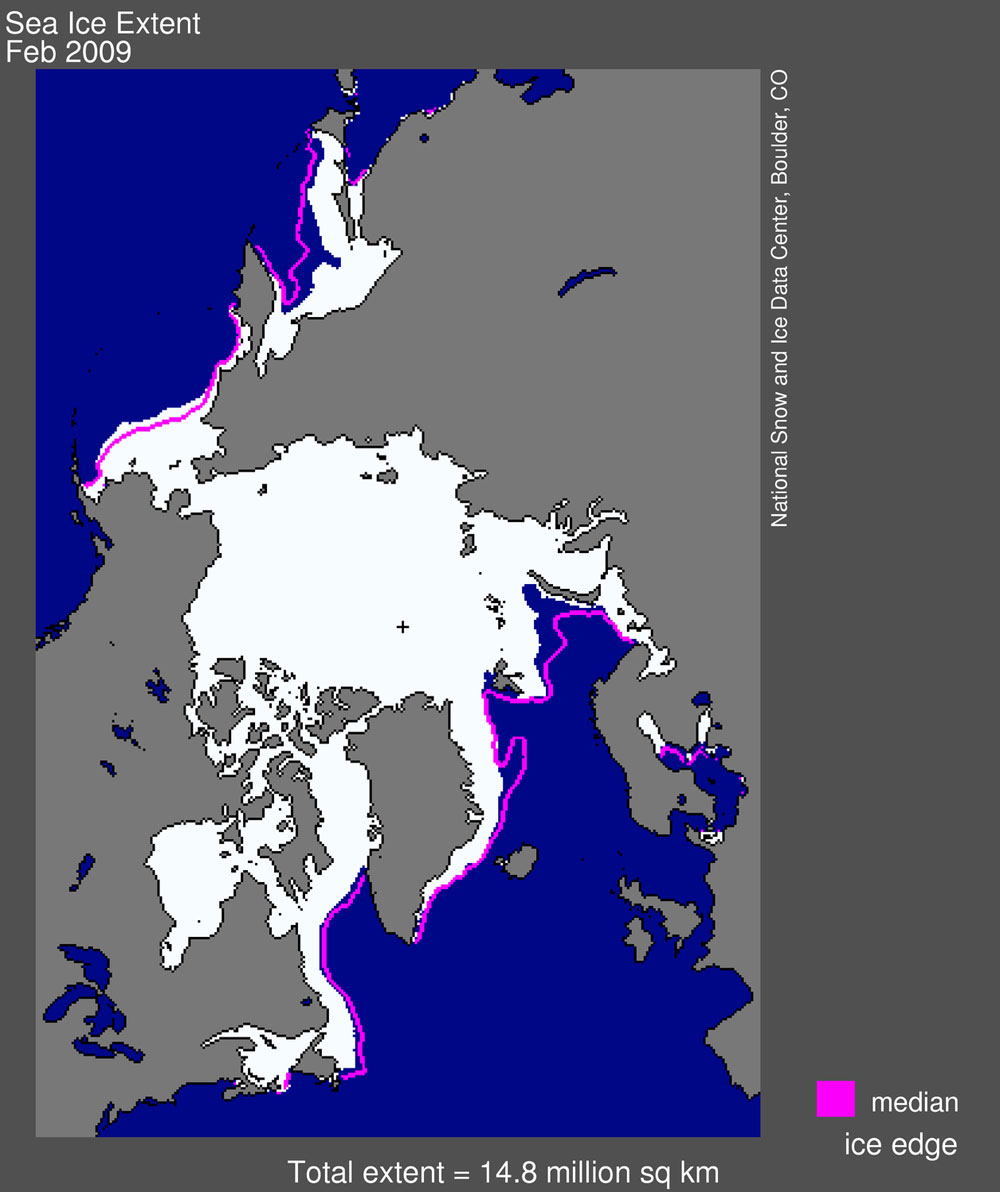
Figure 1. Arctic sea ice extent for February 2009 was 14.84 million square kilometers (5.73 million square miles). The magenta line shows the 1979 to 2000 average extent for December.
The black cross
indicates the geographic North Pole. Sea Ice Index data.
About the data.
These values are based on data from the F13 Special Sensor Microwave/Imager (SSM/I) sensor, which NSIDC is once again using because of problems with the sensor on the F15 satellite.
See our February 26 post for details.
Figure 2. The graph above shows daily sea ice extent. The solid blue line indicates 2008–2009; the dashed green line shows 2006–2007 (the record-low summer minimum occurred in 2007);
and the solid gray
line indicates average extent from 1979 to 2000. Sea Ice Index data.
Such ups and downs are not unusual at this time of year, as ice extent nears its annual maximum.
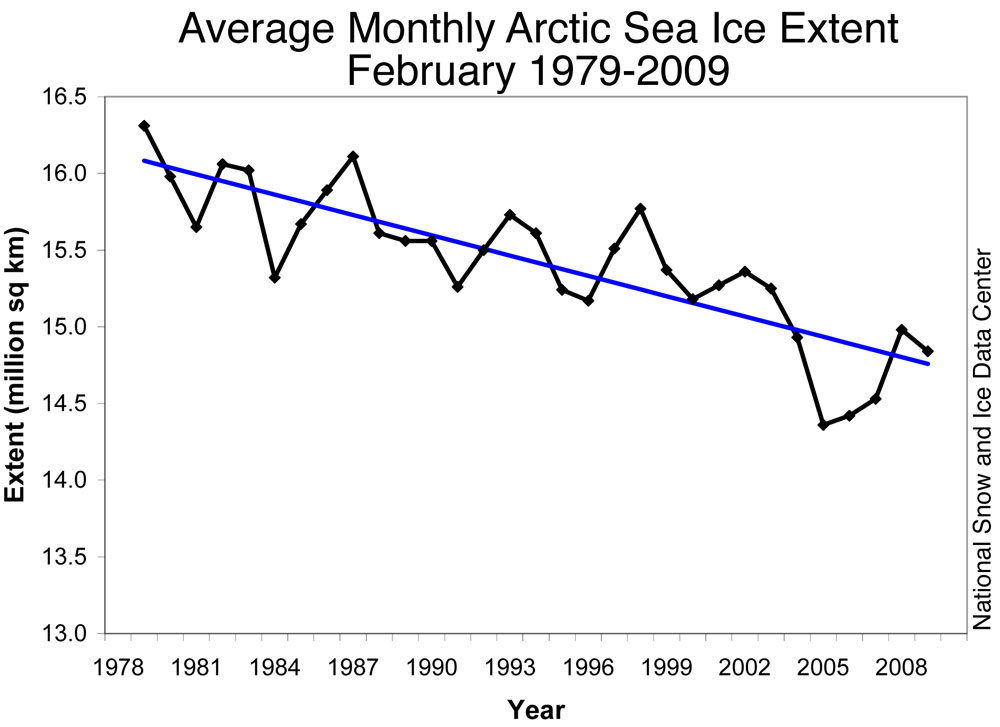
Figure 3. Monthly February ice extent for 1979 to 2009
shows 2009 as the
fourth-lowest February on record.
February 2005 had the lowest ice extent for the month; February 2006 was the second lowest; and February 2007 is in third place. Including 2009, the downward linear trend in February ice extent over the satellite record stands at –2.8% per decade.
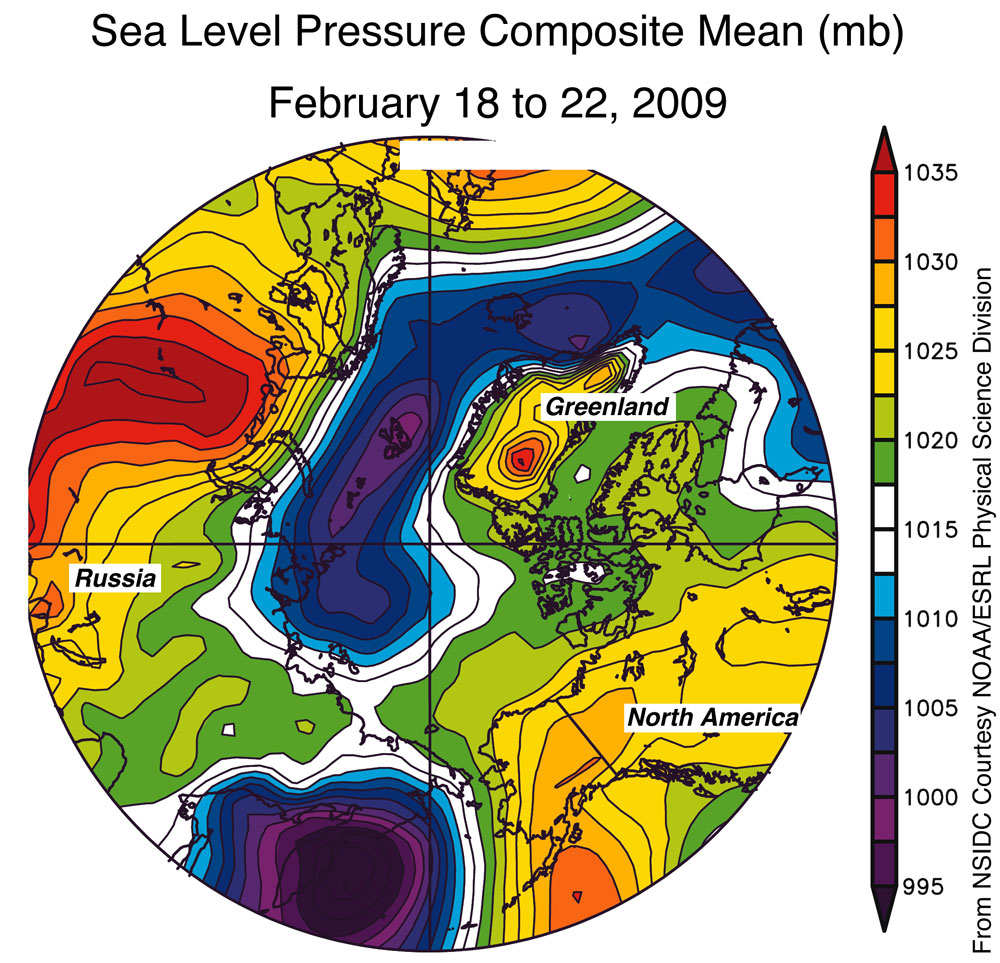
Figure 4. The map of sea level pressure (in millibars) over the Arctic, averaged for February 18 to 22, 2009,
shows the pressure
systems that caused warm southerly winds to compact and melt the ice
in the Bering Sea and Gulf of Alaska.
courtesy NOAA/ESRL
Physical Sciences Laboratory
Conditions along southern boundary of the ice
cover, such as in the Bering Sea, are typically just barely cold
enough for ice to exist, and the ice there can quickly expand or
retreat in response to changes in temperature and winds.
Air temperatures in the region at the 925 millibar level (approximately 915 meters [3,000 feet] above the surface) were up to 8°C (14°F) above average.
|