|
PATTERN RECOGNITION AND ZETA RETICULI
by Carl Sagan and Steven Soter
“The Zeta Reticuli Incident” is very provocative. It claims that a map, allegedly shown on board a landed extraterrestrial spacecraft to
Betty Hill in 1961, later drawn by her from memory and published in 1966, corresponds well to similar maps of the closest stars resembling the Sun based on stellar positions in the 1969 Gliese Catalog of Nearby Stars. The comparison maps were made by
Marjorie Fish using a three dimensional physical model and later by a group of Ohio State University students using a presumably more accurate (i.e., less subjective) computer generated projection. The argument rests on how well the maps agree and on the statistical significance of the comparison.
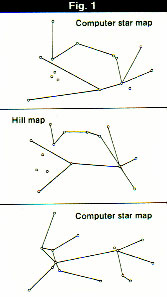
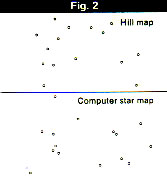
Figure 1 shows the Hill map and the Ohio State computer map with connecting lines as given in the ASTRONOMY article. The inclusion of these lines (said to represent trade or navigation routes) to establish a resemblance between the maps is what a lawyer would call “leading the witness.” We could just as well have drawn lines as in the bottom of Figure 1 to lead the other way. A less biased comparison of the two data sets, without connecting lines as in
Figure 2, shows little similarity. Any residual resemblance is enhanced by there being the same number of points in each map, and can be accounted for by the manner in which these points were selected.
The computer star map includes the Sun and 14 stars selected from a list of the 46 nearest stars similar to the Sun, derived from the Gliese catalog. It is not clear what criteria were used to select precisely these 14 stars from the list, other than the desire to find a resemblance to the Hill map. However, we can always pick and choose from a large random data set some subset that resembles a preconceived pattern. If we are free also to select the vantage point (from all possible directions for viewing the projection of a three dimensional pattern), it is a simple matter to optimize the desired resemblance. Of course such a resemblance in the case of selection from a random set is a contrivance -- an example of the statistical fallacy known as “the enumeration of favorable circumstances.”
The presence of such a fallacy in this case appears even more likely when we examine the original Hill drawing, published in “The Interrupted Journey” by
John Fuller. In addition to the prominent points that Betty Hill connected by lines, her map also includes a number of apparently random dots scattered about -- evidently to
represent the presence of background stars but not meant to suggest actual positions. However, three of these dots appear in the version of the Hill map used in the comparison, while the others are absent. Thus some selection was made even from the original Hill map, although not to the same extent as from the Gliese catalog. This allows even greater freedom to contrive a resemblance.
Finally, we hear from “The Interrupted Journey” that
Betty Hill first thought she saw a remarkable similarity between her UFO star map and a map of the constellation Pegasus published in the New York Times in 1965 to show the position of the quasar CTA-102. How many star maps, derived from the Gliese catalog or elsewhere, have been compared with Betty Hill’s before a supposed agreement was found? If we suppress information on such comparisons we also overestimate the significance of the result.
The argument on “The Zeta Reticuli Incident” demonstrates only that if we set out to find a pattern correlation between two nearly random data sets by selecting at will certain elements from each and ignoring others, we will always be successful. The argument cannot serve even to suggest a verification of the Hill story -- which in any case is well known to be riddled with internal and external contradictions, and which is amenable to interpretations which do not invoke extraterrestrial intelligence. Those of us concerned with the possibility of
extraterrestrial intelligence must take care to demand adequately rigorous standards of evidence. It is all too easy, as the old Chinese proverb says, for the imprisoned maiden to mistake the beating of her own heart for the hoof beats of her rescuer’s horse.
Steven Soter is a research associate working under the advisement of
Carl Sagan, director of Cornell University’s laboratory for Planetary Studies.
Reply: by Terence Dickinson
The question raised by Steven Soter and
Carl Sagan concerning the pattern resemblance of the Hill map and the computer generated projection of the Fish pattern stars is certainly a key question worthy of discussion. Next month two authors will make specific comments on this point.
Briefly, there is more to discounting the Fish interpretation than pattern resemblance. We would have discounted the Fish interpretation immediately on pattern resemblance alone. The fact that all the connecting lines join stars in a logical distance progression, and that all the stars are solar type stars, is significant. Ms. Fish tried to fit hundreds of other viewpoints and this one was
the only one that even marginally fit and made sense in three dimensions and contained solar type stars. In this context, you could not “have just as well drawn the lines... to lead the other way.”
Naturally, there was a desire to find a resemblance between a group of nearby stars and the Hill pattern! That’s why
Marjorie Fish built six models of the solar neighborhood containing the relative positions of up to 256 nearby stars. The fact that she came up with a pattern that fits as well as it does is a tribute to her perseverance and the accuracy of the models. Stars cannot be moved around “to optimize the desired resemblance.” Indeed
Marjorie Fish first tried models using nearby stars of other than strictly solar type as defined in the article. She found no resemblances.
The three triangle dots selected from the background dots in the Hill map were selected because Mrs. Hill said they were more prominent than the other background stars. Such testimony was the basis of the original map so we either accept Mrs. Hill’s observations and attempt to analyze them or reject the whole incident. We feel there is sufficient evidence compelling us not to reject the whole incident at this time.
We too are demanding rigorous standards of evidence to establish the reality of extraterrestrial intelligence. If there is even the slightest possibility that the Hills’ encounter can provide information about such life, we feel it is worth pursuing. The map is worthy of examination by as many critical minds as possible.
Reply: by David R. Saunders
Last month, Steven Soter and Carl Sagan offered two counterarguments relating to
Terence Dickinson’s article, “The Zeta Reticuli Incident” (ASTRONOMY, December 1974).
Their first argument was to observe that the inclusion of connecting lines in certain maps “is what a lawyer would call “leading the witness”.” This was used as the minor premise in a syllogism for which the major premise was never stated. Whether we should consider “leading the witness” a sin or not will depend on how we conceive the purpose of the original article. The implied analogy between ASTRONOMY Magazine and a court of law is tenuous at best; an expository article written for a nonprofessional audience is entitled, in my opinion, to do all it can to facilitate communication -- assuming that the underlying message is honest.
Much of what we call formal education is really little more than “leading the witness,” and no one who accepts the educational goals objects very strongly to this process. In this context, we may also observe that
Soter’s and Sagan’s first argument provides another illustrative example of “leading the witness;” the argument attacks procedure, not substance -- and serves only to blunt the reader’s possible criticism of the forthcoming second argument. This paragraph may also be construed as an effort to lead the witness. Once we have been sensitized to the possibilities, none of us needs to be further misled!
The second argument offered by Soter and Sagan does attack a substance. Indeed, the editorial decision to publish the original article was a responsible decision only if the issues raised by this second line of possible argument were fully considered. Whenever a statistical inference is made from selected data, it is crucial to determine the strenuousness of that selection and then to appropriately discount the apparent clarity of the inference. By raising the issue of the possible effects of selection, Soter and Sagan are right on target.
However, by failing to treat the matter with quantitative objectivity (by failing to weigh the evidence in each direction numerically, for example), they might easily perform a net disservice.
In some situations, the weight of the appropriate discount will suffice to cancel the clarity of a proposed inference -- and we will properly dismiss the proposal as a mere capitalization on chance, or a lucky outcome. It is abundantly clear that Soter and Sagan regard the star map results as just such a fortuitous outcome. In some other situations, the weight of the appropriate discount may be fully applied without accounting for the clarity of the inference as a potentially valid discovery. For example, if I proposed to infer from four consecutive coin tosses observed as heads that the coin would always yield heads, you would properly dismiss this proposal as unwarranted by the data. However, if I proposed exactly the same inference based on 40 similar consecutive observations of heads, you would almost certainly accept the inference and begin looking with me for a more systematic explanation of the data. The crucial difference here is the purely quantitative distinction between 4 and 40; the two situations are otherwise identical and cannot be distinguished by any purely qualitative argument.
When Soter and Sagan use phrases such as “some subset that resembles,” “free also to select the vantage point,” “simple matter to optimize,” and “freedom to contrive a resemblance,” they are speaking qualitatively about matters that should (and can) be treated quantitatively. Being based only on this level of argument, Soter’s and Sagan’s conclusions can only be regarded as inconclusive.
A complete quantitative examination of this problem will require the numerical estimation of at least three factors, and their expression in a uniform metric so that wee can see which way the weight of the evidence is leaning. The most convenient common metric will be that of “bits of information,” which is equivalent to counting consecutive heads in the previous example.
One key factor is the degree of resemblance between
the Hill map and the optimally similar computer-drawn map. Precisely how many consecutive heads is this resemblance equivalent to? A second key factor is the precise size of the population of stars from which the computer was allowed to make its selection. And a third key factor is the precise dimensionality of the space in which the computer was free to choose the best vantage point. If the first factor exceeds the sum of the other two by a sufficient margin, we are justified in insisting on a systematic explanation for the data.
The third factor is the easiest to deal with. The dimensionality of the vantage-point space is not more than three. A property of the metric system for weighing evidence is that each independent dimension of freedom leads us to expect the equivalent of one more consecutive head in the observed data. Three dimensions of freedom are worth exactly 3.0 bits. In the end, even three bits will be seen as relatively minor.
The second factor might be much larger than this, and deserve relatively more discussion. The appropriate discount for this selection will be log102C, where C is the number of distinct combinations of stars “available” to the computer. If we were to agree that C must represent the possible combinations of 46 stars taken 14 at a time, then log102C would be 37.8 bits; this would be far more than enough to kill the proposed inference. However, not all these combinations are equally plausible. We really should consider only combinations that are adjacent to one another and to the Sun, but it is awkward to try to specify exactly which combinations these are.
The really exciting moment in working with these data came with the realization that in the real universe, our Sun belongs to a closed cluster together with
just six of the other admissible stars -- Tau Ceti, 82 Eridani, Zeta Tucanae, Alpha Mensae, and Zeta 1 Reticuli and Zeta 2 Reticuli. The real configuration of interstellar distances is such that an explorer starting from any of the seven should visit all of them before venturing outside. If the Hill map is assumed to include the Sun, then it should include the other members of this cluster within an unbroken network of connections, and the other connected stars should be relatively adjacent in the real universe.
Zeta Reticuli occupies a central position in all of the relatively few combinations that now remain plausible. However, in my opinion, the adjacency criteria do leave some remnant ambiguity concerning the combination of real stars to be matched against the Hill map -- but only with respect to the region farthest from the Sun. The stars in the closed cluster and those in the chain leading to Gliese 67 must be included, as well as Gliese 86 and two others from a set of five candidates. Log102C for this remnant selection is 3.9 bits. We must also notice that the constraint that Zeta Tucanae be occulted by Zeta Reticuli reduces the dimensionality of the vantage-point space from 3.0 to 1.0. Thus, the sum of factors two and three is now estimated as only 4.9 bits.
The first factor is also awkward to evaluate -- simply because there is no standard statistical technique for comparing points on two maps. Using an approximation based on rank-order correlation, I’ve guessed that the number we seek here is between 11 and 16 (this is the result cited by Dickinson on page 15 of the original article).
Deducting the second and third factors, this rough analysis leaves us with an empirical result whose net meaning is equivalent to observing at least 6 to 11 consecutive heads. I say “at least,” because there are other factors contributing to the total picture -- not discussed either by
Dickinson or by Soter and Sagan -- that could be adduced to enhance this figure. For example, the computed vantage point is in good agreement with Betty Hill’s reported position when observing the map, and the coordinate system implicit in the boundaries of the map is in good agreement with a natural galactic coordinate system. Neither have we discussed any quantitative use of the connections drawn on
the Hill map, which were put there in advance of any of these analyses.
In the final interpretation, it will always be possible to argue that 5 or 10 or even 15 bits of remarkable information simply isn’t enough. However, this is a matter for each of us to decide independently. In deciding this matter, it is more important that we be consistent with ourselves (as we review a large number of uncertain interpretations of data that we have made) than that we be in agreement with some external authority. I do believe, though, that relatively few individuals will continue a coin-tossing match in which their total experience is equivalent to even six consecutive losses. In scientific matters, my own standard is that I’m interested in any result that has five or more bits of information supporting it -- though I prefer not to stick my neck out publicly on the basis of less than 10. Adhering to this standard, I continue to find the star map results exceedingly interesting.
Dr. David R. Saunders is a Research Associate at the University of Chicago’s Industrial Relations Center.
Reply: by Michael Peck
Carl Sagan and Steven Soter, in challenging the possibilities discussed in “The Zeta Reticuli Incident,” suggest that without the connecting lines drawn into the Hill map and the Fish interpretation there is little resemblance between the two. This statement can be tested using only X and Y coordinates of the points in the Hill map and a projection of the stars in the Fish pattern. The method used for the comparison can be visualized this way:
Suppose points of the Hill map and the Fish map are plotted on separate glass plates. These plates are held parallel (one behind the other), and are moved back and forth and rotated until the patterns appear as nearly as possible to match. A systematic way of comparing the patterns would be to adjust the plates until corresponding pairs of points match exactly. Then the other points in the patterns can be compared. Repeating this process for all the possible pairs of points (there are 105 in this case), the best fit can be found. Mathematically, this involves a change of scale and a simple coordinate transformation.
A computer program was written which, using X and Y coordinates measured from a copy of the Hill map and a projection of the Fish stars, and using the Hill map as the standard, computed new X and Y coordinates for the Fish stars using the process described. From these two sets of coordinates, six quantities were calculated: the average difference in X and Y; the standard deviation of the differences in X and Y, a measure of the amount of variation of the differences; and correlation coefficients in X and Y. The coefficient of correlation is a quantity used by statisticians to test a suspected relation between two sets of data. In this case, for instance, we suspect that the X and Y coordinates computed from the Fish map should equal the X and Y coordinates of the Hill map.
If they matched exactly, the correlation coefficients would be one. If there were no correlation at all, the value would be near zero. We found that, for the best fitting orientation of
the Fish stars, there was a correlation coefficient in X of 0.95 and in Y of 0.91. In addition, the average difference and the standard deviation of the differences were both small -- about 1/10 the total range in X and Y. As a comparison, the same program was run for a set of random points, with resulting correlation coefficients of 1/10 or less (as was expected). We can conclude, therefore, that the
degree of resemblance between the two maps is fairly high.
From another point of view, it is possible to compute the probability that a random set of points will coincide with the Hill map to the degree of accuracy observed here. The probability that 15 points chosen at random will fall on the points of the Hill map within an error range which would make them as close as the Fish map is about
one chance in 10 to the fifteenth power (one million billion). It is 1,000 times more probable that a person could predict a bridge hand dealt from a fair deck.
Michael Peck is an astronomy student at Northwestern University in Illinois.
Rebuttal: To David Saunders and Michael Peck
by Carl Sagan and Steven Soter
Dr. David Saunders last month claimed to have demonstrated the statistical significance of the Hill map, which was allegedly found on board a landed UFO and supposedly depicted the Sun and 14 nearby Sunlike stars. The Hill map was said to resemble the Fish map -- the latter being an optimal two-dimensional projection of a three-dimensional model prepared by selecting 14 stars from a positional list of the 46 nearest known Sunlike stars.
Saunders’ argument can be expressed by the equation SS = DR -(SF + VP), in which all quantities are in information bits. SS is the statistical significance of the correlation between the two maps, DR is the degree of resemblance between them, SF is a selection factor depending on the number of stars chosen and the size of the list, and VP is the information content provided by a free choice in three dimensions of the vantage point for projecting the map. Saunders finds SS = 6 to 11 bits, meaning that the correlation is equivalent to between 6 and 11 consecutive heads in a coin toss and therefore probably not accidental. The procedure is acceptable in principle, but the result depends entirely on how the quantities on the right-hand side of the equation were chosen.
For the degree of resemblance between the two maps, Saunders claims that DR = 11 to 16 bits, which he admits is only a guess -- but we will let it stand. For the selection factor, he at first takes SF = log102C = 37.8 bits, where C represents the combinations of 46 things taken 14 at a time. Realizing that the size of this factor alone will cause SS to be negative and wipe out his argument, he makes a number of ad hoc adjustments based essentially on his interpretation of the internal logic of the Hill map, and SF somehow gets reduced to only 3.9 bits. For the present, we will let even that stand in order to avoid becoming embroiled in a discussion of how an explorer from the star Zeta Reticuli would choose to arrange his/her/its travel itinerary -- a matter about which we can claim no particular knowledge. However, we must bear in mind that a truly unprejudiced examination of the data with no a priori interpretations would give SF = 37.8 bits.
It is Saunders’ choice of the vantage point factor VP with which we must take strongest issue, for this is a matter of geometry and simple pattern recognition. Saunders assumes that free choice of the vantage point for viewing a three-dimensional model of 15 stars is worth only VP = 3 bits. He then reduces the information content of directionality to one bit by introducing the “constraint” that the star Zeta Tucanae be occulted by Zeta Reticuli (with no special notation on the Hill map to mark this peculiarity). This ad hoc device is invoked to explain the absence of Zeta Tucanae from the Hill map, but it reveals the circular reasoning involved. After all, why bother to calculate the statistical significance of the supposed map correlation if one has already decided which points represent which stars?
Certainly the selection of vantage point is worth more than three bits (not to mention one bit). Probably the easiest circumstance to recognize and remember about random projections of the model in question are the cases in which two stars appear to be immediately adjacent. By viewing the model from all possible directions, there are 14 distinct ways in which any given star can be seen in projection as adjacent to some other star. This can be done for each of the 15 stars, giving 210 projected configurations -- each of which would be recognized as substantially different from the others in information content. And of course there are many additional distinct recognizable projections of the 15 stars not involving any two being immediately adjacent (For example, three stars nearly equidistant in a straight line are easily recognized, as in Orion’s belt).
Thus for a very conservative lower bound, the information content determined by choice of vantage point (that is, by being allowed to rotate the model about three axes) can be taken as at least equal to VP = log102(210) = 7.7 bits. Using the rest of Saunders’ analysis, this would at best yield SS = Zero to 4.4 bits -- not a very impressive correlation.
There is another way to understand the large number of bits involved in the choice of the vantage point. The stars in question are separated by distances of order 10 parsecs. If the vantage point is situated above or not too far from the 15 stars, it need only be shifted by about 0.17 parsecs to cause a change of one degree in the angle subtended by some pair of stars. Now one degree is a very modest resolution, corresponding to twice the full moon and is easily detected by anyone. For three degrees of freedom, the number of vantage points corresponding to this resolution is of order (10/0.17)3 ~ 603 ~ 2 X 10⁵, corresponding to VP = 17.6 bits. This factor alone is sufficient to make SS negative, and to wipe out any validity to the supposed correlation.
Even if we were to accept Saunders’ claim that SS = 6 to 11 bits (which we obviously do not, particularly in view of the proper value for SF), it is not at all clear that this would be statistically significant because we are not told how many other possible correlations were tried and failed before the Fish map was devised. For comparison, there is the well-known correlation between the incidence of Andean earthquakes and oppositions of the planet Uranus. It is unlikely in the extreme that there is a physical causal mechanism operating here -- among other reasons, because there is no correlation with oppositions of Jupiter, Saturn or Neptune. But to have found such a correlation the investigator must have sought a wide variety of correlations of seismic events in many parts of the world with oppositions and conjunctions of many astronomical objects. If enough correlations are sought, statistics requires that eventually one will be found, valid to any level of significance that we wish. Before we can determine whether a claimed correlation implies a causal connection, we must convince ourselves that the number of correlations sought has not been so large as to make the claimed correlation meaningless.
This point can be further illustrated by Saunders’ example of flipping coins. Suppose we flip a coin once per second for several hours. Now let us consider three cases: two heads in a row, 10 heads in a row, and 40 heads in a row. We would, of course, think there is nothing extraordinary about the first case. Only four attempts at flipping two coins are required to have a reasonable expectation value of two heads in a row. Ten heads in a row, however, will occur only once in every 210 = 1,024 trials, and 40 heads in a row will occur only once every 240 ~ 1012 trials. At a flip rate of one coin per second, a toss of 10 coins requires 10 seconds; 1,024 trials of 10 coins each requires just under three hours. But 40 heads in a row at the same rate requires 4 X 10¹³ seconds or a little over a million years. A run of 40 consecutive heads in a few hours of coin tossing would certainly be strong prima facie evidence of the ability to control the fall of the coin. Ten heads in a row under the circumstances we have described would provide no convincing evidence at all. It is expected by the law of probability. The Hill map correlation is at best claimed by Saunders to be in the category of 10 heads in a row, but with no clear statement as to the number of unsuccessful trials previously attempted.
Michael Peck finds a high degree of correlation between the Hill map and the Fish map, and thereby also misses the central point of our original criticism: that the stars in the Fish map were already preselected in order to maximize that very correlation. Peck finds one chance in 1015 that 15 random points will correlate with the Fish map as well as the Hill map does. However, had he selected 15 out of a random sample of, say, 46 points in space, and had he simultaneously selected the optimal vantage point in three dimensions in order to maximize the resemblance, he could have achieved an apparent correlation comparable to that which he claims between the Hill and Fish maps. Indeed, the statistical fallacy involved in “the enumeration of favorable circumstances” leads necessarily to large, but spurious correlations.
We again conclude that the Zeta Reticuli argument and
the entire Hill story do not survive critical scrutiny.
Dr. Steven Soter is a research associate in astronomy and
Dr. Carl Sagan is director of the Laboratory for Planetary Studies, both at Cornell University in Ithaca, New York.
Go
Back
|