
by The Global Consciousness Project
Princeton University
from
GlobalConsciousnessProject Website
The financial crisis beginning in late 2008 saw
the sharpest declines beginning in early October. While the GCP formal
analysis protocols don't lend themselves to long drawn out events, we can do
probes and can look at trends in an exploratory manner.
William Treurniet produced some long-term graphical analyses which he
describes in an email:
After the action started on Monday Oct 6,
there is a continuous increase in the Stouffer-Z from the 6th to the
9th, and the p-value is .008 at the end of the period. Do you have an a
priori rule to look at that kind of event? If not, it's post hoc but
interesting nevertheless.
Are you aware of the linguistic prediction technique developed by the
folks at "Half
Past Human"? They analyze the language used on the internet
to predict when significant events are likely to occur. These include
social unrest and natural disasters.
For example, the language indicated that a
major event in the economic and military domains was likely to occur
starting in October, 2008, and would carry through until about February,
2009, I believe. The premise is that the language used well before the
event reflects psychic perceptions on a global scale.
So the EGG network response to the events at
the beginning of October are consistent with their predictions.
See "Half
Past Human - Telephone Interview With Clif High" for a
transcript of an interview by Project Camelot with Cliff High
from Half Past Human. They discuss his technique in more depth.
The following below figure, suggested by
William's analysis, shows October 6-10, the first week of the crisis.
The trend is obvious, and compounds to a probability on the order of 0.016
that it is just chance fluctuation.
The trends are relatively flat both before and
after this week.
This figure is more impressive when we note that
the strong deviation is a mirror reflection of the decline in the Dow
Jones Industrial Average during that same week.
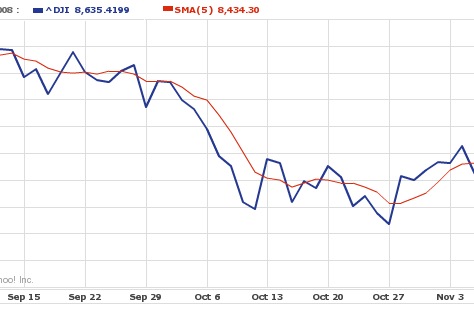
The following below figure shows mid September
to early November.
The deepening public awareness of the financial
meltdown was driven by the precipitous drop in the DJI in the week of
October 6 to 10. (Arguably, the meltdown was reciprocally driven by market
perceptions.) The following figure shows the daily closings and a 5-day
smoothed version (red) in which that week's decline is even more clear.
The segment corresponding to the previous figure
is just the central marked section starting with Oct 6.
Half Past Human
Forecast
The
Half Past Human group uses complex programs to analyze material
extracted from the Internet. I had previously had other suggestions to look
at predictions made by this group.
In particular, Greg Nelson alerted me to
a prediction they made in September, according to George URE,
specifying a date and time when a major event would occur that would have
effects and implications lasting as long as the 9/11 terror attacks. The
date given was October 7, and the specific time was 07:10 UTC.
Here is what Clif, the creator of Half Past
Human says in an interview:
And we then had data that suggested that
there might be a little tiny dip from 9/27 until October 7th in terms of
the amount of that building tension, but it was basically still on that
same plateau.
And then on October 7th... And I chose... well, you know, the Universe
moved me to choose it, I chose ten minutes after 7 in the morning, UTC
time, which makes it ten after midnight my time here on the Pacific
coast on October 7th would be the point at which we would slip into what
I call Release Language.
Release Language is where everybody is letting out the emotion,
as opposed to letting the emotion in, in effects on their body. They
just can't take it any more, and they're expressing that emotion. Good,
bad, or indifferent, they're expressing it.
So release has to do with expression.
Building has to do with input.
And we're going to get into a period that goes from October 7 until...
Now the new data run is showing it moved into about mid-March of 2009,
pretty straight-forward release language that entire period, with no
little stair-steps, if you will, in the building-tension language.
This remarkably specific moment is shown in the
following below graph as the beginning of a 10-hour period that does show a
significant trend. (It may look familiar at first glance - the graph is
almost fractally similar to that for 120 hours shown above.)
Please remember that these analyses are post
hoc, not formal, so interpretation in an evidentiary mode is not
appropriate.
It is also important to keep in mind that we
have only a tiny statistical effect, so that it is always hard to
distinguish signal from noise. This means that every "success"
might be largely driven by chance, and every "null" might include a
real signal overwhelmed by noise.
In the long run, a real effect can be identified
only by patiently accumulating replications of similar analyses.