|
September 09, 2012 from ZeroHedge Website
One of the populist buzzwords of the past 5 years, particularly in Europe, has been "austerity".
As we have said for the roughly the same past 5 years, is simply a synonym for "deleveraging" but one which carries just the right amount of negative connotations, and is used by crafty politicians to shift blame from their own failure to enact proper policy (which over the past 30 years has merely meant to borrow growth from future political cycles, aka, issue debt) onto a "technical" word conceived by Ph.D.-clad economists, who too, are looking for a passive victim on which to project their failure of enacting a voodoo economic theory.
There is one problem with all of the above. As we have also been saying for the past five years, the austerity deleveraging myth is one big lie.
We are setting the record straight below with facts and figures.
We would be delighted if some politician, somewhere, could disprove these facts, which essentially imply that the world is now in a global recession, having experienced no growth as the recent 100% contractionary PMI print of all major economies confirms, yet without any country actually having implemented austerity, pardon deleveraging to have at least a modest justification for this failure of growth.
Finally, this article proves that the European chorus screaming for "growth" when everyone knows it demands merely more of the same drug - debt - is 100% wrong, and that while the underlying causes of "growth" are there, the only thing missing are the symptoms.
DB's Jim Reid provides the charts and facts:
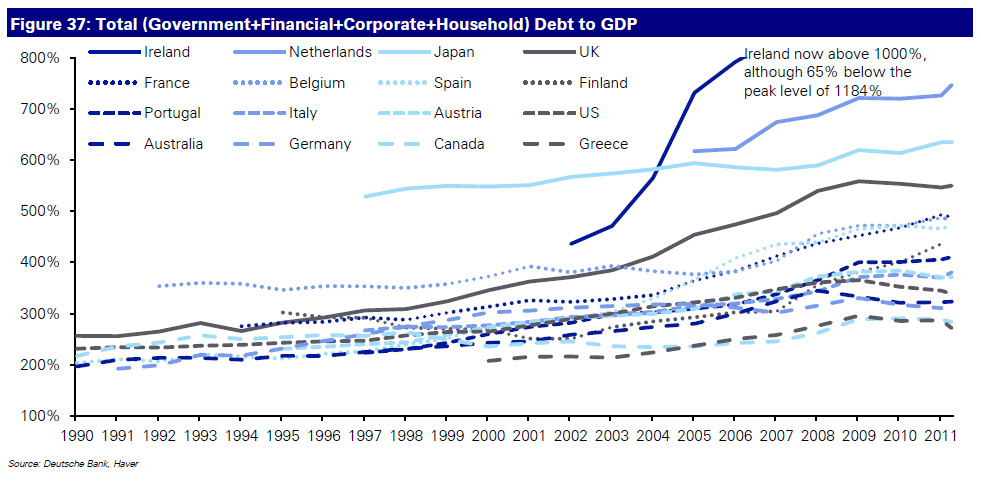
Figure 37 shows the combined Debt to GDP of the EU-12 (excluding Luxembourg), the U.S., UK, Japan and Australia.
This debt includes Governments, Financials, Corporates and Households. Ireland’s small economy and large financial system (domestic and foreign), ensures an outsized reading which we cut off in the chart.
Figure 38 then shows:
The data is represented in percentage point moves.
As can be seen, only the U.S. and Australia have seen their overall economy Debt to GDP fall since the end of 2007 and for both these the fall is negligible.
The U.S. has gone from around 348% to 345% on this measure. From the peak the U.S. has fallen from the 366% seen in 2009 and the 353% seen in 2010 but few other countries are seeing their debt/gdp ratio move in the right direction.
Many are currently at their peak overall economy wide leverage number and as already discussed when looked at from the start of the crisis all but the U.S. and Australia have seen this ratio rise. Interestingly as we’ll see below Australia and the U.S. have still seen debt rise but Nominal GDP has risen by a higher amount, thus helping them see leverage ratios decline slightly.
It shows how important growth and inflation are if you want to delever.
Deleveraging problems from both the debt and growth side
The deleveraging problem comes from both sides.
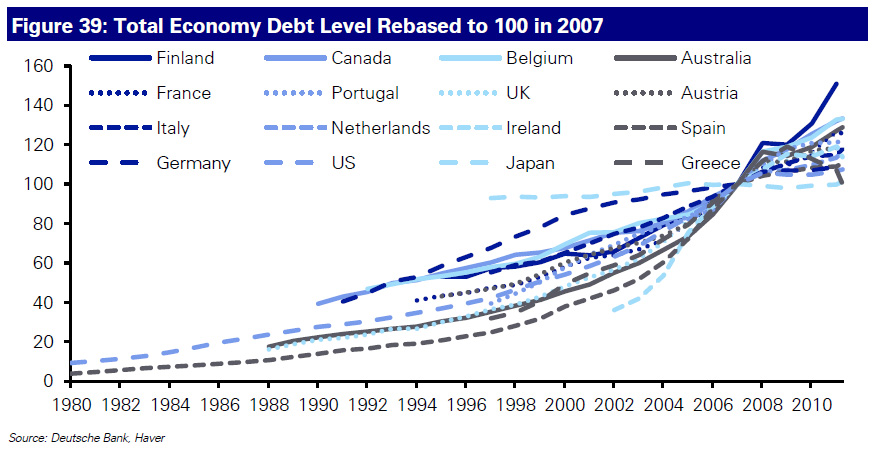
As we saw in Figure 36 in the previous section, growth has struggled to eclipse its peak levels across a number of countries with only inflation allowing many to surpass their peak activity levels. In terms of debt, Figure 39 shows the growth of an index of economy wide liabilities from our DW sample rebased at 100 at the end of 2007.
We have gone back as far as the full data starts for each country.
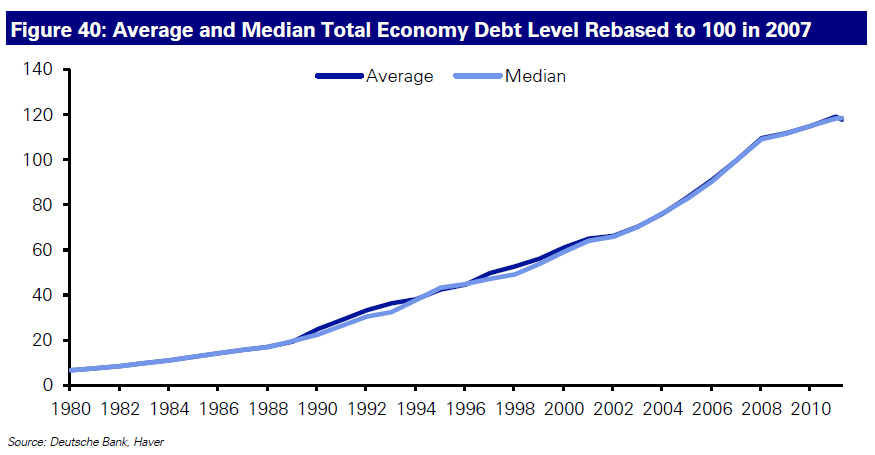
Figure 40 then shows a simple un-weighted average and median of this basket and shows that debt is still increasing in the developed world.
Figure 41 then looks at the numbers for each country again from the end of 2007 to Q1 2012, since the end of 2010 and also from the peak.
Debt hasn't started to turn down anywhere in the Developed World since the end of 2007. As already discussed, those that have seen their debt/GDP ratios stabilize (e.g. U.S. and Australia) have required some nominal GDP growth.
So debt is still climbing in most countries.
Clearly the splits are changing with more emphasis on public over private debt but there's little evidence that the DM deleveraging trend has started yet.
Given such an unparalleled run up in debt over the last few years and decades, will we be able to de-lever naturally and without defaults? If we can find a higher pace of growth and inflation than debt accumulation then we can.
But can every country succeed? The reality is that we would make a strong argument suggesting that the high debt burdens are actually holding growth back thus ensuring a problem of circularity.
As a minimum it likely ensures that these economies remain fragile and vulnerable to shocks for many years to come.
Note: So in aggregate the DM post-GFC world can be characterized by a “No Growth, No Deleveraging” mantra and one where we are still in a similar situation to where we were five years ago.
|