|

by Montalk
14 July 20008
from
Montalk Website
Can HAARP manipulate storms, hurricanes,
and earthquakes?
There is definitely a correlation
between these and when HAARP is active. This article will give some
examples of that correlation. And while that alone does not prove a
direct causal relationship, the physics of HAARP and the political
agenda behind the program suggest that weather and earthquake
manipulation is both possible and likely.
Background
I assume everyone reading this knows of
HAARP. Less known is that
HAARP is only one of several such facilities - and not the most
powerful one either.
There are others, here are five:
-
Mu Radar - 1 megawatt facility
in Japan (34°51'14.80"N 136° 6'19.45"E).
-
Arecibo Observatory - 2 megawatt
facility in Puerto Rico (18°20'38.97"N 66°45'9.77"W).
-
HIPAS - 70 megawatt facility
east of Fairbanks, Alaska (64°52'21.18"N 146°50'18.78"W).
-
Sura - 190 megawatt facility in
central Russia (56° 7'10.32"N 46° 2'4.41"E).
-
EISCAT - 1 gigawatt facility in
Tromsø, Northern Norway (69°35'1.06"N 19°12'57.11"E).
(you can copy and paste the coordinates into
google maps)
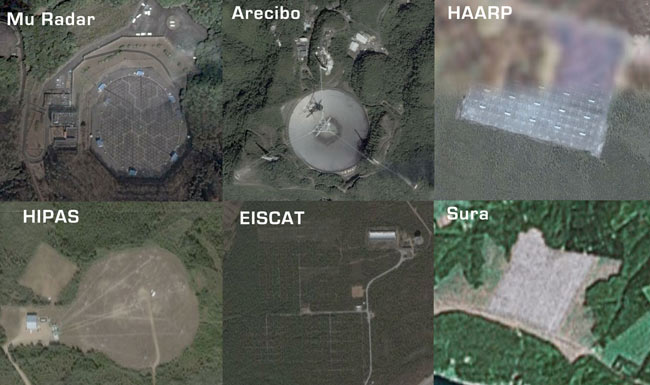
By comparison, HAARP (near Gakona,
Alaska - 62°23'33.73"N 145° 9'2.61"W) is claimed to be a mere 3.6
megawatt facility - and that’s after being upgraded in 2006. It has
278 times less maximum power than the ionospheric heater in Norway.
Nevertheless, HAARP is far from useless.
According to the DARPA (Defense
Advanced Research Projects Agency):
Key to the current effort was the
expansion of the experimental research facility that includes a
3.6 MW high-frequency transmitter and a variety of diagnostic
instruments, to conduct investigations to characterize the
physical processes that can be initiated and controlled in the
ionosphere and space, via interactions with high power radio
waves.
Among these were:
-
the generation of extremely low
frequency/very low frequency radio waves for submarine and
other subsurface communication, and the reduction of charged
particle populations in the radiation belts to ensure safe
spacecraft systems operations;
-
the control of electron density
gradients and the refractive properties in selected regions
of the ionosphere to create radio wave propagation channels;
-
the generation of optical and
infrared emissions in space to calibrate space sensors.
A study completed by an Air Force/Navy
Panel also pointed to additional high-value functions that can
potentially be accomplished with the a 3.6 MW capability, in
particular, the exploration and refinement of scientific principles
that could lead to the development and deployment of a system to
provide protection for spacebased assets from emergent asymmetric
threats. (source)
HAARP alone has many applications, primarily military, and those
listed above are just a small “safe to reveal” set of examples. If
3.6 MW can accomplish these, imagine what 1000 MW might do!
There is an interesting
anecdotal account by Dan Eden of HAARP being
used for surreptitious purposes. Furthermore, he claimed that there
was a second, secret, more powerful installation in Alaska.
Now in
2008, a decade later, the existence of that facility is no longer
secret and its name is HIPAS, which is indeed almost twenty times as
powerful as HAARP.
Physics of
HAARP
What makes these ionospheric heaters so useful is that they consist
of phased arrays.
A phased array is a grid of antennas whose phases
(timing) and amplitudes are individually adjustable. This means a
great variety of different combinations can be tried out,
synthesizing new and complex total wave forms. Phasing allows the
output to be pointed in different directions without having to move
the antennas themselves.
For anyone familiar with the works of
Tom Bearden, phased arrays
also allow for partial phase conjugation or canceling of the emitted
electromagnetic waves. When EM waves have either (or both) of their
electric and magnetic components cancelled, the contained energy
takes the form of a longitudinal / potential / scalar /
gravitational / temporal wave instead.
Ionospheric heaters can also “control electron density gradients and
the refractive properties in selected regions of the ionosphere”
meaning it can modulate ionospheric electron density. That is
another powerful method of generating longitudinal waves, using the
sky itself as a giant longitudinal antenna.
And so phased arrays can be used to generate an entirely different
type of radiation, one that cannot be detected with standard EM-measuring
instruments.
Depending on their frequency and type, these waves can
theoretically affect human emotion and biology, influence the
weather, alter tectonic dynamics, and even manipulate our
surrounding hyper-dimensional environment to allow for controlled
invisibility and interdimensional maneuvering of military personnel
and vehicles. In essence, everything that regular electromagnetic
waves cannot really do.
This much I find plausible, that HAARP-like technologies are active
on a level superseding those of regular electromagnetism, and that
this is what HAARP and its sister facilities are really being used
for. It is nothing the public knows about or can comprehend because
this technology uses an expanded kind of physics of which only a
small and sterilized subset comprises mainstream college textbooks.
But it can be figured out if you have a physics background and study
the implications and applications of force-free potential fields.
Weather
Manipulation
Now let’s look at some potential correlations between notable
weather events and when HAARP was active. Its activity can be read
from the
waterfall chart published on the HAARP website.
According
to the site:
This chart is a waterfall plot of the readings taken by the Spectrum
Monitor for the last 36 hours. The vertical axis is the frequency,
ranging from 1 - 30 Mhz and the horizontal axis is the UTC time.
Spectrum samples are taken every few minutes.
The color indicates
intensity of received signal at each frequency, ranging from deep
blue for the weakest signals to red, yellow and white for the
strongest signals.
HAARP activity is indicated by sharply defined patterns on the
waterfall chart, like the slots on a piano roll or stripes on a
spectrograph. There is also background noise in the charts, but
those are more diffuse.
What matters is the sharp patterns, their
presence, sequence, when they start and stop.
Hurricane
Katrina - August 23-30, 2005
HAARP was highly active in the weeks before Katrina, during, and a
short time after. The correlation is therefore not complete. If HAARP were inactive during that time, then it could be proven that
it had absolutely nothing to do with Katrina, but since it was
indeed active, a possible link still remains.
August 22 - Remnants of Tropical
Depression Ten move into position.
August 23 - Remnants form into Tropical Depression Twelve.
August 24 - Depression strengthens and is renamed Tropical Storm
Katrina.
August 25 - Katrina strengthens and becomes Category 1 hurricane
and strikes southeast Florida.

August 26 - Katrina weakens to tropical storm, exits on the west
side of Florida into warm waters, then re-intensifies into a
Category 1 hurricane. It rapidly gains strength.

August 27 - Katrina reaches the central Gulf and becomes a large
and well-organized Category 3 hurricane.

August 28 - Katrina comes within a few hundred miles off the
coast and grows to Category 4 early in the day, then to Category
5 by midday.

August 29 - Katrina makes landfall with 155 mph winds.

August 30 - Katrina weakens to a heavy storm affecting Tennessee
and surrounding areas.

Sources:
Wikipedia
and
National Geographic
Hurricane Ophelia - September 8-16, 2005
Hurricane Ophelia never got past Category 1.
But it had a highly
erratic, meandering pathway including a clockwise loop halfway
through (September 10-12).
Forecasters had a tough time predicting its path and behavior.
The hurricane formed on September 8, slipping in and out of
hurricane status several times before fizzling out on September
16 and moving into the North Atlantic.


Sources:
Wikipedia and
Palm Beach Post
This chart compares HAARP activity with
Ophelia’s wind speed:
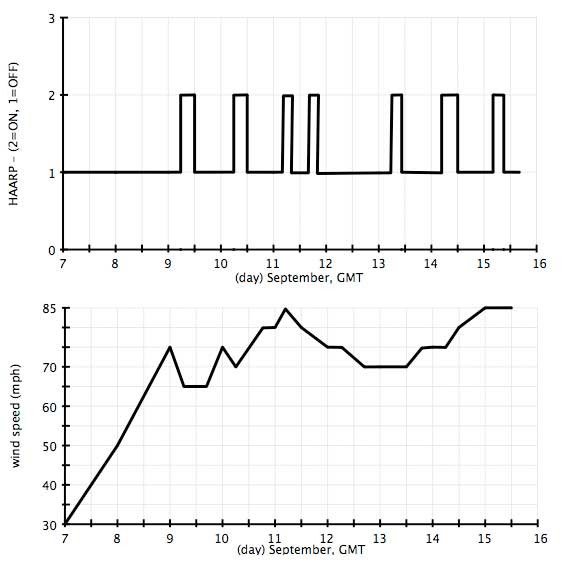
If HAARP had anything to do with this,
it would more likely have been for testing hurricane steering.
2006 and 2007
The two years following Katrina had very quiet hurricane seasons
compared to what was predicted.
2006 Hurricane Forecast a Flop
MIAMI (AP - Dec 2006) - The mild 2006 Atlantic hurricane season
draws to a close Thursday without a single hurricane striking the
United States - a stark contrast to the record-breaking 2005 season
that killed more than 1,500 people and left thousands homeless along
the Gulf Coast.
Nine named storms and five hurricanes formed this season, and just
two of the hurricanes were considered major. […]
In May, scientists predicted 13 to 16 named storms and eight to 10
hurricanes, with four to six of them major. […]
Bell urged people not to become complacent about the next season
(2007), which starts June 1. Forecasters say the Atlantic is still
in an active hurricane period that began in 1995 and could last
another decade or more. (source)
Very Active
2007 Hurricane Season Predicted
ScienceDaily (Apr. 3, 2007)
- The U.S. Atlantic basin will likely
experience a very active hurricane season, the Colorado State
University forecast team announced today, increasing its earlier
prediction for the 2007 hurricane season.
The team’s forecast now anticipates 17 named storms forming in the
Atlantic basin between June 1 and Nov. 30. Nine of the 17 storms are
predicted to become hurricanes, and of those nine, five are expected
to develop into intense or major hurricanes (Saffir/Simpson category
3-4-5) with sustained winds of 111 mph or greater. (source)
2007 Hurricane
Season Ending Raises Forecast Concerns
National Geographic (November 30, 2007) - The 2007 Atlantic
hurricane season, which officially ends today, has - like last
year - failed to live up to the predictions of forecasters.
Now some experts fear the second year of inaccurate preseason
predictions will shake the public’s faith in all hurricane
forecasts - even when a storm is bearing down upon them. (source)
Compared to a prediction of 17 storms, 9 of those hurricanes, and 5
major hurricanes, 2007 instead ended with 15 storms, 6 hurricanes,
and 2 major ones.
So compared to forecasts, 2007 and 2006 were
surprisingly calm.
Hurricane Bertha
Recently the first hurricane of the 2008 season formed.
Big Bertha - A
Bad Omen?
Washington Post (July 8, 2008)
- After explosive development
yesterday, Hurricane Bertha is struggling today. Its maximum winds
have dropped from 120 mph last night to 105 mph as of 11 a.m. and it
has been downgraded to a category two storm. […]
While it remains to be seen whether Bertha will affect any land
areas, it will go down in history as a record-breaking storm and may
be a harbinger of a very active hurricane season. […]
Bertha easily
broke the record for becoming the furthest east named storm prior to
August 1. (source)
Hurricane Bertha “One for the Record Books”
The Daily Green (July 9, 2008)
- From the start, there was something
pretty odd about Hurricane Bertha.
The storm formed just before Independence Day last week, and
immediately showed plenty of it. Bertha developed from a tropical
wave almost immediately as the disturbance came off the coast of
Africa, and so became the most easterly forming July tropical storm
known to us, as well as the most easterly forming Atlantic tropical
storm period. […]
As Bertha moved steadily westward, she intensified, first becoming a
hurricane and then exploding into a powerful Category 3 major
hurricane Monday with 120 mile per hour winds - and possibly, for a
brief while, a Category 4.
It’s the earliest we’ve seen such an
intense Atlantic hurricane since the year 2005, when hurricanes
Dennis and Emily were Category 4 and 5 storms, respectively, in
July. Dennis reached Category 4 strength on July 7 of that year …
the same day on which Bertha exploded three years later.
That’s a particularly worrisome precedent because in 2005, the
hurricane year only got worse after Dennis - featuring Category 5s
Katrina, Rita, and Wilma.
But perhaps even more worrisome is this recent appearance of very
intense hurricanes in July, a month that traditionally has not
featured many of them.
Says Holland:
“It is notable that we have had
a remarkable run of July storms, which over the past decade have
been running more than 50% above the previous average.”
Technically,
given her origins so close to the African coast, Bertha is
categorized as a Cape Verde-type hurricane, and those tend to be the
most powerful and destructive of them all.
But they don’t generally
form until later in the hurricane season … or, at least, that’s how
it used to be. (source)
The most important feature of this hurricane was how rapidly it grew
on July 7 before weakening just as quickly.
At sunrise it was
Category 1, and within twelve short hours Bertha had grown into a
Category 3 (possibly 4) hurricane. Something unusual happened just
on that afternoon.
Here are the HAARP charts before, during, and
after this event:
Notice that the only significant activity occurs during a short
window of time.
The July 7 chart shows HAARP was active between
16:25 and 17:25 UTC - between 12:25 PM and 1:25 PM Eastern Time
- on
that same Monday afternoon when Bertha suddenly became Category 3.
HAARP was not active before or after that event, and likewise Bertha
was not as strong before or after. Bertha faded out afterwards. The
correlation there is complete.
If HAARP was responsible for manipulating Hurricane Bertha, then the
fact that it happened so quickly and nothing destructive ultimately
came of it indicates a test or practice run. And with news of Bertha
being a record-breaking hurricane foreshadowing an ominous hurricane
season, the stage is set for an orchestrated hurricane disaster this
fall.
An opportune target, considering current political and
economic conditions, would be the gasoline refineries surrounding
Houston, Texas.
Update - July
15
HAARP went active July 14-15, coinciding once
again with Bertha (just a strong storm now) strengthening suddenly.
Sunday July 13 - no activity.

Monday July 14 - HAARP goes active between 10:00
- 22:30 UTC (6 AM - 6:30 PM Eastern).

“After looking rather anemic early
Monday morning …Bertha’s ‘convection’ erupted during the day
along with the storm also getting more symmetrically and solidly
organized by late afternoon. […]”
“From the southwest edge of the eye, near the radar site, to the
northeast edge, was just a hair under 150 kilometers (the rings
are spaced every 50 km), or about 90 miles. I don’t know if
there’s an official “record” for eye diameter, but I can’t
offhand remember ever seeing any that have been bigger than
that.” (source)

Tuesday July 15 - “From the National Hurricane Center: BERTHA IS NOW
THE LONGEST-LIVED JULY TROPICAL STORM IN ATLANTIC” (source)
Bertha had been weakening for days leading up to July 14, while
HAARP had been quiet for that same period of time. Then HAARP turned
on, and Bertha rapidly gained strength. Further, it gained strength
at precisely the right moment to hit Bermuda the hardest.
Together
with the July 7 charts, this makes a very strong case that Bertha’s
sudden strength gains are linked to HAARP.
Myanmar Cyclone and China’s 2008 Earthquake
Both the cyclone that hit Burma and the earthquake that struck China
tightly coincided with the same HAARP activity period.
Cyclone Nargis was the worst natural disaster to hit Burma in
recorded history, killing at least 85,000 people.
The China
earthquake led to the deaths of at least 80,000 people.
HAARP activity began at 5:45 UTC on April 27, 2008.

“In the last week of April 2008, an
area of deep convection persisted near a low-level circulation
in the Bay of Bengal about 1150 km (715 mi) east-southeast of
Chennai, India.”
“On April 28 Nargis became nearly stationary while located
between ridges to its northwest and southeast. That day the JTWC
upgraded the storm to cyclone status, the equivalent of a
minimal hurricane on the Saffir-Simpson hurricane scale.”

“Early on April 29, the JTWC estimated Nargis reached winds of
160 km/h (100 mph), and at the same time the IMD classified the
system as a very severe cyclonic storm. […]
By late on April 29,
convection had begun to rebuild, though immediate restrengthening was prevented by increased wind shear”


“On May 1, after turning nearly due eastward,
Cyclone Nargis
began rapidly intensifying, due to greatly improved outflow in
association with an approaching upper-level trough.
Strengthening continued as it developed a well-defined eye with
a diameter of 19 km (12 mi), and early on May 2 the JTWC
estimated the cyclone reached peak winds of 215 km/h (135 mph)
as it approached the coast of Burma, making it a category 4
storm.”

“Around 1200 UTC on May 2, Cyclone Nargis made landfall in the
Ayeyarwady Division of Burma at peak strength. The storm
gradually weakened as it proceeded east over Burma, with its
proximity to the Andaman Sea preventing rapid weakening.
Its
track turned to the northeast due to the approach of a
mid-latitude trough to its northwest, passing just north of
Yangon with winds of 130 km/h (80 mph).”

“Early on May 3 the IMD issued its final advisory on the storm.
It quickly weakened after turning to the northeast toward the
rugged terrain near the Burma-Thailand border, and after
deteriorating to minimal tropical storm status, the JTWC issued
its last advisory on Nargis.” (source)
After Nargis, HAARP continued operating
for another week:
HAARP ceased activity at 22 UTC on May 11, 2008.
The China
earthquake struck a little more than eight hours later at 6:28 UTC
on May 12. In the days and minutes before the quake, there were
reports of strange phenomena including
bizarre toad behavior and
iridescent clouds. Earthquakes are typically “in the works” days or
weeks before going off, and animals, sensitive people, and
scalar
detectors can sense the nonphysical precursors to these quakes.
One has to wonder, if earthquakes generate and are preceded by
scalar waves, could scalar waves likewise trigger earthquakes? If
so, the phased array of various ionospheric heaters around the world
may be capable of doing this for political and military purposes.
The quake was certainly convenient for western military factions:
Earthquake
Destroyed China’s Largest Military Armory, Says Source
A high-level Chinese military source secretly disclosed last week
that the recent earthquake in Sichuan Province caused a
chain-reaction of explosions in the Sichuan mountain areas. The
explosions destroyed Chinese army’s largest armory, new weapon test
bases and part of nuclear facilities including several nuclear
warheads. This information is considered China’s top military
secret. […]
After carefully analyzing seismic data, military experts in
southeast Asia confirmed a non-geological shock had occurred at the
earthquake epicenter. The energy released was equivalent to that of
an underground nuclear explosion.
There is not enough actual energy being outputted by ionospheric
heaters to directly power an earthquake, but they don’t need that
much power if they merely act as nonlinear imbalancers, triggers, or
redirectors of existing large natural energy flows.
Was the earthquake just a random natural event? Or was it
strategically and intentionally created?
Consider this:
-
The official death toll was 80,000.
-
HAARP shut off ~8 hours before the quake struck.
-
Earthquake was of magnitude 8.0.
-
It happened on May 12th (5/12 = 5 + 1 + 2 = 8).
-
The earthquake occurred exactly 88 days before the Beijing Olympics.
-
The Olympics will begin on 8/8/08 at 8:08 PM.
Coincidence?
|