|
This sudden, anomalous, and inexplicable change in ocean surface temperature has left scientists who support the climate change theory baffled because it doesn't support the conclusions of their current ocean climate models.
Inexplicably, those advocating the validity of the climate change theory have stuck to their idea that all significant changes in ocean temperature are due to increases in human activity.
Here we show that the only plausible explanation for this dramatic temperature increase in ocean temperature is massive pulses of heat emitted from ocean floor geological features (see here, here, and here).
Perspective of Earth's Oceans
Before presenting evidence that supports the contention that heat emitted from seafloor geological features is the cause and/or major contributor to the recent and very anomalous increase in ocean temperature, we must take time to put into perspective ocean area, volume, and depth.
And to look at the historical increase in the Earth's sea surface temperature.
The area of the Earth's oceans is 139,382,879 square miles, which represents 71% of Earth's surface, has a volume of 10,907,411,982 cubic miles, and weighs 1,450,000,000,000,000,000 tons.
Bottomline:
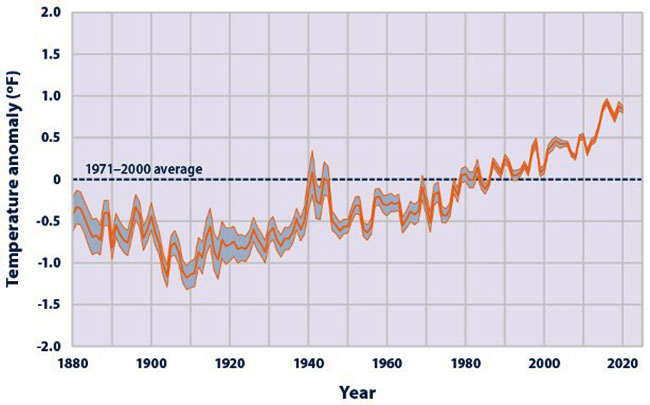
Ocean temperatures between 1880-2010, a 130 period, have steadily and not anomalously risen two degrees Fahrenheit equating to 0.2 degrees Fahrenheit per year (Figure 1).
This moderate and steady increase in temperature doesn't fit into the notion that anthropogenic forces are the cause of the recent changes in ocean surface water.
Figure 1. Increase of ocean surface waters from 1880 to 2020. (Graph credit EPA)
Atlantic Ocean Warming
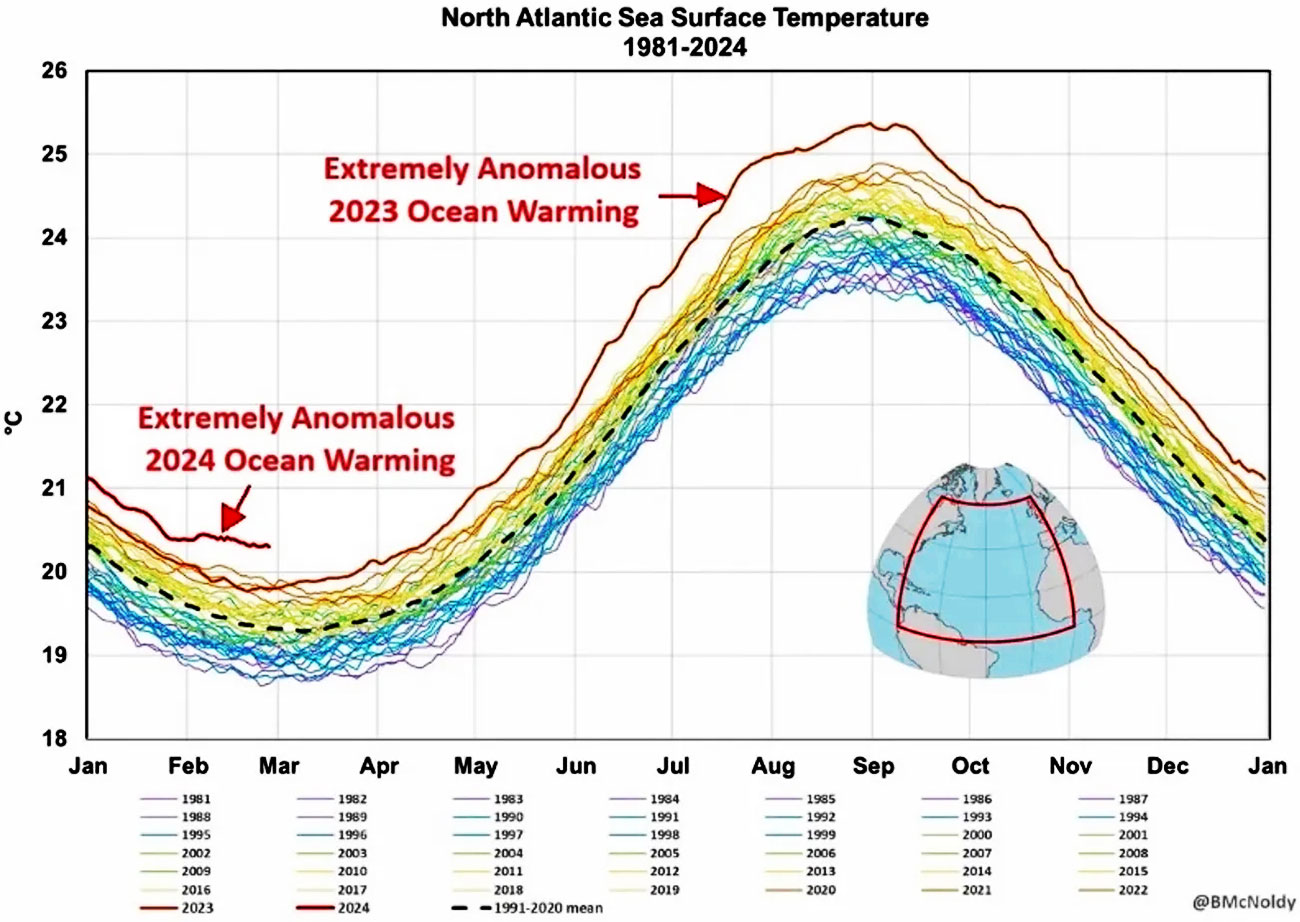
The Figure 2 graph illustrates the monthly and yearly temperatures in the North Atlantic Ocean surface waters from 1981 to 2024.
It shows that beginning in 2023 and through the first three months of 2024 the surface temperature of the North Atlantic Ocean surface experienced an extremely anomalous warming event.
Figure 2. This graph shows the monthly temperature changes in the North Atlantic Ocean's surface waters for the years from 1981 to 2024. Graph credit Creative Commons and NOAA
The following quote is taken from a research study that describes the temperature change in greater detail.
Via Vox:
I am certain that the increase in North Atlantic Ocean surface temperature waters is the result of heat emitted from its hundreds of thousands of active ocean floor geological features...
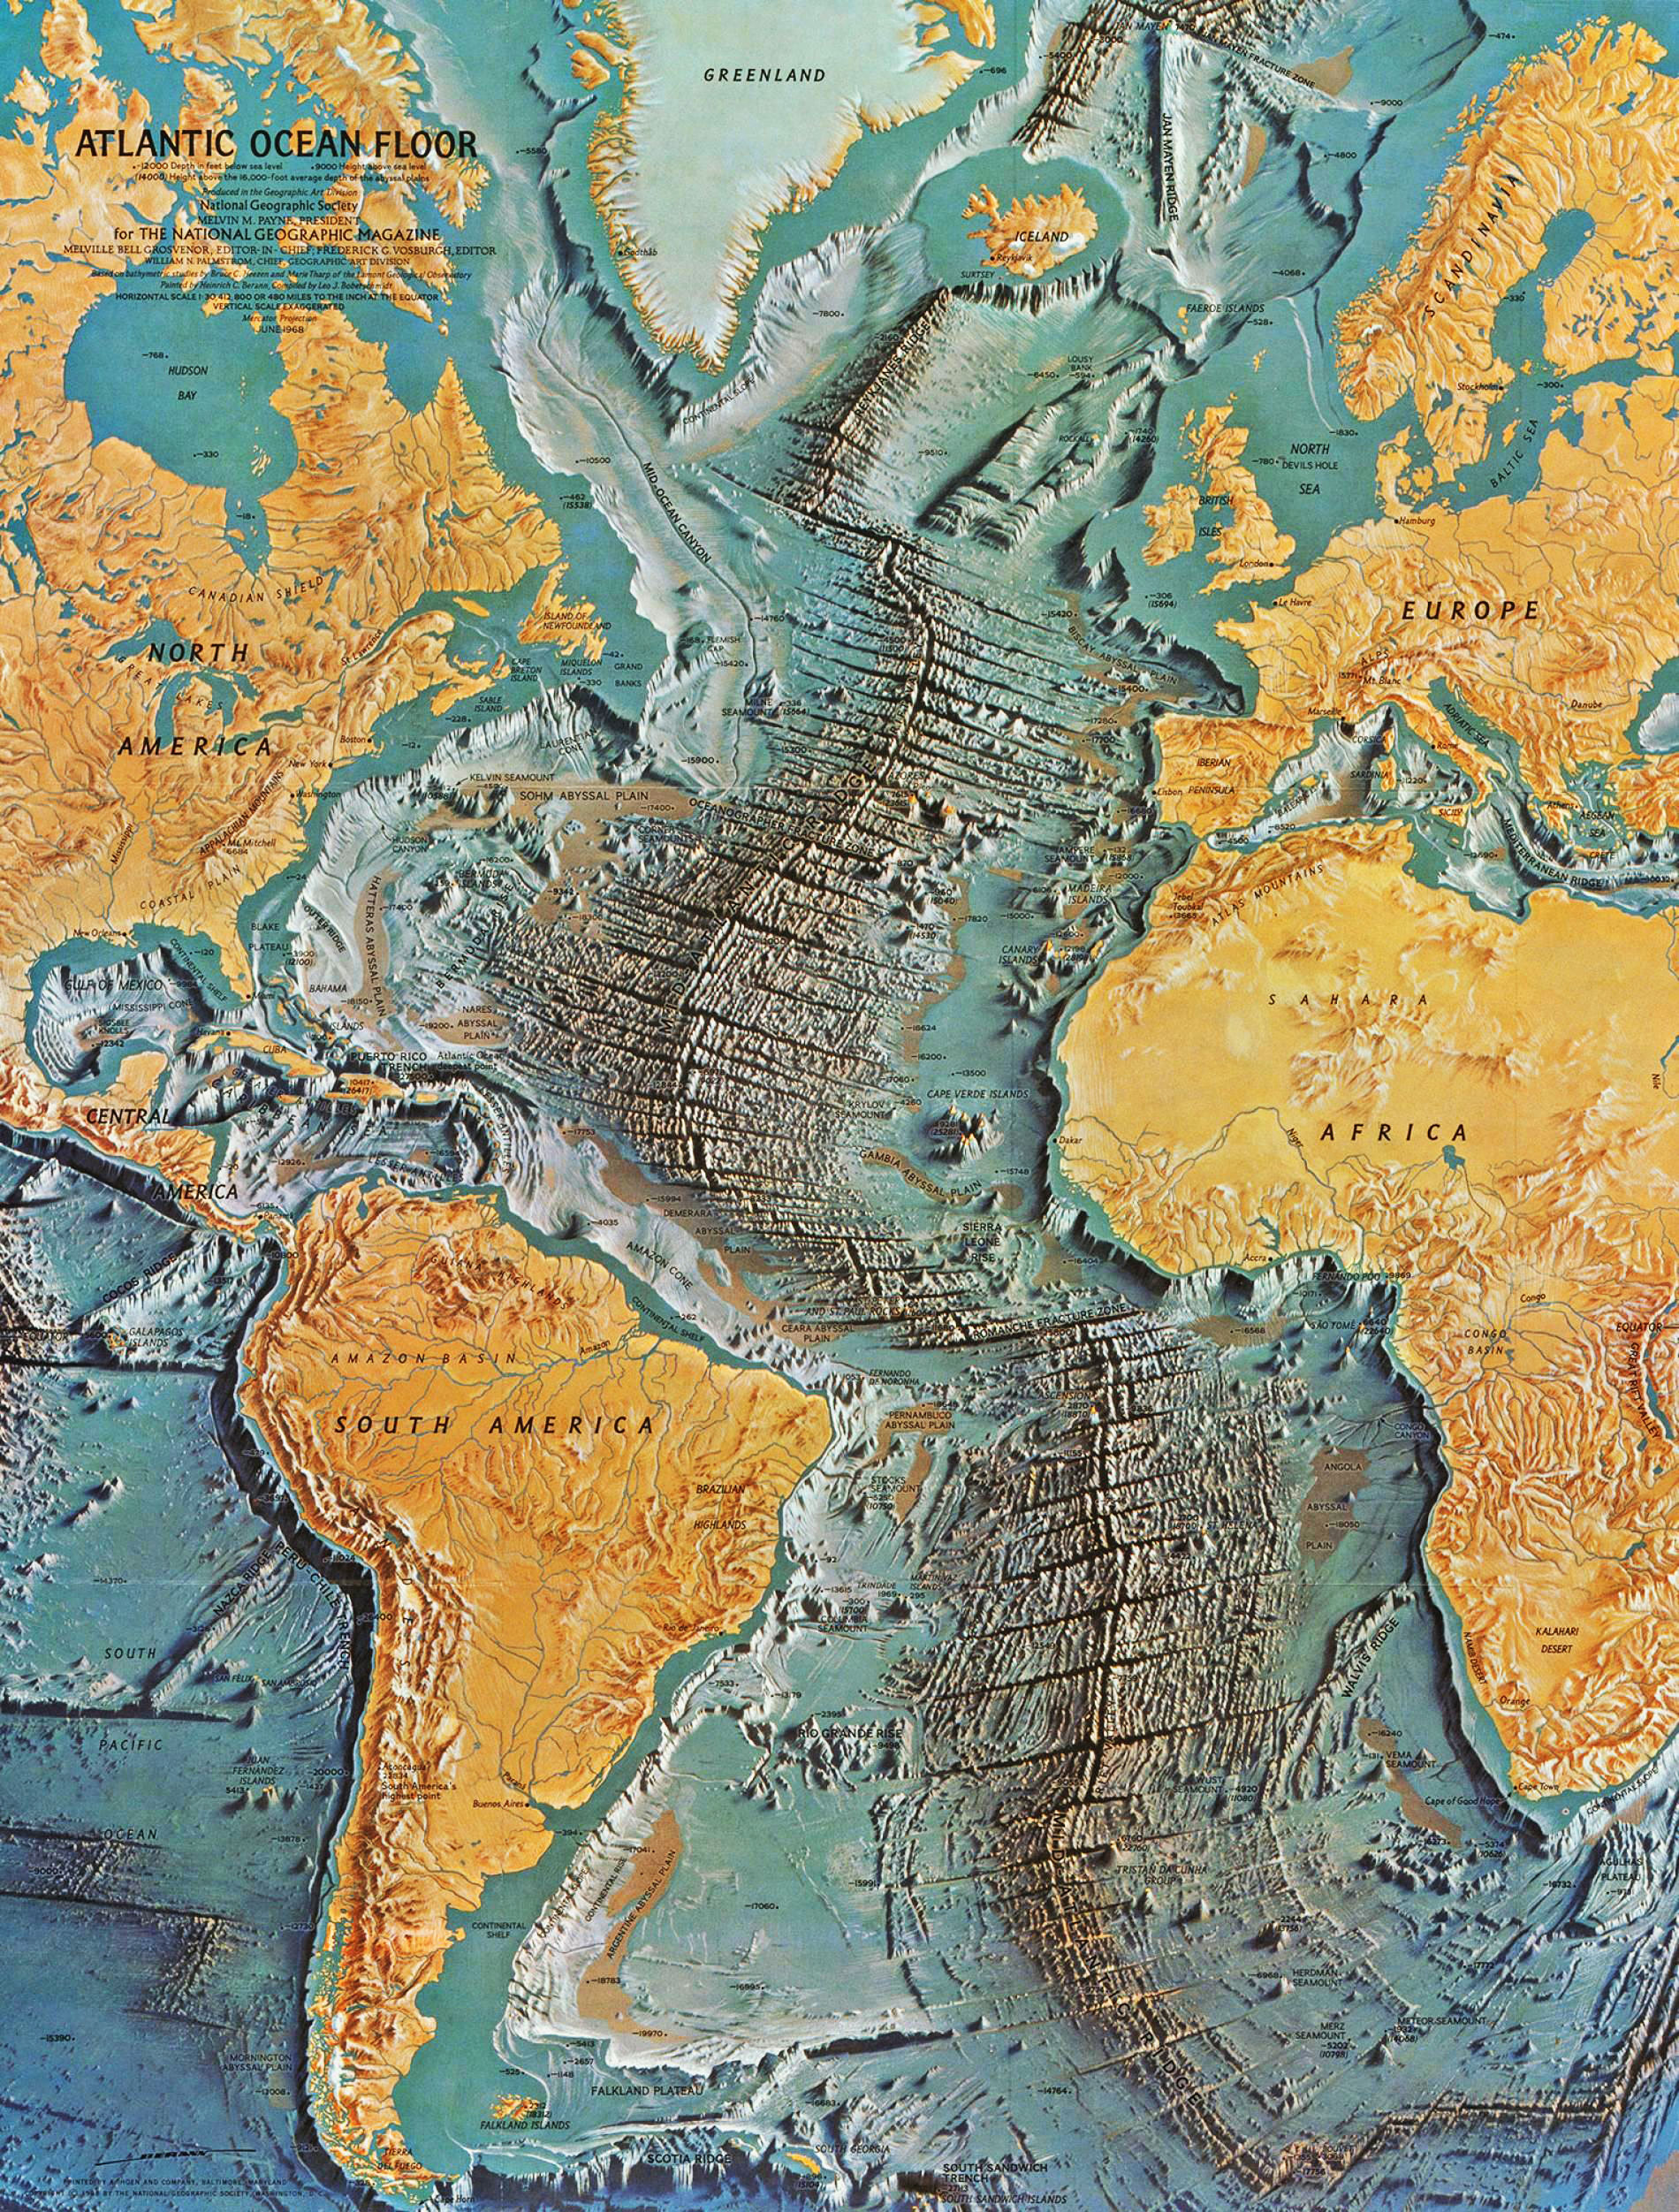
Features that are generated, fueled, maintained, and associated with the North Atlantic Ocean floor Pull Apart / Divergent Fault System (Figure 4).
The system is 25,000 miles long and on average 1,000 miles wide.
When the northern segment of the fault system suddenly becomes very active it allows unimaginable amounts of deep inner Earth molten lava to upwell along the main fault plane.
Eventually, the lava reaches the ocean floor where it emits enough heat to increase the temperature of the North Atlantic's entire ocean column including the surface waters (see here).
Figure 3. Atlantic Ocean floor Pull Apart Fault System. The axis of the axis of Pull Apart Fault is shown as a thick red line. The direction of pull apart direction shown by red arrows
Pacific Ocean Warming
Similar to the North Atlantic Ocean's extreme, a sudden and anomalous increase in the temperature of surface waters in the central Pacific Ocean has also experienced a significant increase in temperature during the last 12 months.
Even though this increase hasn't been the same amount as the increase in surface waters of the North Atlantic Ocean it is still very anomalous.
The anomalous temperature increase of the central Pacific Ocean surface waters,
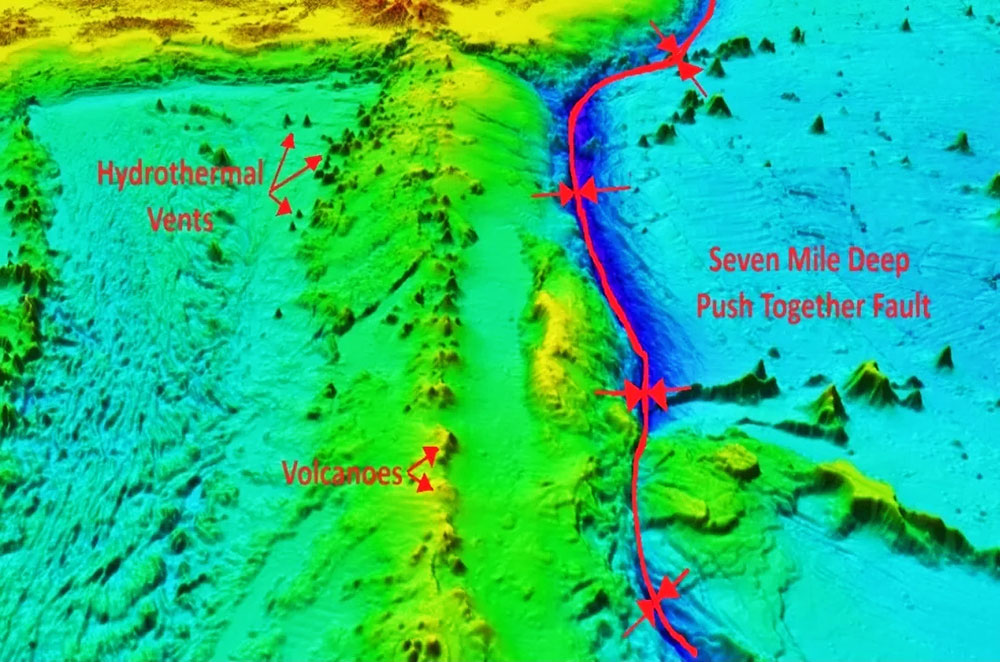
Figure 4. Segment of the Pacific Ocean floor seven-mile-deep push together/divergent fault system and associated hydrothermal vents, volcanoes, and minor faults. (Image Credit Pinterest)
This fault system is called the Pacific Ring of Fire.
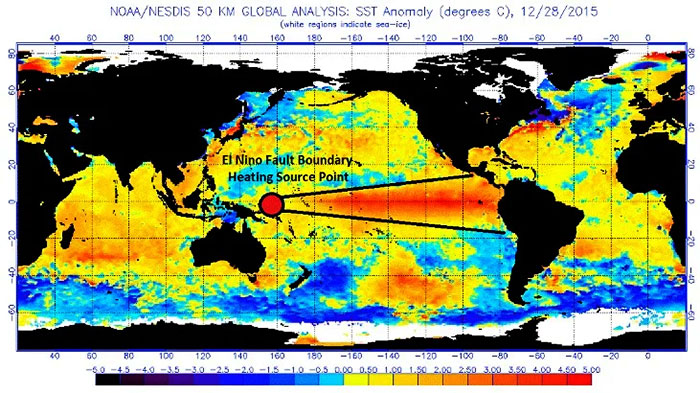
All El Niño originate from one point along the Pacific Ring of Fire (Figure 5)
Figure 5. El Niño emit tremendous amounts of heat into the central part of the Pacific Ocean. Image credit NOAA
It may amaze you to know that climatologists and Oceanographers don't know what generates El Niño.
Attempting to decipher what force or forces generate and maintain El Niño they have used the vast amounts of atmospheric and oceanic data available to them.
Utilizing this data scientists have said,
They don't say,
Since 2014 I have written many articles integrating information from numerous research studies with my observations and ideas.
This has convinced me that El Niño are generated by heat emissions from ocean floor hydrothermal vents and volcanoes, and positioned at a fixed/nonmoving "source point".
A source point that is part of the Pacific Ring of Fire (Figure 5).
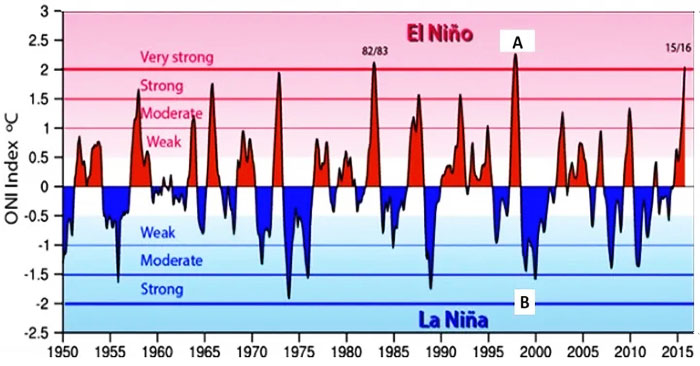
Here are a few of my articles that have been posted on Climate Change Dispatch, A super strong and high-temperature El Niño began on July 4, 2023, and only now have sea surface temperature (SST) anomalies begun weakening across most of the equatorial Pacific Ocean, with La Niña potentially developing during summer 2024.
This El Niño event was preceded by a triad of La Niña cool phases that began in 2020 and ended in 2023.
It shows that the energy needed to go from a very strong La Niña to a very strong El Niño is off the charts. This energy conversion cannot be explained by heat emitted from human activities (Figure 6).
Figure 6. Temperature change from a strong La Niña to a strong El Niño as shown in the "A" to "B" on the graph above. Image credit Earth and Sky and Public Domain
Conclusion
Scientists who support the human-caused climate change theory are having a very difficult time explaining an extremely large temperature increase in Earth's surface temperatures.
This is because their climate models don't accurately represent this change.
They have stated that this change is the result of human-made forces.
However, the most plausible alternative explanation for these changes is,
Video
|