|
by Christopher Monckton of Brenchley
01 December 2009
from
ScienceAndPublicPolicy Website

THE WHISTLE BLOWS FOR
TRUTH
The whistleblower deep in the basement of one of the ugly, modern
tower-blocks of the dismal, windswept University of East Anglia
could scarcely have timed it better.
In less than three weeks, the world’s governing class - its classe
politique - would meet in Copenhagen, Denmark, to discuss a treaty
to inflict an unelected and tyrannical global government on us, with
vast and unprecedented powers to control all once-free world markets
and to tax and regulate the world’s wealthier nations for its own
enrichment:
in short, to bring freedom, democracy, and prosperity to
an instant end worldwide, at the stroke of a pen, on the pretext of
addressing what is now known to be the non-problem of manmade
“global warming”.
The unnamed hero of ‘Climategate’, after months of work gathering
emails, computer code, and data, quietly sent a 61-megabyte
compressed file from one of the university’s servers to an obscure
public message-board on the Internet, with a short covering note to
the effect that the climate was too important to keep the material
secret, and that the data from the University would be available for
a short time only.
He had caught the world’s politico-scientific establishment
green-handed.
Yet his first attempts to reveal the highly-profitable
fraud and systematic corruption at the very heart of
the United Nations’s
climate panel and among the scientists most prominent in influencing
its prejudiced and absurdly doom-laden reports had failed.
He had made the mistake of sending the
data-file to the mainstream news media, which had also profited for
decades by fostering the “global warming” scare, and by generally
denying anyone who disagreed with the official viewpoint any
platform.
The whistleblower’s data file revealed, for the first time, the
innermost workings of the tiny international clique of climate
scientists, centered on the Climate Research Unit at East Anglia,
that has been the prime mover in telling the world that it is
warming at an unprecedented rate, and that humankind is responsible.
REVEALED - THE
ABJECT CORRUPTION OF CLIMATE SCIENCE
The gallant whistleblower now faces a police investigation at the
instigation of the University authorities desperate to look after
their own and to divert allegations of criminality elsewhere.
His crime? He had revealed what many had
long suspected:
-
A tiny clique of politicized
scientists, paid by unscientific politicians with whom they
were financially and politically linked, were responsible
for gathering and reporting data on temperatures from the
palaeoclimate to today’s climate. The “Team”, as they called
themselves, were bending and distorting scientific data to
fit a nakedly political story-line profitable to themselves
and congenial to the governments that, these days, pay the
bills for 99% of all scientific research.
-
The Climate Research Unit at
East Anglia had profited to the tune of at least $20 million
in “research” grants from the Team’s activities.
-
The Team had tampered with the
complex, bureaucratic processes of the UN’s climate panel,
the IPCC, so as to exclude inconvenient scientific results
from its four Assessment Reports, and to influence the
panel’s conclusions for political rather than scientific
reasons.
-
The Team had conspired in an
attempt to redefine what is and is not peer-reviewed science
for the sake of excluding results that did not fit what they
and the politicians with whom they were closely linked
wanted the UN’s climate panel to report.
-
They had tampered with their own
data so as to conceal inconsistencies and errors.
-
They had emailed one another
about using a “trick” for the sake of concealing a “decline”
in temperatures in the paleoclimate.
-
They had expressed dismay at the
fact that, contrary to all of their predictions, global
temperatures had not risen in any statistically-significant
sense for 15 years, and had been falling for nine years.
They had admitted that their inability to explain it was “a
travesty”. This internal doubt was in contrast to their
public statements that the present decade is the warmest
ever, and that “global warming” science is settled.
-
They had interfered with the
process of peer-review itself by leaning on journals to get
their friends rather than independent scientists to review
their papers.
-
They had successfully leaned on
friendly journal editors to reject papers reporting results
inconsistent with their political viewpoint.
-
They had campaigned for the
removal of a learned journal’s editor, solely because he did
not share their willingness to debase and corrupt science
for political purposes.
-
They had mounted a venomous
public campaign of disinformation and denigration of their
scientific opponents via a website that they had expensively
created.
-
Contrary to all the rules of
open, verifiable science, the Team had committed the
criminal offense of conspiracy to conceal and then to
destroy computer codes and data that had been legitimately
requested by an external researcher who had very good reason
to doubt that their “research” was either honest or
competent.
The Nature
‘Trick’ To ‘Hide The Decline’ In Temperatures
Among the most revealing of the emails
released to the world by the whistleblower was one dated November
1999.
In that email, Professor “Phil” Jones of the CRU wrote to
Michael Mann, Raymond Bradley and Malcolm Hughes, the authors of the
infamous “hockey stick” graph that falsely abolished the medieval
warm period:
“I’ve just completed Mike’s Nature
trick of adding in the real temps to each series for the last 20
years (ie from 1981 onwards) and from 1961 for Keith’s to hide
the decline.”
Almost immediately after the news of
Climategate broke, Professor Jones told Investigative Magazine’s TGIF Edition that he “had no idea” what he might have meant by the
words “hide the decline”.
He said:
“They’re talking about the
instrumental data which is unaltered - but they’re talking about
proxy data going further back in time, a thousand years, and
it’s just about how you add on the last few years, because when
you get proxy data you sample things like tree rings and ice
cores, and they don’t always have the last few years. So one way
is to add on the instrumental data for the last few years.”
A few hours later, the science
hate-crime website created by the Team cobbled together a jumbled,
snivelingly self-serving, and entirely different pretext:
“The paper in question is the Mann,
Bradley and Hughes (1998) Nature paper on the original
multiproxy temperature reconstruction [the ‘hockey-stick’ graph
of pre-instrumental temperatures over the past 1000 years in the
Northern Hemisphere], and the ‘trick’ is just to plot the
instrumental records along with reconstruction so that the
context of the recent warming is clear.
Scientists often use the term
“trick” to refer to “a good way to deal with a problem”, rather
than something that is “secret”, and so there is nothing
problematic in this at all.
As for the ‘decline’, it is well
known that Keith Briffa’s [another prominent member of the Team]
maximum latewood tree ring density proxy diverges from the
temperature records after 1960 (this is more commonly known as
the “divergence problem”... and has been discussed in the
literature since Briffa et al. in Nature in 1998 (Nature, 391,
678-682).
Those authors have always recommend
not using the post-1960 part of their reconstruction, and so,
while ‘hiding’ is probably a poor choice of words (since it is
‘hidden’ in plain sight), not using the data in the plot is
completely appropriate, as is further research to understand why
this happens.”
Steve McIntyre, the one who had
first realized that
the United Nations’s climate panel in 2001 had used a
corrupt graph that had falsely abolished the medieval warm period
with the aim of pretending that today’s global temperatures are
unprecedented in at least 1000 years.
Later that day his website,
www.climateaudit.org, revealed the
truth about the conspirators’ “trick”.
In order to smooth a data series over a given time period, one must
pad it with artificial data beyond the endpoint of the real series.
However, when Mann, Bradley, and Hughes plotted instrumental data
against their reconstructions based on the varying widths of
tree-rings from ancient trees, their favorite form of proxy or
pre-instrumental reconstructed temperature, no smoothing method
could conceal the fact that after 1960 the tree-ring data series
trended downward, while the instrumental series trended upward.
This was the Team’s “divergence”:
“So Mann’s solution [‘Mike’s Nature
trick’] was to use the instrumental record for padding [both the
proxy and the instrumental data series], which changes the
smoothed series to point upwards.”
Accordingly, though the author of the
original email had said that the “trick” was to add instrumental
measurements for years beyond available proxy data, his conspirators
at the science-hate website admitted it was actually a replacement
of proxy data owing to a known but unexplained post-1960
“divergence” between the proxy data and the instrumental data.
In fact, it was a fabrication.
The next day, in a statement issued by the University of East
Anglia’s press office, Professor Jones fumblingly tried to recover
the position:
“The word 'trick' was used here
colloquially as in a clever thing to do. It is ludicrous to
suggest that it refers to anything untoward.”
As we shall see, Professor Jones was
not
telling the truth.
BREAKING THE
BROKEN CODE - DISSECTING THE DODGY DATA
The “Documents” folder in the enormous data-file released by the
whistleblower contains many segments of computer program code used
by Jones and the Team in contriving the Climate Research Unit’s
global temperature series.
The data-file also contained a
15,000-line commentary by programmers concerned that the code and
the data used by the Team were suspect, were fabricated, and were
not fit for their purpose.
Looking at the seldom-tidy code, the sheer number of programs which
subject the raw data to various degrees of filtering, processing,
and tampering is disconcerting.
Some of these alterations were
blatant and unacceptable, notably those which removed proxy data
that correlate poorly with measured regional temperature, or even
replaced proxy data altogether with measured data to conceal a
discrepancy between what the proxy data actually showed and what the
Team wanted it to show.
The Team’s programmers even admitted, in comments within the code,
that they were artificially adjusting or “correcting” the proxy data
from tree-rings.
In Fortran, the high-level computer language long
in use at universities for programming, a programmer’s comment is
usually preceded by the statement “REM” for “remark”, indicating
that the text on the line following the word “REM” should be ignored
by the compiler program that translates the Fortran code that humans
can understand into executable machine language that the computer
can understand.
One of the commonest remarks included in the program fragments
disclosed by the whistleblower is as follows:
“REM Uses ‘corrected’ MXD [proxy
data from tree-rings] - but shouldn't usually plot past 1960
because these will be artificially adjusted to look closer to
the real temperatures.”
“These will be artificially adjusted to look closer to the real
temperatures.”
There could scarcely be a plainer
admission that the data are being regularly, routinely, materially
tampered with, for the sake of making it appear that the proxy data
are sufficiently reliable to appear close to the instrumental
temperatures.
This is no mere debating point. The UN’s climate panel had issued
specific warnings against using proxy data (MXD) from tree-rings,
because warmer weather is not the only reason why tree-rings become
wider in some years than in others.
There are at least two other
prominent reasons, both of which can - and do - distort the
tree-ring data beyond the point where they are useful as indicators
of (or proxies for) pre-instrumental temperatures.
-
First, the tree-rings become
wider whenever the weather becomes wetter.
-
Secondly, and of still greater
concern, the tree-rings widen when there is more carbon
dioxide in the atmosphere.
-
And there is 40% more CO2
in the atmosphere today than there was in 1750.
Yet, as McIntyre and McKitrick had
established originally in 2003, and had published in a leading
journal in 2005, the majority of the data on the basis of which
Mann, Bradley and Hughes, and later other members of the Team, had
attempted to pretend that there had been no medieval warm period
were tree-ring series.
Take out the suspect tree-ring series,
together with just one other rogue series, and all the remaining
data series establish beyond reasonable doubt that the Middle Ages
were truly, materially, and globally warmer than the present.
Scientists with programming knowledge have already begun to examine
the computer code that Professor Jones and his colleagues had
attempted to hide for so long.
Here is Marc Sheppard’s selection of
three examples of the tortuous sequences of deliberate data
tampering that are evident within the program code.
Example 1
‘In subfolder “osborn-tree6mannoldprog” there’s a program (Calibrate_mxd.pro)
that calibrates the MXD data against available local instrumental
summer (growing season) temperatures between 1911 and 1990, then
merges that data into a new file.
That file is then digested and
further modified by another program (Pl_calibmxd1.pro) which creates
calibration statistics for the MXD against the stored temperature
and “estimates” (i.e. infills) figures where such temperature
readings were not available.
The file created by that program is
modified once again by Pl_Decline.pro, which “corrects it” - as
described by the author - by “identifying and “artificially” (the
author’s own word) removing “the decline.” But oddly enough the
series doesn’t begin its “decline adjustment” in 1960 - the supposed
year of the enigmatic “divergence.”
In fact, all data between 1930
and 1994 are subject to “correction.”’
Example 2
‘In two other programs, briffa_Sep98_d.pro and briffa_Sep98_e.pro,
the “correction” is bolder by far.
The programmer (Keith Briffa?)
entitled the “adjustment” routine “Apply a VERY ARTIFICIAL correction
for decline!!” And he/she wasn’t kidding. Now, IDL [a computer
language] is not a native language of mine, but its syntax is
similar enough to others I’m familiar with, so please bear with me
while I get a tad techie on you.
Here’s the “fudge factor” (notice
[he] actually called it that in his REM statement):
‘yrloc=[1400,findgen(19)*5.+1904]
‘valadj=[0.,0.,0.,0.,0.,-0.1,-0.25,-0.3,0.,-
0.1,0.3,0.8,1.2,1.7,2.5,2.6,2.6,2.6,2.6,2.6]*0.75 ; fudge factor
‘These 2 lines of code establish a 20-element array (yrloc)
comprising the year 1400 (base year, but not sure why needed here)
and 19 years between 1904 and 1994 in half-decade increments.
Then
the corresponding “fudge factor” (from the valadj matrix) is applied
to each interval. As you can see, not only are temperatures biased
to the upside later in the century (though certainly prior to 1964)
but a few mid-century intervals are being biased slightly lower.
That, coupled with the post-1930 restatement we encountered earlier,
would imply that in addition to an embarrassing false decline
experienced with their MXD [tree-ring proxies] after 1960 (or
earlier), CRU’s “divergence problem” also includes a minor false
incline after 1930.
And the former apparently wasn’t a particularly
well-guarded secret, although the actual adjustment period remained
buried beneath the surface.’
Note that the words “fudge factor” that we have highlighted in the
code fragment shown in this example actually appear in the code as
released by the whistleblower.
The words follow a semicolon, which,
in IDL and many other computer languages, has the same significance
as a “REM” statement:
it tells the automatic code-compiler to treat
everything between the semicolon and the next line-feed as a
programmer’s remark, and to ignore it rather than trying convert it
to executable code as part of the program.
In short, the programmer
was recording his own admission that he was tampering with the data
by multiplying it by what he himself was calling a “fudge factor”.
No true or honest scientist would apply an undeclared, undisclosed
fudge-factor (which the Climate Research Unit’s programmer actually
called a “fudge-factor”) so as artificially to generate the
“politically-correct” - but scientifically baseless - result.
Example 3
‘Plotting programs such as data4alps.pro print this reminder to the
user prior to rendering the chart:
‘“IMPORTANT NOTE: The data after 1960 should not be used. The
tree-ring density records tend to show a decline after 1960 relative
to the summer temperature in many high-latitude locations. In this
data set this ‘decline’ has been artificially removed in an ad-hoc
way, and this means that data after 1960 no longer represent
tree-ring density variations, but have been modified to look more
like the observed temperatures.”
‘Others, such as mxdgrid2ascii.pro, issue this warning:
‘“NOTE: recent decline in tree-ring density has been ARTIFICIALLY
REMOVED to facilitate calibration. THEREFORE, post-1960 values will
be much closer to observed temperatures then [should be “than”] they
should be which will incorrectly imply the reconstruction is more
skilful than it actually is. See Osborn et al. (2004).'
The true meaning of Professor Jones’ “trick” to “hide the decline”
in the data proxy series from 1960 onwards is all too clear from the
three above examples.
The real purpose of Michael Mann’s Nature
trick (one of the many artifices and devices that the Team had used
in fabricating the graph that had falsely abolished the medieval
warm period) was to,
“incorrectly imply the reconstruction [from the
tree-ring proxies] is more skilful [i.e. accurate as a
representation of pre-industrial temperatures] than it actually is”.
Why does this matter so much?
The reason is that if a “divergence”
or discrepancy exists not merely between the magnitudes but even
between the signs (i.e. the directions, towards warming or cooling)
of measured temperature trends on the one hand, and those derived
from tree-ring proxy data from the 1960s onwards on the other, then
discarding only the post-1960 figures will have the effect of
concealing that, during much of the period when instrumental
temperatures are available to demonstrate the extent to which
parallel tree-ring proxy data for the same period are producing
accurate temperature reconstructions, the tree-ring proxies are
producing flagrantly inaccurate and erroneous temperature
reconstructions.
In short, the tree-ring proxies are no good, as the
UN had long stated, but the “Nature trick” was intended to “hide the
decline” - and did so, until the whistleblower came along.
The very existence of a “divergence” between proxy and instrumental
data covering the same period betrays a potential serious flaw in
the process by which temperatures are
reconstructed from tree-ring densities.
If the relationship between
proxy and instrumental data breaks down beyond a certain date, then
any honest men of science would instinctively question whether the
relationship was sound even before that date.
The entire basis for the Team’s purported abolition of the medieval
warm period, and hence for the UN’s assertion that today’s
temperatures are unprecedented in at least the last 1000 years, was
false.
And the Team’s attempt to “hide the decline” in the tree-ring
proxy data compared with the post-1960 rise in instrumental
global-temperature data, so as to conceal the inadequacy of the
tree-ring proxies on the basis of which it had tried to abolish the
medieval warm period,
was - and there is no other way to put this -
scientific fraud.
MAINSTREAM
MEDIA ARE SILENT, BUT THE INTERNET ROARS
Most of
the world’s news media simply ignored the news about the
decades of organized corruption and outright scientific crime at the
University of East Anglia.
For years, newspapers, television, and
radio had naively and unquestioningly bought into the Team’s
story-line that the world was warming at an unprecedented rate, and
that we are to blame. They were simply not honest enough to change
their tune.
The unspeakable BBC, whose bias on the “global warming” issue now
places its current right to levy a poll-tax on every UK citizen with
a television gravely in question, was as usual the worst offender in
its abject failure to report the content of the whistleblower’s
emails accurately or, until others had broken the story, at all.
The BBC had had a copy of the data for at least a month before the
story broke. But was it the BBC that broke the story? No, it was an
obscure bulletin-board in the United States.
The BBC has been
peddling the extremist line on “global warming” throughout, and its
senior personnel simply no longer possess the objectivity or sense
of journalistic fair play to allow anything on the air that might
seriously question its Stakhanovite orthodoxy.
The BBC sat on the story, presumably in the vain and desperate hope
that no one else would find out about it.
Then, when the story
eventually broke elsewhere, one of the BBC’s dozens of environmental
commentators, a laughable, clownish anti-scientist called Roger Harrabin, immediately posted up a blog entry to say that his
“friends” at the Climate Research Unit had assured him that the
emails and data released by the whistleblower were nothing more than
a storm in a teacup.
Now that we have here revealed a little of what those tainted emails
contained - the BBC, true to form, has still not revealed any of
their damning contents on the air, and probably never will - its
listeners will have some means of judging for themselves whether Harrabin’s “friends” in climate science’s organized crime unit are
telling the truth.
The embarrassment of environmental journalists who had profited as
handsomely as the corrupt scientists by hawking and peddling the
mother of all “we-are-all-guilty” scares was palpable. Most of them
could not bear to report on the affair at all.
Those who did report it -
the BBC being a typical example - were careful not to mention, at
all, any of the information that the whistleblower had revealed.
On the Internet, however, which in some countries - such as Britain
- is now the only independent source of news not controlled or
influenced to the point of endemic bias and irremediably blind
prejudice by the government, the news of the corruption that had
long festered at the Climate Research Unit in the University of East
Anglia and throughout the international scientific community
circulated rapidly.
For decades, national scientific societies, professional groups,
universities, and environmental pressure-groups funded by
questionable sources had made common cause and uncommon profits by
lining up to push the climate scare, without the slightest regard to
whether it was true. Now their corruption, and their criminality,
had been exposed.
Those who had long had reason to suspect the financial and political
links and motives of those chiefly responsible for the climate scare
were understandably angry at what this additional hard evidence
revealed about the sheer scale, reach, and magnitude of the criminal
conspiracy of the scientific and political establishment against the
little guy whose taxes pay for their crimes.
The
website of Steve McIntyre, the diligent researcher who had first
exposed as a fake the Team’s attempt to abolish the medieval warm
period, could no longer handle the traffic when the news of the
scandal at the University of East Anglia broke.
It was Mr. McIntyre
who had repeatedly made requests to the Climate Research Unit, under
the Freedom of Information Act in the UK, for the computer codes and
data that the Team were using to construct - or, as we now know
beyond reasonable doubt, to fabricate - the record of changes in
global mean surface temperature over recent decades.
FREEDOM OF
INFORMATION? WHAT FREEDOM?
One of the many astonishing revelations by the whistleblower is the
exposure of the systematic and ruthless attempts by Professor Jones
and his international colleagues to prevent other scientific
researchers from being able to obtain their program codes and their
temperature data so that their results could be independently
verified.
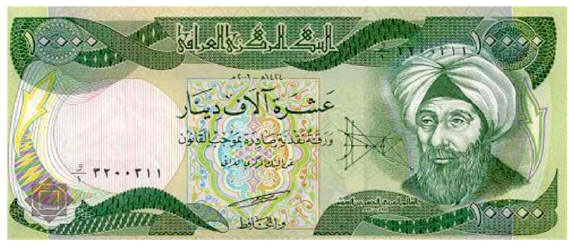
Abu Ali Ibn al-Hassan Ibn al-Hussain Ibn al-Haytham, the
11th-century Iraqi mathematician and natural scientist, wrote a
thousand years ago that,
the “seeker after truth” - his phrase for
the scientist, and how very unlike the pseudo-scientists of the Team
- had an obligation not to believe any consensus, however well
established: instead, it was his duty to check for himself, using
his own hard-won knowledge and skill.
For the road to truth, said
al-Haytham, was long and hard, but, he wrote “that is the road we
must follow.”
For that great statement of scientific principle,
al-Haytham is
rightly celebrated by historians of natural philosophy as the father
of what is now called the “scientific method”, and his signal
contribution to the development of scientific thought is
commemorated on an Iraqi banknote -
10000 dinars Iraqi bank note (2003)
The scientific method was codified by Karl Popper in a landmark
paper of 1934, in which he said that any scientific hypothesis -
such as the hypothesis that the Middle Ages were not, after all,
warmer than the present, or that global temperatures during the 20th
century rose as fast as the Team’s global-temperature datasets were
pretending - followed a repeated, step-by-step process of scrutiny.
-
The first step is the description of a difficulty or gap in
scientific knowledge, which Popper called the “General Problem”. The
problem should be clearly defined, and should be generally accepted
as being a problem that required to be addressed.
-
The second step is the formulation of a hypothesis - a suggested
scientific answer to the General Problem. Popper’s term for the
hypothesis is the “Tentative Theory”. Here, the rules are clear. The
hypothesis must address a definite general problem, and it must be
stated as clearly as possible in the language of science, which is
mathematics.
-
The third step is what Popper called the “Error Elimination” phase.
It is at this step that other scientists examine the General Problem
in the light of the Tentative Theory and consider whether or to what
extent the Tentative Theory has successfully followed the rules of
science and has helped in addressing the General Problem.
It follows
from this crucial step in the scientific method that the hypothesis,
or “Tentative Theory”, must be one that is capable of being tested
and verified by other science: or, as Popper put it, every
hypothesis, if it is to be a genuine hypothesis, must be
“falsifiable”.
There are three possible outcomes from the Error Elimination phase.
-
The first outcome, which is extremely rare, is that the hypothesis
is formally and completely proven. In this special case the
Tentative Theory becomes an established theorem and passes out from
the scientific method into the realm of settled science, along with
propositions such as Pythagoras’ proof that the square on the
hypotenuse of a right-angled triangle in the Euclidean plane
necessarily equals the sum of the squares on the other two sides.
-
The second and more common outcome is the hypothesis, after being
subjected to testing, is disproved. In that event, the hypothesis
passes out from the scientific method and into the dustbin of failed
ideas. A disproven hypothesis cannot live again. That is the end of
it.
-
The third and commonest outcome is that the hypothesis is neither
proven, because no complete and formal demonstration of it can be
found, nor disproven. In that event, the hypothesis lives to fight
another day, the General Problem is redefined and improved in the
light of the failure of scientists attacking the hypothesis to
disprove it, and in due course a new Tentative Theory emerges to be
subjected to another Error Elimination phase, and so ad infinitum.
From this short description of the origin and current formulation of
the scientific method, we conclude that:
-
the scientific truth - not
any political objective - is the only purpose of the scientific
method
-
that scientists are supposed to be “seekers after truth”,
not pedlars of political propaganda
-
that any hypothesis that
they propose, however politically fashionable or financially
profitable or academically expedient it may be, must be capable of
being rigorously scrutinized and tested by other scientists to
establish whether it is false.
And how can one possibly test a hypothesis that is the result of the
application of a given computer program to a given set of data
unless the program code and the data are fully disclosed to any
scientists who wish to verify the program and the data and the
methods used by those advancing the hypothesis?
The refusal of
Professor Jones and the Team to release their data, a refusal that
persisted for many years, is in direct and flagrant contradiction to
every rule and principle of science that underlies the scientific
method.
On that ground alone, it is a scandal, and a serious one.
Just how serious the scandal is will become apparent when we study
the elaborate steps that the Team furtively took to make quite sure
that their hypotheses about the 20th century being the warmest in
the past ten centuries, and about the rate at which the Earth warmed
over the 20th century, could not be subjected to the independent and
necessary scrutiny and verification by other scientists that the
scientific method absolutely and always requires.
Here are the steps that the Team took to thwart requests from Mr.
McIntyre and other scientific researchers to be allowed access to
their methods and data for purposes of verification.
-
Professor “Phil” Jones,
the man chiefly responsible for the
Climate Research Unit’s surface- temperature dataset, at first
answered all queries about his computer codes and data by saying
that he refused to release any information because those requesting
it were only asking for it so that they could find out whether it
was correct.
Well, yes: that is how science works. It is not enough
for a scientist merely to declare a result, and then to refuse to
say how he obtained it.
-
Professor Jones’ sour, sullen, silly, scientifically-senseless
refusal to make all of his data and codes immediately available when
other scientists requested it had long aroused suspicion,
particularly because his results had a direct bearing on the
question of how fast the world is warming, a currently-fashionable
political topic, and not least because we, the taxpayers, are
writing the checks that fund him and his research.
-
When the Freedom of Information Act came into force in the UK,
Professor Jones and other members of the Team began writing emails
to each other about how they could prevent their codes and data from
being made available.
-
Professor Jones’ first advice to fellow-members of the Team,
recorded in one of the emails released by the whistleblower at the
University of East Anglia, was that they should not let anyone know
that there was a Freedom of Information Act in the UK.
-
Professor Jones subsequently wrote to members of the Team that he
would destroy data rather than provide it to researchers who
requested it under the Freedom of Information Act.
-
Professor Jones and his
conspirators on the Team then contrived a remarkable number
of pretexts for not disclosing data and computer programs to
anyone who might request them under the Freedom of
Information Act.
The Team discussed:
-
Hiding (they repeatedly used
the word) behind public-interest immunity
-
Hiding behind the UK’s Data
Protection Act, which does not prevent disclosure of
data or research paid for by taxpayers
-
Hiding behind advice from
the office of the Information Commissioner, the UK
official who enforces the Freedom of Information Act
-
Hiding behind the fact that the UN’s
climate panel is an international entity not subject to
the UK freedom-of-information law
-
Hiding behind
reclassification of as much as possible of their work as
UN work, so as to evade their obligation at law to
disclose requested information
-
Hiding behind contracts between the Climate Research Unit and
other national weather bureau whose data it had received, on the
bizarre pretext that weather data that was and is openly published
worldwide might be held by some nations to be confidential.
-
Professor Jones, in another exchange of emails revealed by the
whistleblower, discusses with the Team the fact - which the emails
deplore - that some scientific journals not only have a policy of
requiring all computer codes and data to be archived with the
journal at the same time as a learned paper is submitted, but also
actually go to the trouble of enforcing the policy.
The implication
was that submitting papers to such journals was best avoided,
because it might lead to publication of the information the Team
was, for some reason, so desperately anxious to conceal and to
withhold.
-
Professor Jones then conspired with Freedom of Information
Officers at the University of East Anglia to minimize the scope,
categories, and quantity of information to be disclosed to those
requesting it.
A revealing email to members of the Team describes
how Professor Jones had shown the University’s Freedom of
Information Officers details of the website of one of those
requesting information about how he had compiled his
global-temperature dataset, and had persuaded them to agree that the
person requesting the data ought not to be given anything if
possible.
Yet there is no provision in the Freedom of Information
Act in the UK that allows any such arbitrary discrimination against
people whom those who are bound to disclose information happen to
fear or dislike.
-
Professor Jones, in another revelatory email, discloses how a
Freedom of Information officer at the University of East Anglia had
told him that he must not destroy any emails, except for the purpose
of keeping email traffic manageable.
These weasel words were, in
effect, an open invitation to Jones to destroy as many emails as he
liked, in the sure and certain knowledge that the Freedom of
Information officer would cover for him, even though the capacity of
the servers at the University was and is more than adequate to
permit all of the Team’s emails to be permanently stored, tracked,
and made available on request.
-
Numerous emails between Professor Jones and the Team establish
that they were particularly anxious to conceal from other
researchers the computer code they were using to fabricate their
global-temperature record.
The reason for this refusal is readily
discernible from one of the document files also released by the
whistleblower, a series of notes by a exasperated programmers trying
to make sense of the numerous segments of apparently meaningless,
erroneous, or incomprehensible computer code in the Team’s programs,
and of many data files that were missing, incomplete, unlabeled,
labeled as duplicates, duplicated, or based on incompatible units of
measurement.
-
The methodology at the University of East Anglia
- if the 15,000
lines of commentary by the programmers are right - is little better
than simply making the numbers up. In short, there is a very good
and obvious reason why Professor Jones wanted to conceal his
computer code: any independent researcher examining it -
particularly one as competent and diligent as Mr. McIntyre - would
at once realize that it was entirely unfit for its purpose, and that
the global instrumental temperature record of the past 150 years is
little better than a work of fiction.
-
Finally - and here the evidence of criminality is
incontrovertible - in 2008 Professor Jones wrote to several members
of the Team inviting them to delete all emails relating to the
Team’s participation in the preparation of the previous year’s
Fourth Assessment Report of the UN’s climate panel.
He wrote this
email some three weeks after the University of East Anglia had
received a request under the Freedom of Information Act for
precisely the information that he was recommending his
fellow-members of the Team to emulate him in destroying.
Section 77 of the Freedom of Information Act 2000 empowers the
courts to impose substantial fines on public bodies or their
personnel found guilty of the offense of altering, defacing,
blocking, erasing, destroying, or concealing any record held by a
public authority with the intention of preventing disclosure of
information lawfully applied for under the Act.
At least one complaint has already been sent to the Information
Commissioner, who, on receiving the complaint, is bound by law to
investigate the years of attempts by Professor Jones and other
members of the Team to prevent the disclosure of information from
various applicants who had lawfully requested it, and to whom it
should by law have been - but was not - unhesitatingly, promptly,
and fully supplied.
WHY THE TRUTH
ABOUT TEMPERATURE MATTERS
The question whether “global warming” is manmade is conflated -
sometimes to an absurd and illogical degree - with the question
whether “global warming” is occurring.
Those who
take the extravagantly and baselessly alarmist view beloved of the
scientific and political establishment tend to assert or imply, over
and over again, that merely because the world is warming the warming
must be the fault of the world’s people.
However, this assertion or implication is a notorious instance of
the fundamental Aristotelian logical fallacy of relevance long known
as the argumentum ad ignorantiam - the argument from ignorance.
The
world, this bogus argument runs, is warming, and we do not know why
it is warming, so we shall blame it on whatever or whoever we like. Let’s call it
manmade.
All of the endlessly-repeated, endlessly-exaggerated news about
melting glaciers, rising sea levels, droughts, floods, storms,
plagues and other disasters formerly safely confined to the verses
of the Psalmist at his most lurid or of St. John the Divine at his
most excitable is implicitly, and all too often explicitly, blamed
on humankind. All such attributions are illogical, given the present
state of climate science.
However, precisely because those who hawk the “global warming” scare
so often resort to the argumentum ad ignorantiam when attributing
blame for the “global warming” that is thought to have occurred over
the past 50 years, the very small number of global-temperature
datasets that are available to us are of central importance to the
debate, if not necessarily to scientific logic. There are only four
such datasets: two from the Earth’s surface and two from satellites.
The two terrestrial datasets are:
-
Professor Jones’ dataset from the
Climate Research Unit, in collaboration with the Hadley Center for
Forecasting at the UK Meteorological Office
-
Professor James
Hansen’s dataset at NASA’s Goddard Institute for Space Studies, in
collaboration with NOAA’s National Climatic Data Center, which
produces its own dataset that is, however, functionally
near-identical with that of NASA.
The two satellite datasets are those of:
Given that there are four datasets, it might at first be thought
that systematic scientific corruption in the compilation of just one
dataset would have very little significance - and that is the line
that is being hawked around by the embarrassed environmental
journalists who are acting not as independent journalists but rather
as willing apologists for the Team at the moment.
However, the whistleblower’s data file reveals that there is very
close collusion indeed between key figures in the Climate Research
Unit at the University of East Anglia and in both NASA’s Goddard
Institute for Space Studies and NOAA’s National Climatic Data
Center.
Members of all of these entities in the scientific
establishment are also members of the Team.
They co-ordinate their
results, and they co-ordinate how they present their results, and
they co-ordinate how, between them, they control or seek to control
- to a remarkable extent - the entire process of the UN’s climate
panel, as well as the process of publication of learned papers in
scientific journals, and even the appointment of reviewers and
editors.
Professor Jones at the Climate Research Unit in the UK,
Gavin Schmidt at NASA, and Tom Karl at NOAA are now known via their email
correspondence to be closely and poisonously in league with one
another, and with the paleoclimate community, such as Mann,
Bradley,
and Hughes, the three authors of the paper seized upon by the UN for
its 2001 report claiming - contrary to the overwhelming evidence in
the peer-reviewed literature, and in history, and in archaeology -
that there was no medieval warm period and that, accordingly, the
20th century was the warmest in at least the past ten centuries.
There is no link between those who produce the two satellite-based
datasets and those who produce the surface datasets.
Indeed, John
Christy and Roy Spencer at the University of Alabama at Huntsville,
who run one of the two satellite datasets, are among the most vocal
dissenters from what we are told is the scientific “consensus”
attributing most of the “global warming” of the past half-century to
humankind.
TERRESTRIAL
VS. SATELLITE TEMPERATURE RECORDS
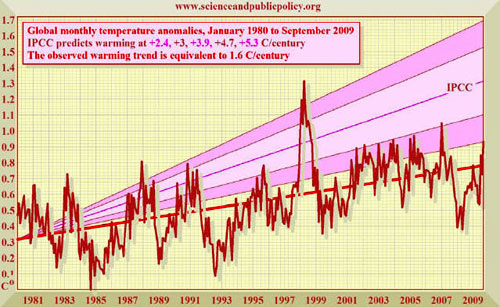
Taking the data from 1 January 1980, by which time the satellites
had been calibrated and were in reasonably reliable operation, and
running the temperature series right through to the present, the
Climate Research Unit’s terrestrial mean global surface temperature
dataset shows 30 years’ warming at a rate equivalent to 1.6 C° (2.9
F°) per century.
Hadley/Climate Research Unit global temperature record
1980-2009
Various influences can be seen in the temperature record.
The two
years of cooling that followed the eruption of Pinatubo in 1991 are
plainly visible. The Philippine volcano, next to Clark Air Force
Base, put up so much ash into the atmosphere that the ash acted as a
parasol preventing sunlight from reaching the Earth.
The great el Niño event in 1998 is also prominent. This sudden spike
in global temperatures occurred because the oceans released vast
amounts of stored heat-energy to the atmosphere. This event occurs
every three or four years: but an event of the magnitude of the 1998
el Niño only occurs once in 150 years.
The opposite event, la Niña, where the oceans take up large amounts
of heat from the atmosphere, last occurred in 2008, and was so
profound that the fall in temperature between the peak of the el
Niño of 2007 and the trough of the la Niña in 2008 gave the world
the fastest January-to-January temperature drop since global records
began in 1880.
The two satellite datasets show very similar warming rates to the
terrestrial dataset. The warming rate shown by all of the datasets
is considerably above the 0.6 C° (1.1 F°) over the 20th century as a
whole.
However, the warming is well below the 3.4 C° (6.1 F°) predicted by
the UN for the 21st century on the basis of the current global rate
of carbon dioxide emissions.
Remote Sensing Systems’ global temperature record
1980-2009
University of Alabama Huntsville global temperature record
1980-2009
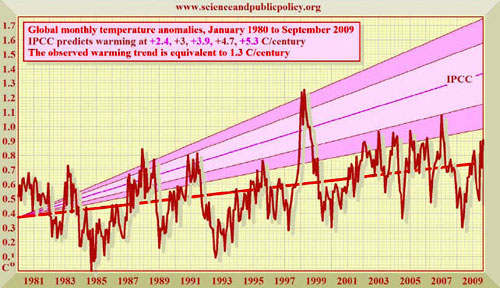
However, there is one immediate and obvious difference between the
Hadley/CRU dataset and the two satellite datasets.
The monthly
upward or downward fluctuations in temperature shown in the
satellite datasets are visibly steeper than in the surface dataset.
However, if anything the reverse ought to be the case, because the
satellite measurements are taken a mile or two above the surface
measurements.
They ought to (and the UAH dataset does) show a little less warming
over time than the surface dataset: but they should also show less
volatility than the surface dataset. Yet they show appreciably more
volatility.
The most likely reason is that the satellite datasets, having been
trained to produce long-run temperature trends similar to those
shown (rightly or wrongly) in the terrestrial datasets, are far more
faithfully measuring short-run temperature anomalies than the
Hadley/CRU terrestrial dataset, which has been subjected to so many
corrections and adjustments and data failures and mere guesswork
that it is barely - if at all - fit for its purpose.
The Science and Public Policy Institute, in compiling its
global-temperature graphs for the authoritative Monthly CO2 Reports,
had originally relied upon all four of the major datasets.
We were compelled to drop the NASA GISS/NOAA NCDC dataset when it
became apparent that the data from more than half a century ago were
being deliberately manipulated in an improper manner with the
manifest intention of artificially inflating the true rate of
observed warming in the 20th century.
We must now also cease to use the Hadley/CRU dataset, which - on the
evidence made public by the courageous whistleblower at the
University of East Anglia - is little better than science fiction.
In future, therefore, the SPPI monthly surface-temperature graphs
will exclude the two terrestrial-temperature datasets altogether and
will rely solely upon the RSS and UAH satellite datasets.
Other problems are apparent with the Climate Research Unit’s
approach to temperature trends. The official line from the Team, and
from the UN’s climate panel that is so strongly under their
influence, is that ten of the last 12 years have been the warmest in
the 150-year temperature record (not exactly a surprise given that
the world has been warming for 300 years, so that the warmest years
would naturally occur at the end of the record).
However, the truth, as yet another revealing email between members
of the Team privately admits, is that global temperatures have been
falling for almost a decade, and the author of the email bewails the
fact that he and his colleagues are unable to explain the fall. So
they decided merely to conceal it.
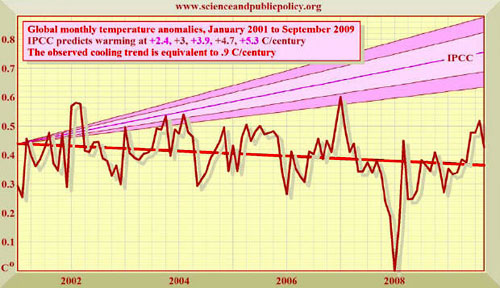
Many mainstream news media, unquestioningly parroting whatever the
conspirators fed to them, have not reported to this day that
temperatures have been on a rapid and significant downtrend ever
since the turn of the millennium on 1 January 2001.
Even the CRU dataset shows this long and significant decline in mean
global surface temperatures:
Hadley/Climate Research Unit global temperature record
2001-2009
The decline, however, is steeper in the combined RSS/UAH satellite
record:
Combined RSS and UAH global temperature record
2001-2009
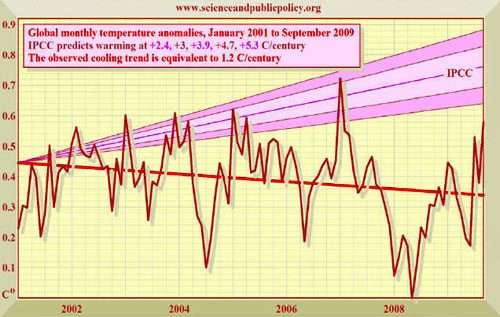
Once again, the el Niño and la Niña effects are plainly visible in
the 2007 peak and 2008 trough respectively.
Once again, the
volatility in the satellite records is greater than that in the CRU
terrestrial record. And, most interesting of all in the context of
the Climategate revelations, the rate of cooling in the CRU record
is equivalent to just 0.9 C° (1.6 F°) per century, while the cooling
rate shown by the satellites is substantially greater, at 1.2 C°
(2.2 F°) per century.
To show how significant this cooling is, the
rate of warming across the whole of the past 100 years (from 1906 to
2006) was just 0.6 C° - or about half of the cooling rate observed
by the satellites for very nearly a whole decade.
At a 2009 hearing of the Energy and Commerce Committee of the US
House of Representatives on Capitol Hill, Representative Joe Barton
(R: TX), former chairman and now ranking Minority member of the
House Energy and Commerce Committee, asked Mr. Tom Karl, the
director of the US National Climatic Data Center, to state whether
or not global temperatures had been falling for seven full years.
Mr. Karl - one of the Team whose emails to one another have now
become public - flannelled and refused to answer the question.
Here is the graph of the NCDC monthly global mean surface
temperature anomalies since the turn of the millennium. For some
reason, Mr. Karl was not willing to admit this:
NCDC confirms 7 years’ unequivocal global
cooling
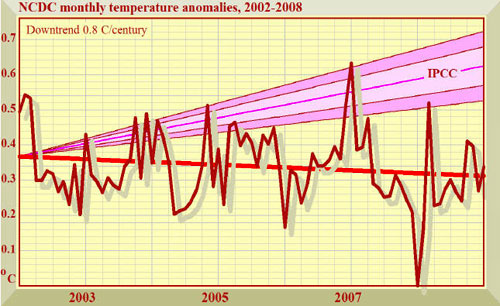
The temperature dataset published by the National Climatic Data
Center shows that the world cooled at a rate equivalent to 1.4
Fº/century.
By contrast, during the 20th century the world warmed by
1.3 Fº.
MORE OFFICIAL
DISHONESTY ABOUT GLOBAL TEMPERATURE
Until
the SPPI began producing its Monthly CO2 Reports, which
included temperature graphs showing the startling discrepancy
between what the UN’s climate panel had predicted and what the
real-world data showed, very few knew that global temperatures had
not risen for 15 years and had been on a falling trend for 9 years.
The scientists were deliberately not telling anyone.
Instead, they were carefully presenting the data in such a way as to
suggest that the rate of warming was itself increasing:
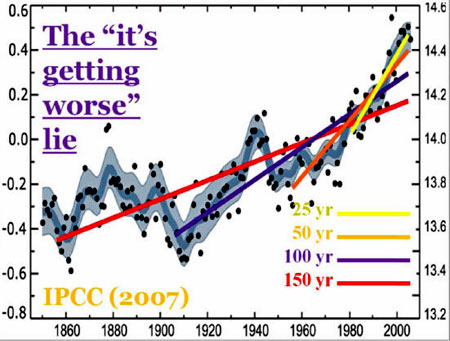
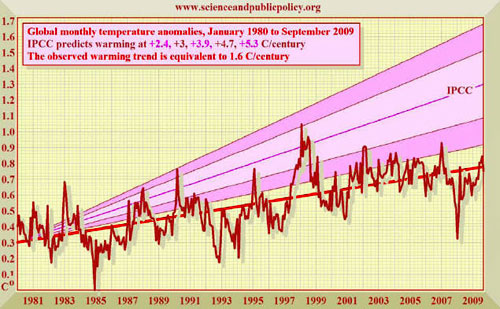
The 2007 report of the UN’s climate panel, cited with approval in a
science lecture by Railroad Engineer Rajendra Pachauri, chairman of
the panel’s science working group, and also about to be cited with
approval in a “Technical Support Document” in justification of the
Environment Protection Agency’s bizarre finding that CO2 and five
other gases are jointly or severally “dangerous” in terms of the US
Clean Air Act, contains the above graph purporting to show that the
rate at which the world is warming is inexorably increasing.
The UN’s graph is an egregious instance of the endpoint fallacy, a
dishonest abuse of statistics by which false trends are demonstrated
by careful selection of endpoints or (in the present instance)
start-points when evaluating data trends.
It beggars belief that an official intergovernmental panel, funded
by taxpayers but unfortunately staffed by the very conspirators
whose antics have now been exposed by the whistleblower at East
Anglia, could ever have put out a headline graph of such staggering
dishonesty.
The lead author of the UN document was Susan Solomon, one of those
mentioned in the revelatory emails from East Anglia as being closely
involved with “the Team” in the conspiracy to fool the world’s naive
and untutored politicians and environmental journalists into
believing the Team’s story-line that temperatures that are falling
are really rising at an unprecedented rate, on the ground that our
emissions of CO2 are to blame.
Removal of Railroad Engineer Pachauri’s false trend-lines from the
UN’s bogus graph reveals the true position:
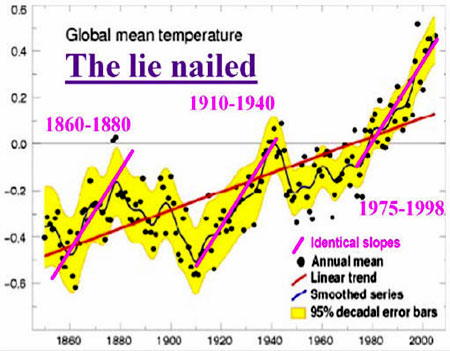
The world warmed at the same rate from 1860-1880 and from 1910-1940
as it did from 1975-1998, as the three parallel magenta trend-lines
demonstrate.
The earlier two periods occurred before humankind can possibly have
had any significant influence on temperature.
Therefore there is no anthropogenic signal in the global temperature
record, and no scientific basis whatsoever for the assertion by the
UN’s climate panel that the warming rate is accelerating.
The United Nations’
graph is merely a pictorial lie, deliberately intended to deceive.
And the lie continues to be paraded every time Railroad Engineer Pachauri gives one of his rambling, out-of-his-depth lectures. It is
also paraded in the Technical Support Document by which the US
Environmental Protection Agency purports to justify its proposal to
treat carbon dioxide as though it were a pollutant rather than a
harmless trace gas absolutely essential to all life on Earth and
currently - compared with former eras - in somewhat short supply in
the atmosphere.
To demonstrate why the endpoint fallacy is a shoddy statistical
abuse that no reputable scientific body would ever depend upon, we
can use the same global temperature data as the UN itself to deliver
a result precisely the opposite of that which the UN’s climate panel
tries to draw.
We use the same temperature data as the UN, but we carefully choose
different start-points for our temperature trend-lines: 1993 (top
left), 1997 (top right), 2001 (bottom left), and 2005 (bottom
right), and then plot the least-squares linear-regression trend on
the underlying data:
Accelerating “warming” becomes rampant cooling
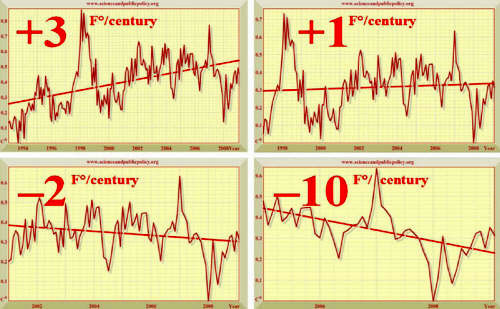
If we begin in 1993 (top left) and advance the start-date for the
global temperature data successively by 4 years at a time, the UN’s
own data show the world heading for an Ice Age. Using the same data
as the UN’s climate panel, we reach a diametrically opposite (and
equally unjustifiable) conclusion, proving the UN’s shameful abuse
of statistical method.
No reliance can be placed upon purported temperature trends that
depend arbitrarily upon a careful selection of start-dates and
end-dates. The reason is that the temperature record is what
scientists call “stochastic” - it jumps up and down more or less at
random, so that the trend-line calculated from it (the straight line
in each of the above graphs) is highly sensitive to the scientists’
choice of startpoints and endpoints.
That is why
the United Nations, Dr. Pachauri, and
the EPA are wrong to rely upon
the endpoint fallacy as the basis for their erroneous conclusion
that “global warming” rates that are far from unprecedented are
accelerating when they are doing nothing of the kind.
Not only do we now need an accurate, globally uniform, unbiased
method of gathering hourly temperature changes everywhere in the
world, but we also need scientists honest enough not to perpetrate
the shoddy statistical abuses that are so evident in the documents
of the UN’s climate panel, influenced as we now know them to be by
the machinations of the Team.
Now that we have demonstrated the unwillingness of the National
Climatic Data Center, in the person of its Director, to provide a
straight and honest answer to an official committee of the US
Congress, and the unwillingness of the official body charged with
investigating “global warming” to use statistics honestly and
competently, we now turn to the parallel dishonesty that is evident
in the compilation of the closely-linked NASA GISS
global-temperature dataset.
As Anthony Watts has pointed out in his masterly survey of
temperature monitoring stations in the United States, many stations
are sited at airports, by tarmac roads, next to buildings, close to
air-conditioning heat-vents, by local authorities’ trash-fires, and
in industrial areas that were once rural.
This distorts the readings from the stations, causing them to record
warming that comes not from greenhouse gases but only from local
industrialization next to the measuring instruments.
When Mr. Watts first began to point out these defects in how
temperature is measured, and began to attract publicity for his work
via his admirable website,
www.wattsupwiththat.com, the first
reaction of the scientists in charge of the network of US
temperature stations that he has surveyed was to remove from the
public domain the list of precise locations for the sensors, so that
Mr. Watts could not survey any more of the stations.
However, there was an outcry at this scandalous attempt at
concealment of data that had been paid for by the public, and to
which the public were on any view entitled.
The bureaucrats - who had at first tried to react exactly as
Professor Jones and his colleagues at the Climate Research Unit had
reacted, by hiding public scientific data - climbed down and
republished the locations for their temperature stations, and Mr.
Watts’ survey is now all but complete.
It shows a horrifying picture of gross carelessness and neglect on
the part of:
NASA’s own temperature record has some lamentable irregularities of
its own.
Recently it was discovered that raw data from individual
temperature stations were being “processed” - allegedly to remove the urban heat-island effect
- but that the
effect of the processing was to enhance the heat-island effect and
increase the apparent rate of warming rather than to reduce it to
compensate for the heat-island effect.
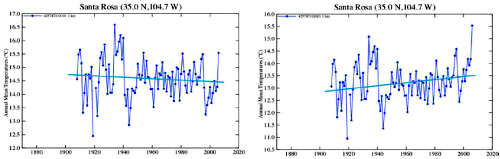
A startling example of the data tampering by scientists at the
Goddard Institute for Space Studies is the century-old temperature
record for the temperature station at Santa Rosa, New Mexico, the
headquarters of the NOAA itself.
The raw data show one thing: the
processed data show quite another. This is a trick we have already
seen in the Climate Research Unit’s “Nature trick” to “hide the
decline” in tree-ring proxy temperature data after 1960.
And we
shall see it again later, when we examine in detail how one national
temperature dataset has been similarly tampered with so as
grievously to misstate the true direction of the temperature trend.
Raw data show 100 years’ cooling
-
‘Processed ’ data show warming
This discovery led Mr. Watts to investigate how
GISS had changed its
processed data over the years.
Had the scientists increased the amount of ‘processing’ of the raw
data over the years in a dishonest attempt to try to compensate for
the continuing failure of global mean surface temperature to rise in
accordance with the exaggerated predictions of the computer models,
including that from GISS itself?
The GISS model had long been notorious for over-predicting “global
warming”.
For instance, in 1988 James Hansen,
now director of GISS,
had testified on Capitol Hill on a day carefully chosen by the then
Democrat administration because a heat-wave had been forecast.
He had displayed the following temperature graph:
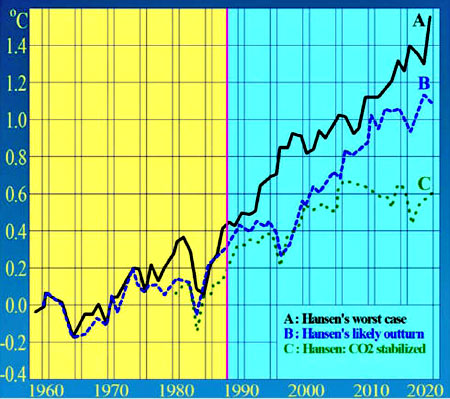
The elected representatives who saw Hansen’s graph on that hot day
were understandably alarmed at what it foretold.
However, there was
no sound scientific basis for the graph: it depended upon an
assumption that the warming effect of additional CO2 concentrations
in the atmosphere would be many times greater than is likely.
Hansen
told Congress that unless CO2 concentration were stabilized by 2000
(the green dotted line on the graph) temperatures would be most
likely to rise along the path of the blue dashed line, and might
even follow the black solid line.
In fact, none of these scenarios proved to have any contact with
reality. Indeed, on the 20th anniversary of Hansen’s failed
prediction, not one of the carefully-selected and impeccably
sycophantic journalists to whom Hansen granted interviews was
impolite enough, or journalist enough, to ask him why his prediction
had not come to pass. And this was a strange question not to ask,
because the month of June 2008 was colder, globally, than the month
of June 1988, 20 years previously.
The red line on the graph below shows what actually happened to
global mean surface temperature:
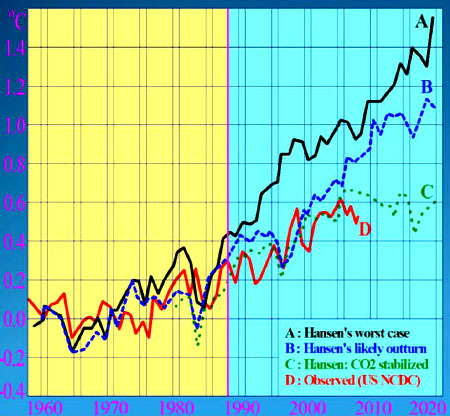
Temperatures indeed rose from 1988 until 2009, but they rose at a
rate that turned out to be well below that which Hansen had
predicted on the assumption that global CO2 emissions would be
stabilized in the year 2000 and would rise no further thereafter.
However, in fact CO2 emissions continued to rise at 2 ppmv per year
throughout the new millennium, but temperatures failed to rise.
Indeed, had the red line above not been taken from the GISS/NCDC
temperature dataset, the warming over the years following Hansen’s
prediction would have appeared even less than on this graph.
Hansen’s prediction had proven to be a very substantial
exaggeration.
Why is this important?
The reason is that it is Hansen’s method for
calculating the warming effect of CO2 on global temperature that the
UN’s climate panel chiefly relies upon. Since his method produces a
visible and substantial exaggeration of future warming, by
implication the forecasts made by the UN’s climate panel are likely
to produce similar very large exaggerations.
Perhaps it was disappointment that the GISS temperature projections
directed by Hansen had proven to be such a failure that led him and
his organization to tamper more and more
over time with the temperature data for past decades, so as to
produce ever-increasing estimates of the rate of “global warming”
that had occurred in the 20th century.
The indefatigable Anthony Watts, having noticed that the raw data
for many individual stations in the GISS dataset had been
“processed” so as to turn a century of actual cooling into a century
of spurious warming, wondered whether the “processed” data itself
had been altered over time with the aim of producing an ever-higher
apparent (but bogus) rate of “global warming” over the 20th century.
He found that this was indeed the case:
1999 global processed data...
...and 2008 global processed data

The GISS global-temperature dataset, after adjustment by
“processing” of the raw data, as it stood in 1999 (left) and in 2008
(right), showed that the data peak in the 1930s has been reduced in
the later version of the dataset, and the 1998 peak has been
markedly increased, artificially increasing the 20th-century warming
rate and implying that tampering has increased over the years.
As an experiment, you can see this progressively increased tampering
clearly by taking the two graphs above and setting them up as
successive slides in a PowerPoint presentation. Now turn your
computer into a “blink-comparator” by flicking backwards and
forwards between the two graphs.
Note how the temperature peak in the 1930s has been reduced
appreciably in the 2008 dataset. There is no legitimate scientific
justification for going back and rewriting the temperature record of
three quarters of a century ago in this way.
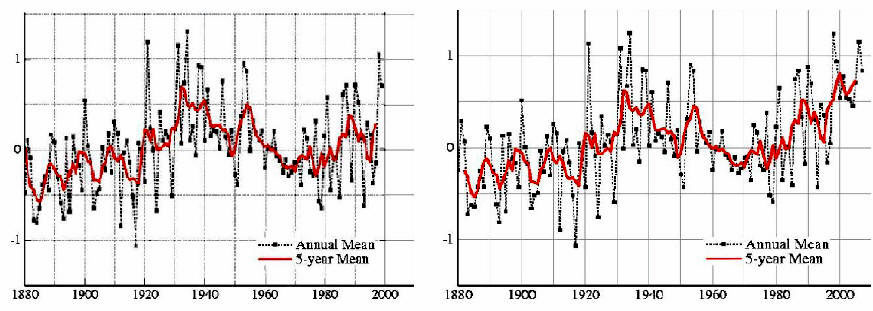
One final piece of tampering with the 20th-century temperature
record is worthy of note, because it is so seldom cited.
The infamous “hockey-stick” graph, by
which the Team purported to rewrite a thousand years of temperature
history by ingeniously but falsely abolishing the medieval warm
period, also contained a spectacular data trick in the 20th century
instrumental record, shown in red on the graph:
How the medieval warm period was abolished
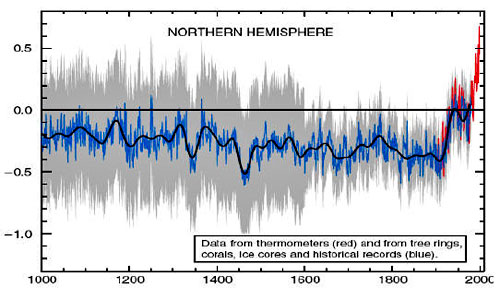
The Team carefully chose to use only northern-hemisphere temperature
data.
In this way, they were able to overstate the 0.6 C° (1.1 F°)
warming of the 20th century (in red on the above graph) by an
impressive but less than honest 100%, making it look more like 1.2
C° (2.2 F°).
The story of how the medieval warm period was artificially abolished
has been told elsewhere. For now, it is necessary only to point out
that the notion that there was no warm period in the Middle Ages
does not represent the “consensus” in the scientific literature that
the UN’s climate panel falsely claims to summarize in its assessment
reports.
The CO2 website,
www.co2science.org, has shown by careful gathering
of evidence,
...have
contributed to learned papers in the peer-reviewed literature that
provide hard evidence that the medieval warm period was real, was
global, and was warmer than the present.
Finally, it is worth setting the debate about the medieval warm
period in context.
The Team, by ingeniously getting the world to
focus exclusively on the medieval warm period, diverted its
attention from the fact, well established in the scientific
literature, that most of the last 11,400 years, since the end of the
last Ice Age, have been warmer - and often considerably warmer -
than the present.
Certainly the Bronze Age, the Roman era, and the
medieval warm period were all warmer than the present. Also, each of
the past four interglacial warm periods was up to 6 C° (11 F°)
warmer than the present.
The Team’s intention, in promoting the “hockey-stick” graph to which
the UN’s climate panel took like a quack to colored water, and in
keeping the debate about it raging, was to ensure that no one looked
any further back in the historical record, for anyone who has
done so has at once realized that today’s temperatures, far from
being exceptional, as the Team’s bogus graph had sought to show, are
in fact very well within the natural variability of the climate.
A NATION
TAMPERS WITH ITS TEMPERATURE RECORD
The news of the scale on which Professor Jones and the Team were
tampering with global temperature data alerted many who had
previously believed the “global warming” scare into thinking again.
The first attempt that the Team and their supporters at the UN’s
climate panel made to recover their lost position of authority and
credibility was to say that there was nothing particularly wrong
with the Climate Research Unit’s global-temperature dataset because
it accorded so closely with the GISS/NCDC terrestrial dataset and
with the two satellite datasets. However, the Team’s members
effectively controlled both terrestrial datasets.
Now, therefore, it has become necessary for every temperature
dataset, including national and regional datasets, to be re-examined
with a view to discovering whether there is any scientific basis for
it.
Science, after all, is as globalized as all other activities of
humankind.
If the global temperature datasets have been tampered
with by the scientific-technological elite to demonstrate a false
warming where far less warming truly occurred, have national and
regional datasets been tampered with as well, particularly in
countries whose governments are of a political stamp likely to find
the “global warming” scare expedient as a method of increasing the
taxes and regulations and controls and rationings that they like to
inflict on the little guy?
In this process of essential scrutiny, New Zealand has led the way.
Richard Treadgold of the Climate Conversation Group, working with
the New Zealand Climate Science Coalition, has compiled data showing
that New Zealand has not been warming for an entire century. This
startling result gives the lie to claims from the UN’s climate panel
and many other corrupt scientific sources that the country has been
part of “global warming” over the past 100 years.
Mr. Treadgold has made a simple check of publicly-available
information, and has proven the official claims that New Zealand has
been warming to be simply false.
In fact, New Zealand’s temperature
has been remarkably stable for a century and a half.
New Zealand's National Institute of Water & Atmospheric Research (NIWA)
is responsible for the National Climate Database. This database,
available online, holds all New Zealand's climate data, including
temperature readings, since the 1850s.
Anybody can go and get the
data for free. Mr. Treadgold did that, and compiled his own graph
directly from the published data.
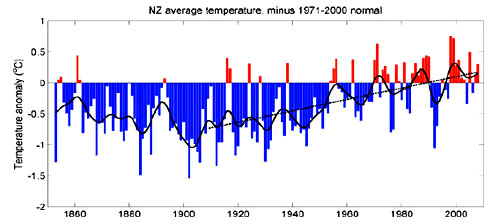
NIWA’s official graph of temperatures since the mid-1850s is shown
above. It shows a pronounced warming trend of 0.9 C° (1.7 F°) over
the past century.
This graph is the centerpiece of NIWA’s
temperature claims. It contributes to global temperature statistics
and the IPCC reports. This graph is no small part of the reason why
the New Zealand government is insisting on introducing an
emissions-trading scheme and participating in the climate conference
in Copenhagen.
However, the graph is an illusion. It is as bogus as the Climate
Research Unit’s graphs.
Dr Jim Salinger (who no longer works for NIWA) began compiling this graph in the 1980s when he was working at
the Climate Research Unit in the UK.
To get the original New Zealand
temperature readings, Mr. Treadgold registered on NIWA's web site,
downloaded the data he needed, and made his own graph. The result
looked nothing like the official graph.
Instead, Mr. Treadgold and
his colleagues were surprised to get this:
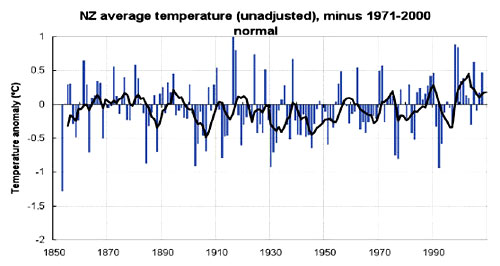
It is apparent using nothing more than the Mk. 1 Eyeball that there
is no slope in the temperature trend as plotted from the raw New
Zealand temperature data, either upward or downward.
The
temperatures are remarkably constant way back to the 1850s.
Of
course, the temperature still varies from year to year, but the
trend stays level - statistically insignificant at a warming of 0.06
C° (0.11 F°) per century since 1850.
-
Why does NIWA’s graph show strong warming, while the graph compiled
from their own raw data looks completely different?
-
Why does their
graph show warming, while the actual temperature readings show none
whatsoever?
-
Have the readings in the official NIWA graph been
adjusted?
Mr. Treadgold and his colleagues compared NIWA’s raw temperature
data for each station with the adjusted official data, which they
obtained from one of Dr Salinger’s colleagues.
Requests for this
information from Dr Salinger himself over the years, by different
scientists, had long gone unanswered, just as similar requests for
the data from his former employers, the Climate Research Unit in the
UK, had also gone unanswered.
The temperature-station histories in New Zealand were unremarkable.
There were no reasons for any large corrections. However, Mr.
Treadgold was astonished to find that very substantial adjustments
had indeed been made.
About half the adjustments actually created a warming trend where
none existed in reality; the other half greatly exaggerated existing
warming. All the adjustments either created or increased the warming
trend, with only one (Dunedin) going the other way and slightly
reducing the original trend.
The shocking truth is that the oldest readings have been cranked way
down and later readings artificially lifted to give a false
impression of warming, as documented below, and in a fashion very
similar to that which Mr. Watts had documented for the corrupt NASA/GISS
temperature dataset.
There was nothing in the station histories to warrant these
adjustments. To date, despite requests, Dr. Salinger and NIWA have
not revealed why they made them.
One station, Hokitika, had its early temperatures reduced by a
staggering 1.3 °C (2.3 °F), creating an artificial strong warming
from a real mild cooling. Yet, as with the Santa Rosa temperature
station in the US, there was no apparent reason for tampering with
the long-established historical record of instrumental temperatures.
The researchers in New Zealand had discovered that the warming in
New Zealand over the past 156 years was indeed man-made, but it had
nothing to do with emissions of CO2. It had been created by man-made
adjustments of the temperature.
In effect, NIWA were claiming that New Zealand, with a (purely
artificial and invented) warming rate of 0.9 C° over the past 100
years, had warmed at a rate 50% greater than the global average of
0.6 C°.
The unexplained changes to the official New Zealand temperature
record cast strong doubt on the Government’s assertions that
addressing “global warming” is urgent. On any view, a true
temperature increase of just 0.06 C° (0.11 F°) over the whole of the
past century does not suggest any need for urgent remedial action by
the New Zealand Government.
At a minimum, NIWA’s official “global warming” predictions,
including changes in temperatures, precipitation, winds, storms and
sea levels, must be re-examined in the light of the absence of any
significant change in temperature to date, from any cause.
New Zealand’s contribution to the global statistics is now under a
shadow, so there could be regional or even global implications of
these undisclosed, unjustified, and unjustifiable “adjustments”.
In the light of these findings, does New Zealand really need an
emissions-trading scheme?
For, if all that “nasty” carbon dioxide
and methane we are pumping into the atmosphere has utterly failed to
increase our temperature until now, why ever should it do so in the
future?
LYING EVEN TO
CHILDREN
Even children are no longer protected from the lies - for that is
what they are - fabricated and circulated by the profiteering
“global-warming” fraudsters in the scientific and political
community.
Laurie David, the producer of Al Gore’s recent film “documentary”
about the climate, published a children’s book about the climate in
2007. In that book, she displayed a graph purporting to show the
correlation - and, by implication, the causative link - between
changes in CO2 concentration in the Earth’s atmosphere
over the past 650,000 years and changes in global mean surface
temperature.
The graph displayed in the book is
reproduced here:
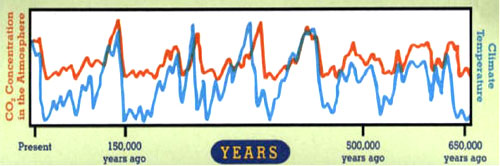
The caption below this graph read as follows:
“The more the CO2 in the atmosphere, the higher the temperature
climbed. The less CO2, the more the temperature fell. You can see
this relationship for yourself by looking at the graph.”
Unfortunately, the caption was false. So was the graph.
The captions
on the graph had been switched, so that the temperature graph (in
red) was labeled “CO2 concentration in the atmosphere”, and the CO2
concentration graph (in blue) was labeled “Climate Temperature”. By
this device, it became possible for the authors to suggest that it
was the changes in CO2 concentration in each of the past four or
five interglacial warm periods that had caused the warming in each
of the warm periods.
In truth, as paper after paper in the scientific literature has
demonstrated, it was always the temperature that changed first in
the Earth’s early climate, and CO2 concentration changes followed.
Was the error in the children’s book deliberate?
What we can say is
this. When the error in both the graph and the caption was admitted
by both the authors and the publishers, they absolutely refused to
make any correction.
They were content to profit by lying,
deliberately, to children.
AL GORE’S
TEMPERATURE-RELATED FALSEHOODS
True scientists who came across
Al Gore’s climate movie had known
for some time that one of the central lies that underpin the climate
scare is the lie that global temperatures have been rising in an
unusual way in recent decades, with the implication that “global
warming” caused by humankind is already triggering disastrous
weather events all round the planet.
Take one example.
Gore said that the glacier at the summit of Mount
Kilimanjaro had melted because of “global warming”. In fact, it had
been ablating - not melting - since 1880; and half of its snows had
gone before Hemingway wrote The Snows of Kilimanjaro in 1936.
In the past 30 years, NASA satellites have measured two things that
make the attribution of the disappearing snows of Kilimanjaro to
manmade “global warming” altogether impossible.
-
First, the entire Central African region around the mountain has
been cooling for three decades.
-
Secondly, at no point since satellite records began in 1979 has
Kilimanjaro’s summit temperature risen above -1.6 °C.
For most of
the past 30 years the mean summit temperature has been -7 °C. Try
melting ice at those temperatures. Its thermal inertia makes melting
impossible.
As our graph from the University of Alabama at Huntsville shows,
there has been no temperature trend at the summit of Kilimanjaro
since the satellites first began monitoring it 30 years ago:
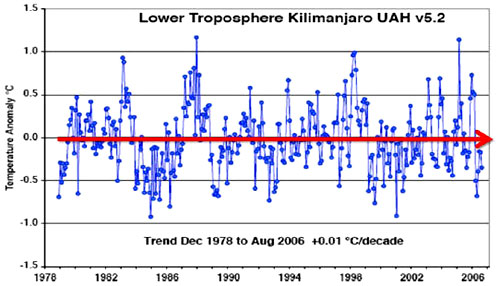
Instead, the glacier has been ablating - passing directly from the
solid to the gaseous state of water without passing through the
intervening liquid state - because of imprudent and substantial
post-colonial deforestation in the region surrounding the mountain,
which has dried the air.
Gore also recited the falsehood that would later be repeated by his
producer in her children’s book:
that in the early climate it was
CO2 change that preceded and hence by implication caused temperature
change, when in fact it was temperature change that preceded and
hence cannot have been caused by CO2 change.
Lies about the rate and significance of global and regional
temperature change, therefore, have long been right at the center of
the case presented to the world, until now with great success, by
the international cadre of “global-warming” profiteers and
scientific fraudsters that have promoted and pushed and peddled the
scare.
The scale and extent of those lies has been indicated in this
paper.
How, then, can such willful misfeasance by the
“scientific-technological elite” of whose activities President
Eisenhower gave the nation a warning in his farewell address from
the White House be prevented in future?
WHAT IS TO BE
DONE?
In public policy terms, the revelation that the international
scientific and political establishment has been inventing, bending,
distorting, manipulating, hiding, blocking, and destroying
scientific data for the sake of advancing a narrow, extremist, and
bitterly anti-Western political viewpoint cannot be safely ignored.
Climate science is too important to be left to politicized
scientists, just as climate politics is too important to be left to
unscientific politicians.
The first step is to close the Climate Research Unit (and perhaps
the University of East Anglia with it), to dismiss all of its
personnel, and not to allow any of them to be funded by taxpayers
ever again.
Scientific fraud and corruption on the scale that has
now been revealed must be firmly rooted out and prevented from
recurring.
Those responsible for the deliberate blocking, altering, concealing,
or destroying of scientific data must be put on trial - to use James
Hansen’s term - for “high crimes against humanity”.
For it is on the
word of crooks and racketeers such as these that, in the name of
addressing the non-problem that they had invented and fostered and
festered, the Third World has been flung into
food riots and mass
starvation by the doubling of world food prices that followed the
biofuel scam that the “global-warming” profiteers invented as just
one of a bewildering array of boondoggles to enrich themselves at
the expense of the little guy, who, as always, suffers when the
political elite merely exploit him when it is their duty to serve
him.
Let the climate criminals stand trial, and let them be fined for
offenses under the Freedom of Information laws, and let them be
imprisoned for their fraudulent tampering with scientific data, and
for their suppression of results uncongenial to their politicized
viewpoint, and for the sheer venom with which they have publicly as
well as privately denigrated all those scientists with whom they
disagreed, and for the insouciance with which they interfered with
editors of scientific journals and with the process of the UN’s
climate panel itself.
Once the fraudsters on both sides of the Atlantic have been locked
up and cleared from the field, it will be essential to obtain a
reliable indication of how temperatures are really changing
worldwide.
For the oceans, this necessary step has already been
taken.
The 3319 automated bathythermograph buoys of the
ARGO
project, deployed throughout the world’s oceans since 2003, have for
the first time provided a reasonably accurate profile of temperature
change in the climate-relevant upper mile of the ocean surface. They
have shown that, throughout their period of operation, there has
been no net accumulation of heat-energy in the world’s oceans. None
whatsoever.
The analysis has recently been extended backward for 68 years by
Douglass and Knox (2009), who find that there has been no
accumulation of heat-energy in the oceans for 68 years.
This
conclusion, like the results from the ARGO buoys, is fatal to the
official (and now
discredited) notion that a very small increase in the atmospheric
concentration of CO2 will engender a very large warming.
Might an analysis of land surface temperatures produce a similarly
uncongenial result for the world’s classe politique, mesmerized as
it is by the prospect of vastly increasing its own wealth and power
by
setting up an unelected world government with massive powers to
tax, regulate, interfere, shut down free markets, and cancel patent
and intellectual property rights, and all in the name of saving us
from ourselves?
One of the thousands of emails released by the heroic whistleblower
suggests that the answer to this question is Yes.
One Team member
recently wrote to his conspirators to point out that land
temperatures had risen twice as fast as ocean temperatures, a fact
which, he said, would be seized upon by skeptics who would point out
that the Climate Research Unit, like GISS/NCDC, had failed to make
sufficient allowance for the “urban heat-island effect” - the
increasing industrialization that has surrounded once-rural
temperature stations with tarmac and industry and the direct and
indirect output of heat that they bring.
Manifestly, something must now be done to put right the damage that
has been done to climate science by the malevolent and incompetent
antics of the Team.
-
First, there is now a need for a standardized, international network
of properly-sited, modern, automated land temperature monitoring
stations, reporting by satellite so that the data are immediately
available to all.
The aim should be to equal the reliability and
public accessibility of the ARGO bathythermographs that have been
deployed for the past six years in the oceans.
Until this standardized network has been installed worldwide,
calibrated, and declared operational, all terrestrial and satellite
temperature records should be regarded with profound suspicion, and
no public policy - particularly any policy that menaces the freedom,
democracy, and prosperity of the West - should be founded upon them.
-
Secondly, all those whose emails have demonstrated that they have
acted maliciously and in bad faith - even those whose conduct
stopped short of being actually criminal - should be dismissed from
every publicly-funded scientific post, and should be permanently
debarred from participating in any international scientific
endeavor, including the UN’s climate panel.
On grounds of its sheer
nastiness alone, the Team should be disbanded forthwith and for aye,
never to trouble humankind again.
-
Thirdly, all public policy measures to address what is now known to
be the manufactured non-problem of “global warming” should be put on
hold forthwith, and no further public policy measures should be
instituted at any future time, unless and until global mean surface
temperature, as properly and independently measured by the new
methods recommended here, shall have risen by at least 1 C° (2 F°)
compared with temperature in the year 2000.
-
Fourthly, all “global-warming” profiteers who are making money out
of carbon-trading or “green investment” or UN climate boondoggles of
whatever kind should be warned, and clearly warned, that now that
the basis for their profitable activities is known to be hollow and
fraudulent, they themselves will be indicted, prosecuted, and jailed
for fraud, and their profits confiscated as the fruits of
money-laundering, if in future they participate in any fostering or
furthering or promoting of the lies, damned lies, and bogus
statistics that have now shown the entire “global warming” theory to
be nothing more than a scam.
We end this paper on temperature trends with the following quotation
from
Dwight D. Eisenhower’s farewell address to the nation as
President of the United States:
“Public policy could itself become
the captive of a scientific-technological elite... The prospect
of domination of the nation’s scholars by Federal employment,
project allocations, and the power of money is ever present -
and is gravely to be regarded.”
Amen to that.
ESSENTIAL
READINGS
"Global Warming" A Debate at Last -
http://scienceandpublicpolicy.org/originals/_global_warming_a_debate_at_last.html
SPPI Monthly CO2 Reports - http://scienceandpublicpolicy.org/monthly_report/
CO2, Global Warming and Coral Reefs: Prospects for the Future -
http://scienceandpublicpolicy.org/originals/co2_coral_warming.html
http://www.amazon.com/CO2-Global-Warming-Coral- Reefs/dp/0971484589/ref=sr_1_2?ie=UTF8&s=books&qid=1259620285&sr=1-2
CO2, Global Warming and Species Extinctions: Prospects for the
Future - http://www.amazon.com/s/ref=nb_ss?url=search-alias%3Dstripbooks&field-
keywords=idso&x=18&y=17
Climate Science Corrupted - http://scienceandpublicpolicy.org/originals/climate_science_corrupted.html
"'Unequivocal' 'Consensus' on 'Global Warming'" - http://scienceandpublicpolicy.org/originals/unequivocal_consensus_on_global_warming.h
tml
Public Comment to the Environmental Protection Agency - http://scienceandpublicpolicy.org/commentaries_essays/public_comment_to_the_environ
mental_protection_agency.html
The Science of Deceit - http://scienceandpublicpolicy.org/commentaries_essays/the_science_of_deceit.html
The IPCC can't count its "Expert Scientists": Author and
Reviewer Numbers are Wrong - http://scienceandpublicpolicy.org/reprint/author_reviewer_numbers_wrong.html
Prejudiced Authors, Prejudiced Findings - http://scienceandpublicpolicy.org/originals/prejudiced_authors_prejudiced_findings.html
Why the IPCC Should be Disbanded - http://scienceandpublicpolicy.org/originals/whytheipccshouldbedisbanded.html
Peer Review? What Peer Review? - http://scienceandpublicpolicy.org/originals/peerreview.html
What is Wrong with the IPCC? - http://scienceandpublicpolicy.org/reprint/whatiswrongwiththeipcc.html
A Climate Science Brief - http://scienceandpublicpolicy.org/commentaries_essays/climate_science_brief.html
Senator Kerry Misfires about Global Warming and National
Security - http://scienceandpublicpolicy.org/images/stories/papers/originals/sen_kerry_misfires.pdf
‘Global Warming’ is No Global Crisis, Major Talking Points -
http://scienceandpublicpolicy.org/monckton/major_talking_points.html
Twisted Science, Crooked Policy - http://scienceandpublicpolicy.org/monckton/twisted_science_crooked_policy.html
The Dog Ate Global Warming - http://scienceandpublicpolicy.org/commentaries_essays/the_dog_ate_global_warming.ht
ml
Hockey Stick? What Hockey Stick? - http://scienceandpublicpolicy.org/monckton/what_hockey_stick.html
Caspar and the Jesus Paper - http://scienceandpublicpolicy.org/commentaries_essays/caspar_and_the_jesus_paper.ht
ml
What is the 'Hockey Stick' Debate About? - http://scienceandpublicpolicy.org/reprint/hockey_debate.html
That Famous Consensus - http://scienceandpublicpolicy.org/commentaries_essays/that_famous_consensus.html
Why Has “Global Warming” Become Such A Passionate Subject? -
http://scienceandpublicpolicy.org/reprint/akasofu_cool_it.html
Medieval Warm Period Project - http://www.co2science.org/data/mwp/mwpp.php
Climate Change, William Happer testimony to Senate Energy
Committee - http://scienceandpublicpolicy.org/reprint/happer_senate_testimony.html
Cleaning Out the Climate Science Cesspool - http://scienceandpublicpolicy.org/commentaries_essays/cleaning_cesspool.html
Scenes from the Climate Inquisition - http://scienceandpublicpolicy.org/commentaries_essays/scenes_from_the_climate_inquisi
tion.html
NCAR US Temperature Record Facts or Deception? - http://scienceandpublicpolicy.org/reprint/temperature_record_facts_or_deception.html
The Coming Climate Dictatorship - http://scienceandpublicpolicy.org/commentaries_essays/the_coming_climate_dictatorship
.html
Peer Warns Public About Dangers to Fundamental Freedoms at
Forth-Coming UN Copenhagen Summit - http://scienceandpublicpolicy.org/commentaries_essays/peers_warns_dangers_of_un_su
mmit.html
Copenhagen Climate Treaty Framework Draft - http://scienceandpublicpolicy.org/reprint/copenhagen_climate_treaty_framework_draft.h
tml
450 Peer Reviewed Papers Supporting Skepticism of AGW-Caused
Global Warming -
http://scienceandpublicpolicy.org/reprint/450_peer_reviewed_papers.html
|