|
June-19-2008 from Rense Website
This is one of those unpleasant discoveries with implications that stagger the imagination. Over the course of three days, a complex repeated variation in solar X-ray measurements and electron output was found.
Although complex variations of electrons and X-rays are very common with our Sun, what is not common is a duplication of X- ray flux and electron flux variations over the span of three days. This is practically unheard of.
Our Sun
generates extremely complex, ever changing waves of energy and
magnetic fields that interact with one another in ways not fully
understood. Rarely do these variations repeat themselves, especially
over three 24 hour periods.
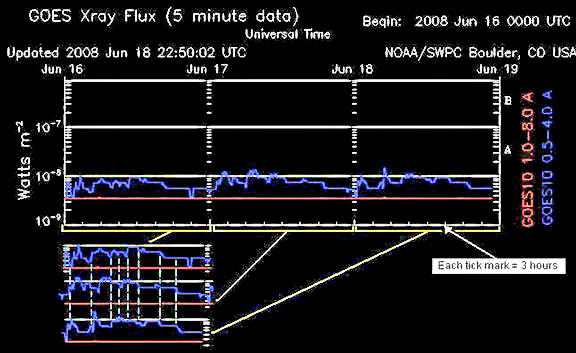
Specific X-ray levels were found to repeat at the same time each day:
Fig. 1 X-ray measurements made by GOES 10 satellite over a 3 day period starting June 16, 2008. The red line represents a longer X- ray wavelength of 1.0 to 8.0 angstroms, which has strangely been almost flat line over the past several months.
NASA claims they have
no idea why the red plot line is flat.
My theory about the red line is that nothing is wrong with the satellite and that our Sun has gone through a change, possibly a permanent one. This seems most likely since the same CCD chip is used to detect the wavelengths you see here.
Opaque filters made of plastics and
metal are moved in front of the chip for each X-ray wavelength to be
measured. The same CCD chip measures everything you see here. There
is feedback to NASA from the satellite that the right filter is in
place for a given measurement, but no word of any filter wheel
errors has yet to be announced. This problem has gone on since last
year.
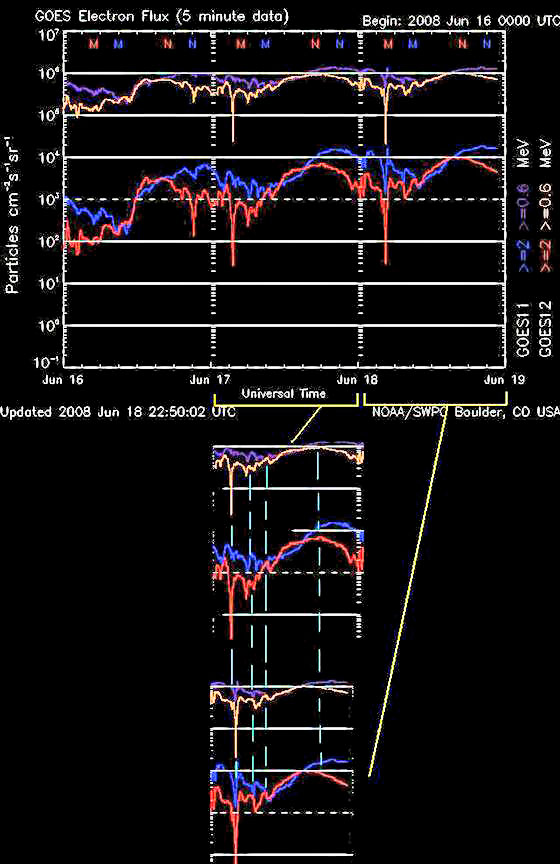
A duplication of electron flux variations for June 17 and June 18 was also found as shown below in Fig. 2:
Fig. 2 Electron measurements over a 3 day span are also measured every five minutes by two other satellites, GOES 11 and GOES 12. These satellites provide important independent confirmation
that eliminates the
possibility of waveform duplication taking place inside any one
satellite.
All of this waveform duplication is
beyond chance and probability. In the past, nothing like this has
been observed before with this degree of complexity by this author.
I have been continuously been examining these and other solar charts
since the early 1990's.
Perhaps these are signature waveforms or
tests of weather manipulation. Modifying the solar output will
easily manipulate the entire world's weather, but may do so in ways
not fully understood. Hence, we recently saw oddities like the
hurricane-like formation over the central part of North America and
powerful Earthquakes.
Everyone is constantly looking at
HAARP
as the cause but that may just be misdirection. HAARP operates in
the medium shortwave band around 10MHz. Ham operators and Shortwave
listeners have known for almost 100 years that these waves stay
contained within the atmosphere and bounce around the Earth between
the ionosphere and the Earth's surface, which they call "skip."
It was also the Pentagon that about told us about two years ago:
If a weapon or other weather modification system was directed at the Sun, complex patterns like these would provide evidence for researchers that something is actually occurring to alter the Sun's X-ray and electron output in response to what was directed at the Sun.
In other words, these charts may provide successful confirmation for weather control researchers, if solar X-rays and electron changes match a new weapon or weather modification system operation.
Perhaps we will bring the events of 2012
upon ourselves without any outside help. Time will tell.
First Sunspot in Two months is SQUARE by Ted Twietmeyer
September 24, 2008
Now we’re almost into two months…until now:
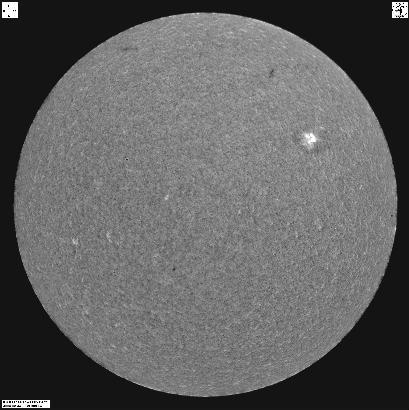
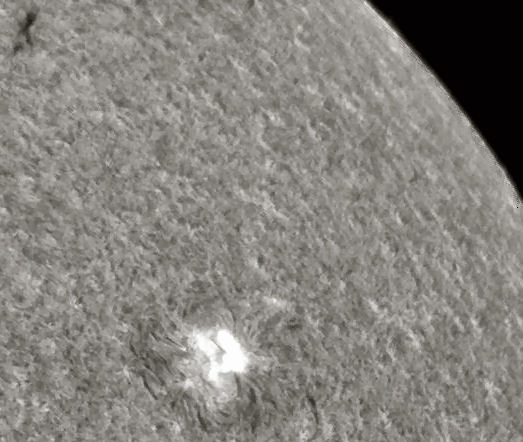
What’s quite amazing about this sunspot (which no one is talking about,) is that this sunspot appears to have a square geometry as shown in the enlargement below:
In the upper left corner a dark feature
is visible. Only a few of these objects were visible across the
entire surface when this image was taken. Superheated plasma dancing
randomly can be seen everywhere in this image. Each of these tiny
peaks are actually hundreds to thousands of miles high.
The idea of intelligent manipulation of our star immediately asks these four questions to start with:
SOURCES
Report 847
September 28, 2008
We should all be concerned about this. There is no public knowledge of what the end result will be or who has this technology.
At this time I will reserve my opinion
as to who is doing this to our only source of life on Earth.
One of the fingerprints that can reveal attempted alteration of our star is repetition. Those who are doing these “experiments” must perform repetitive operations to confirm their success. They cannot avoid using repetition to cover up their actions.
To believe that a star’s function cannot be altered is to believe that an 8 year old 60lb. boy running around the wall inside a circular swimming pool cannot make 40 tons of water rotate.
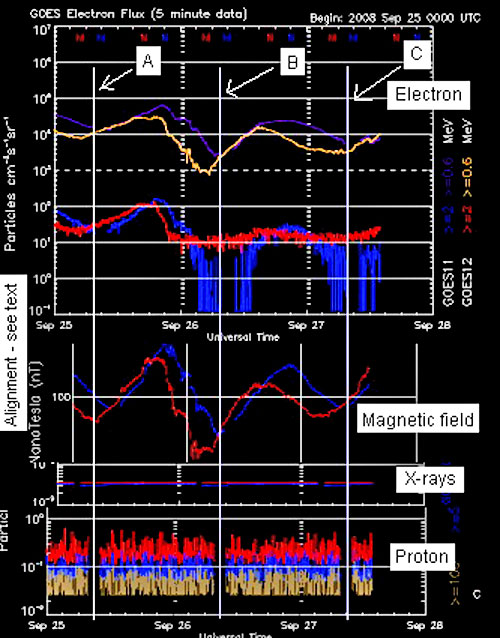
Fig. 1 The four solar generated major energy sources plotted together.
This single chart was
compiled from four different charts using only GOES satellite data.
At first glance, Fig.1 may appear a bit
complicated but I will explain what you are seeing above. Alignment
is off on the left side because of faulty government data plotting.
This occurs because the number of pixels used for each day was not
the same for four charts. This alignment problem is not the result
of chart compilation.
If we wait for completion of the data
plot for the third day all the data could easily be lost.
This means that X-rays are very low, and
near the limits of what the satellite’s sensors can detect. NASA
currently (still) has no answer for this. Our Sun is changing
and may also be slowly cooling. In past years, X-ray plots on this
same chart were always across the center portion but no more.
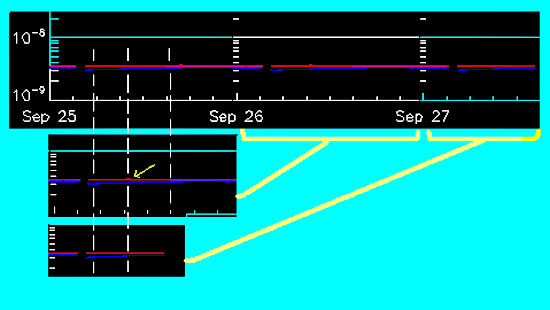
Fig 2 X-rays over the same three day period shown in Fig. 1. Copies of the X-rays for Sept. 26 and Sept. 27 have been vertically aligned here under Sept. 25 for time of day. Each small tick mark between the dates represents exactly a 3 hour period.
In Fig. 2 we see that X-rays are down to incredibly low levels.
Red and blue lines represent two different
X-ray sensors on the GOES 10 satellite. Yellow arrow points to a
small “blip” in the X-ray coming from the Sun as measured by the
satellite.
Why this doesn’t affect the red plot is
unknown.
Fig. 3 This sunspot was the first one to appear on the Sun in almost two months. It also had a square outline which is unusual. This feature occurred on Sept. 23. As of this writing on Sept. 27, this sunspot is no longer visible. The Sun’s rotation is approximately left to right in the image above which has moved this sunspot out of view. Although this spot appears small compared to the entire surface, in actuality this feature is at least the size of our moon or even larger.
(Photo credit: Big
Bear Solar Observatory, CA.)
In conclusion, the evidence is overwhelming that someone is meddling with Sun for an unknown purpose. This puts the entire human race in peril if these experiments or tampering do not alter the Sun toward a beneficial direction for Earth.
Perhaps the Mayans could see this as a
result of a solar experiment in
2012
which goes wrong.
If our Sun cooled a few hundred degrees or more, the corresponding temperature drop on Earth could plunge us into a new ice age.
|